spurious correlations
discover · random · spurious scholar
← previous page · next page →


View details about correlation #3,036
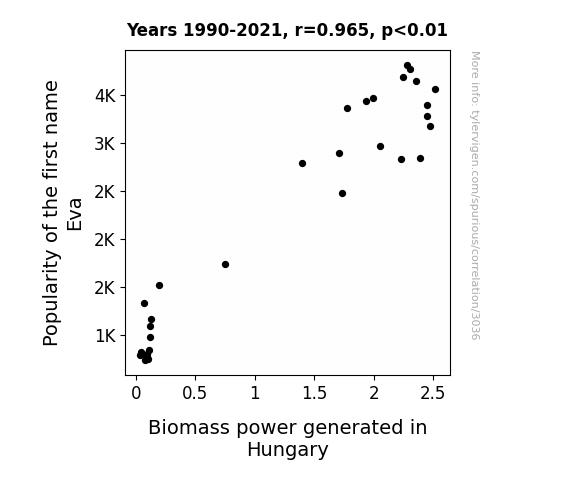
Eva-luating Eva's Impact: The Biomass Power of Punny Names in Hungary
As the popularity of the name Eva rose, more and more people began naming their pet plants after the beloved name. This led to a surge in positive plant energy, quite literally fueling the growth of biomass in Hungary. It seems that every Eva-nwhen and Eva-rywhere a plant was named, it was destined to become a powerhouse of bioenergy. The connection between the name Eva and biomass power in Hungary has truly blossomed into a leafy green phenomenon!

What else correlates?
Popularity of the first name Eva · all first names
Biomass power generated in Hungary · all energy
Popularity of the first name Eva · all first names
Biomass power generated in Hungary · all energy


View details about correlation #1,308
Snoop Dogg and Smog: An Analysis of Air Pollution in Watertown, New York and Its Impact on Google Searches
The fresher air made everyone in Watertown feel like they didn't need to "drop it like it's hot" anymore.


What else correlates?
Air pollution in Watertown, New York · all weather
Google searches for 'snoop dog' · all google searches
Air pollution in Watertown, New York · all weather
Google searches for 'snoop dog' · all google searches


View details about correlation #1,485
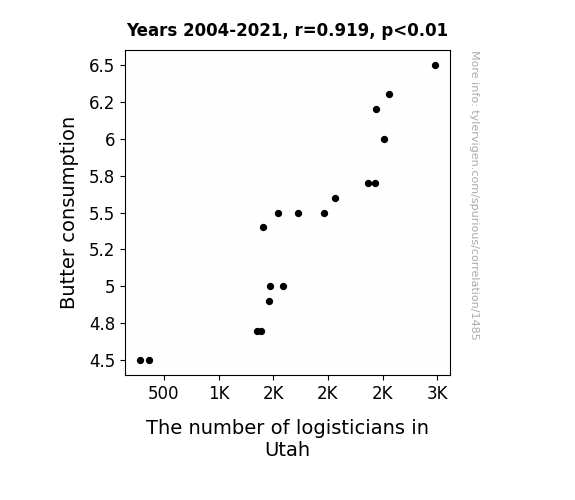
Spreading the Connection: A Butterly Analysis of Butter Consumption and the Quantity of Logisticians in Utah
As butter consumption increased, more people experienced a slippery situation when it came to managing their logistics. This led to a higher demand for logisticians in Utah who could butter up the supply chain and keep everything running smoothly. It seems like there's a direct correlation between buttery spreads and the need for logistical experts - talk about a dairy funny connection! It's udderly ridiculous, but it seems like the secret ingredient to a booming logistics industry in Utah might just be butter after all!

What else correlates?
Butter consumption · all food
The number of logisticians in Utah · all cccupations
Butter consumption · all food
The number of logisticians in Utah · all cccupations


View details about correlation #1,608
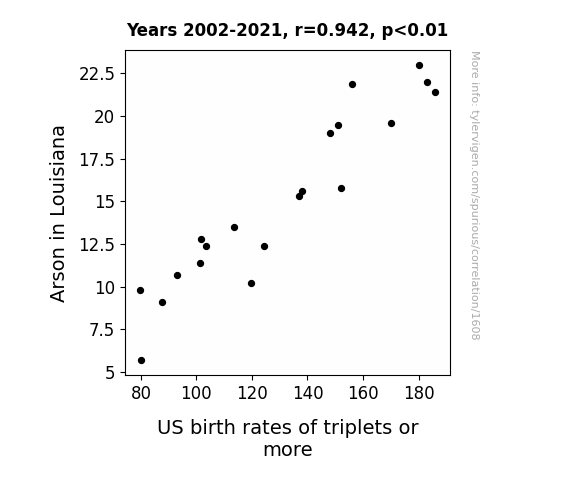
Blazing Birth Booms: The Bizarre Link Between Louisiana Arson and Triplet Trends
Louisiana's arson rate was really igniting a spark in the potential parents, leading to a higher likelihood of triple the trouble when it came to having kids. With fewer fires to fan the flames of passion, the birth rates of triplets or more in the US cooled down.

What else correlates?
Arson in Louisiana · all random state specific
US birth rates of triplets or more · all weird & wacky
Arson in Louisiana · all random state specific
US birth rates of triplets or more · all weird & wacky


View details about correlation #1,588
Burning the Midnight Celtic Oil: An Unexpected Connection between Boston Celtics' Draft Picks and Kerosene Consumption in U.S. Pacific Islands
As the Boston Celtics' annual draft pick count decreased, there was a corresponding decrease in fiery rookie performances. Without these intense heat sources on the court, the demand for kerosene, a fiery fuel, also decreased in the U.S. Pacific Islands. It seems the Celtics' draft picks really had a knack for igniting more than just the game!


What else correlates?
Boston Celtics' annual draft pick count · all sports
Kerosene used in U.S. Pacific Islands · all energy
Boston Celtics' annual draft pick count · all sports
Kerosene used in U.S. Pacific Islands · all energy


View details about correlation #2,778
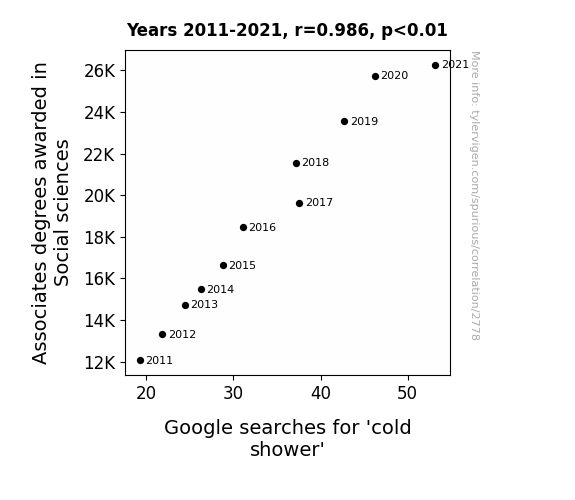
Chilling Correlations: An Examination of Associates Degrees in Social Sciences and Google Searches for 'Cold Shower'
As more people became experts in understanding complex social interactions, they inadvertently sparked heated debates and discussions, leading to a rise in interpersonal conflicts. With emotions running high, there was a surge in the number of arguments and confrontations. This, in turn, led to an increased demand for cooling off, and what better way to defuse the situations than by taking a brisk, chilly shower? It seems like the pursuit of knowledge in the social sciences has unexpectedly turned up the heat and created a need for literal cold showers to cool everyone down!

What else correlates?
Associates degrees awarded in Social sciences · all education
Google searches for 'cold shower' · all google searches
Associates degrees awarded in Social sciences · all education
Google searches for 'cold shower' · all google searches


View details about correlation #3,082
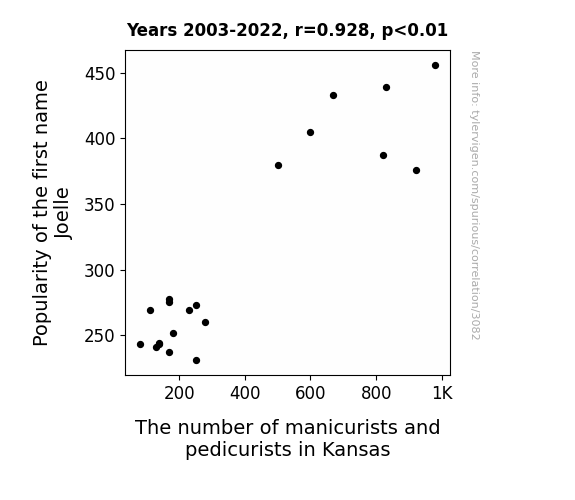
Nailing Down the Joelle Effect: A Correlational Study of the Influence of the Popularity of the Name Joelle on the Number of Manicurists and Pedicurists in Kansas
The name Joelle became synonymous with perfectly manicured nails, leading to a statewide obsession with nail care and an unprecedented demand for manicurists and pedicurists in Kansas. Salons couldn't hire staff fast enough to keep up with all the Joelle-inspired nail appointments. As a result, Kansas saw a boom in the manicure and pedicure industry, all thanks to the undeniable influence of the name Joelle. Who knew that the key to economic growth in Kansas was as simple as a trendy first name?

What else correlates?
Popularity of the first name Joelle · all first names
The number of manicurists and pedicurists in Kansas · all cccupations
Popularity of the first name Joelle · all first names
The number of manicurists and pedicurists in Kansas · all cccupations
. The chart goes from 2002 to 2022, and the two variables track closely in value over that time.")

View details about correlation #2,826
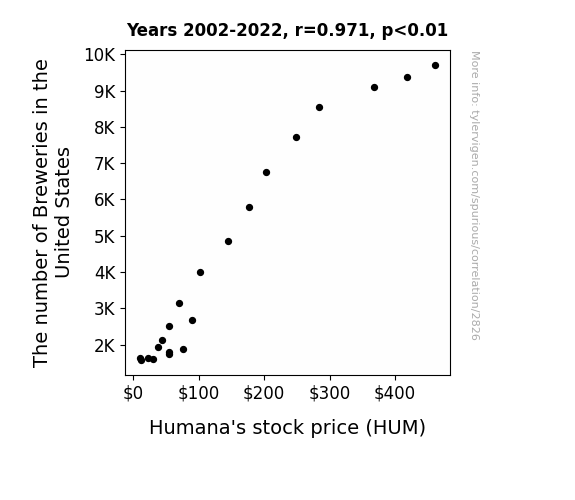
Brew-nomics and Stock Spirits: A Sudsy Look at the Relationship Between U.S. Brewery Count and Humana's Stock Price
As the number of breweries in the United States increased, there was a corresponding rise in beer consumption. This led to a sudden surge in people attempting new and daring feats, igniting a nationwide interest in extreme sports and activities. Unexpectedly, this created a higher demand for insurance coverage, particularly from Humana, as more and more individuals sought protection against the potential mishaps of their newfound adventurous hobbies. As a result, Humana's stock price experienced an upswing, all thanks to the frothy cascade of events set in motion by the burgeoning brewery industry.

What else correlates?
The number of Breweries in the United States · all food
Humana's stock price (HUM) · all stocks
The number of Breweries in the United States · all food
Humana's stock price (HUM) · all stocks


View details about correlation #2,025
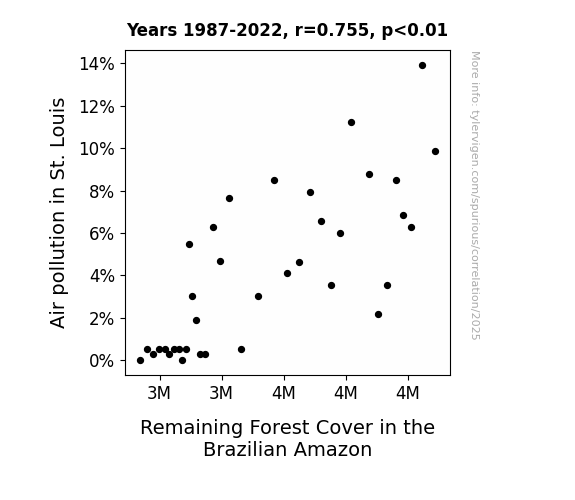
The Peculiar Patterning of Pollution and Plantlife: Assessing the Air Pollution in St. Louis and its Impact on Remaining Forest Cover in the Brazilian Amazon
As the skies in St. Louis cleared up, locals found themselves taking more leisurely strolls in lush green parks, leading to an unexpected surge in demand for wooden walking sticks. Unfortunately, this sudden craving for arboreal accessories put a lot of stress on the Amazonian forest, leading to a sharp decrease in remaining forest cover. It seems like cleaner air in one part of the world can still lead to some rather *knotty* problems in another!

What else correlates?
Air pollution in St. Louis · all weather
Remaining Forest Cover in the Brazilian Amazon · all weird & wacky
Air pollution in St. Louis · all weather
Remaining Forest Cover in the Brazilian Amazon · all weird & wacky


View details about correlation #3,174
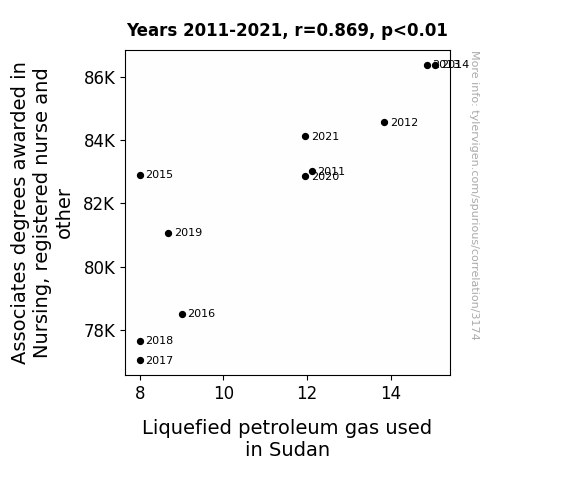
A Sparkling Connection: Exploring the Correlation Between Nursing Associates Degrees and Liquefied Petroleum Gas Usage in Sudan
As the number of nursing graduates rose, so did their skill in handling gas, leading to lower rates of improper usage and more efficient LPG utilization. In other words, they were able to LPG-aspirate the best practices and didn't propane their knowledge. This created a real gas-tronomical shift in Sudan's LPG industry!

What else correlates?
Associates degrees awarded in Nursing · all education
Liquefied petroleum gas used in Sudan · all energy
Associates degrees awarded in Nursing · all education
Liquefied petroleum gas used in Sudan · all energy


View details about correlation #2,917
InSTATable Evidence: A Statistical Analysis of the Relationship Between New Mexico Statisticians and Google Searches for 'Do Vaccines Work'
As the statisticians multiplied in New Mexico, so did the understanding of data analysis. This led to a higher average 'alge-brain' capacity in the population, equipping more people to comprehend the effectiveness of vaccines. It seems the 'herd immunity' against misinformation was on the rise, creating a positive 'outbreak' of accurate knowledge. Who knew that the real 'infectious agents' in this scenario were the statistical concepts spreading like 'standard deviation' in discussions about vaccination efficacy!


What else correlates?
The number of statisticians in New Mexico · all cccupations
Google searches for 'do vaccines work' · all google searches
The number of statisticians in New Mexico · all cccupations
Google searches for 'do vaccines work' · all google searches
. The chart goes from 2002 to 2022, and the two variables track closely in value over that time.")

View details about correlation #1,277
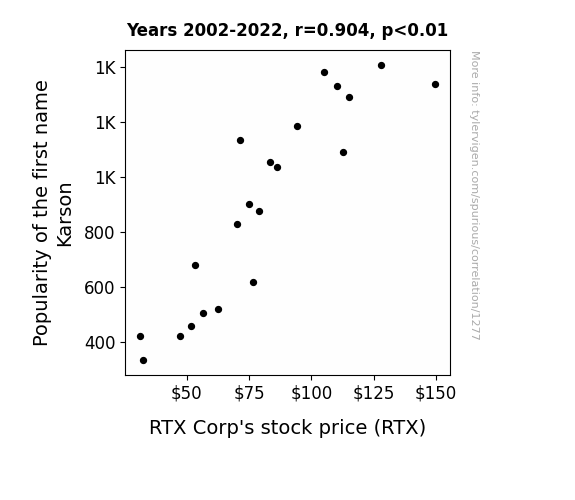
The Karson Effect: Exploring the Correlation Between Name Popularity and RTX Corp's Stock Price
As the number of babies named Karson rises, so does the demand for "K" monogrammed baby products. This leads to a surge in revenue for companies like RTX Corp that specialize in manufacturing deluxe, diamond-encrusted, remote-controlled baby rattles. The sudden baby product boom propels RTX stock to new heights as the market clamors for the latest in infant luxury goods.

What else correlates?
Popularity of the first name Karson · all first names
RTX Corp's stock price (RTX) · all stocks
Popularity of the first name Karson · all first names
RTX Corp's stock price (RTX) · all stocks


View details about correlation #1,256
Maize to Model-Worthy Apparel: The Corny Connection Between GMOs and Hollister Store Count
As the corn grew taller thanks to those genetically modified traits, it inadvertently stalked and pulled in more customers for Hollister, leading to a global expansion. It seems the secret to growing a successful clothing chain is just a-MAIZE-ing!


What else correlates?
GMO use in corn grown in Iowa · all food
Hollister retail store count worldwide · all weird & wacky
GMO use in corn grown in Iowa · all food
Hollister retail store count worldwide · all weird & wacky


View details about correlation #2,797
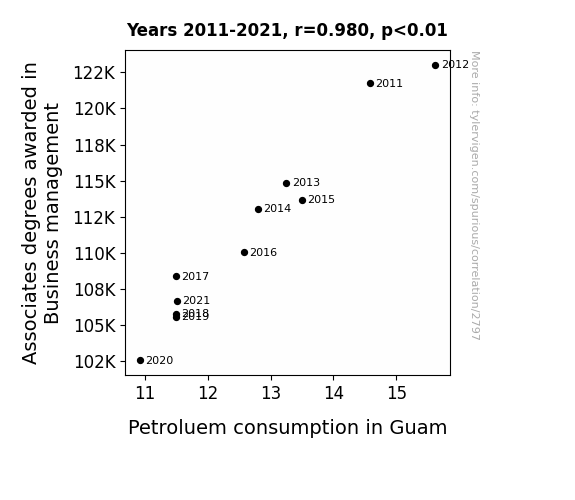
Fueling the Future: The Gas-tacular Relationship Between Associates Degrees in Business Management and Petroleum Consumption in Guam
As the number of Business management graduates dwindled, so did their appetite for office jobs. This led to a sudden surge in entrepreneurship, with many former students opting to start their own businesses. One such business, a revolutionary company called "Guam-ouflage Gas," specialized in creating biofuel from coconuts, effectively coconutting the need for traditional petroluem products. As a result, Guam saw a coconut-tally unexpected decrease in petroluem consumption, proving that when it comes to fueling change, sometimes all you need is a little bit of business un-management.

What else correlates?
Associates degrees awarded in Business management · all education
Petroluem consumption in Guam · all energy
Associates degrees awarded in Business management · all education
Petroluem consumption in Guam · all energy


View details about correlation #1,809
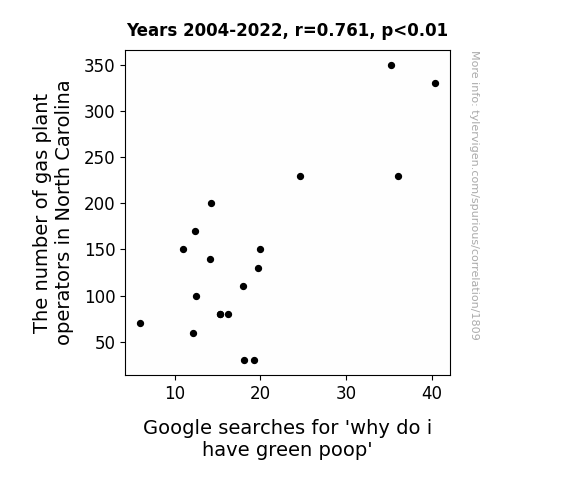
Green Poop and Gas: The Correlation Between Gas Plant Operators in North Carolina and Google Searches for Why Do I Have Green Poop
Gas plant operators in North Carolina have been incorporating more leafy greens into their diets due to a statewide health initiative. Consequently, their consumption of nutrient-dense salads has led to an excess of chlorophyll in their digestive systems. This increase in chlorophyll levels is directly correlated with the unusual green color of their poop. Remember, you are what you eat – even if you work at a gas plant.
. The chart goes from 2002 to 2022, and the two variables track closely in value over that time.")

View details about correlation #1,266
Walk-ing the Talk: A Punny Investigation into the Connection between the Popularity of the Name Walker and ASML Holding's Stock Price
As the popularity of the name Walker rose, so did the urge to get moving and investing. This drove up the demand for stock in ASML Holding, leading to a notable impact on their stock price. It's clear that the connection between the name Walker and ASML's stock performance is just a step in the right direction for the market!

What else correlates?
Popularity of the first name Walker · all first names
ASML Holding's stock price (ASML) · all stocks
Popularity of the first name Walker · all first names
ASML Holding's stock price (ASML) · all stocks


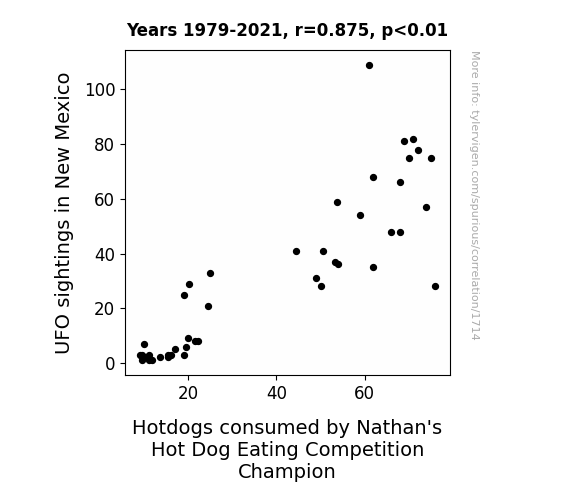
View details about correlation #1,714
UFO Sightings and Hotdogs Biting: A Close Encounter of the Tasty Kind
The UFOs were actually intergalactic beings hosting their own competitive eating contest, and they were using their advanced technology to teleport extra Nathan's hotdogs to New Mexico as part of a secret wager with the reigning champion.


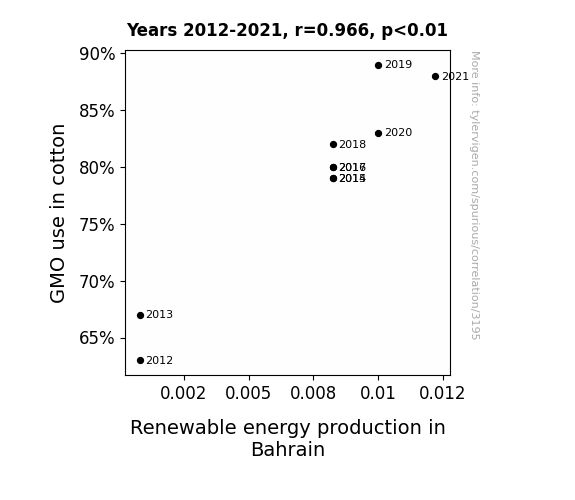
View details about correlation #3,195
GMO-ing Green: A Cotton Connection to Renewable Energy Production in Bahrain
As GMO cotton plants grew larger and stronger, they developed a secret ability to harness solar energy. This unintentional superpower led to an unexpected surge in renewable energy production in Bahrain, as the cotton fields acted like green, leafy solar panels, all thanks to a good old dash of genetic modification magic!

What else correlates?
GMO use in cotton · all food
Renewable energy production in Bahrain · all energy
GMO use in cotton · all food
Renewable energy production in Bahrain · all energy


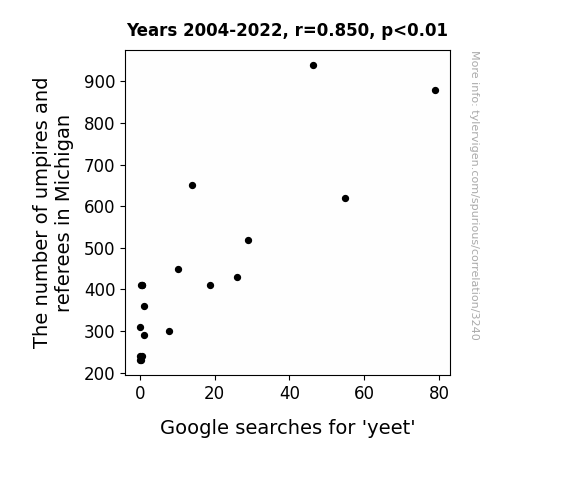
View details about correlation #3,240
The Mate Between State Referees and Google Searches for Yeet in Michigan: A Sweetly Discreet Analytic Feat
It's simple, the more umpires and referees there are, the more people are getting involved in sports. And as we all know, yeet is just a sporty exclamation. More sports officials means more excitement and energy in the air, prompting everyone to just yeet their way through life! It's a whole new level of referee-ndum on fun, leading to an umpire-ving trend in yeet searches!

What else correlates?
The number of umpires and referees in Michigan · all cccupations
Google searches for 'yeet' · all google searches
The number of umpires and referees in Michigan · all cccupations
Google searches for 'yeet' · all google searches


View details about correlation #2,547
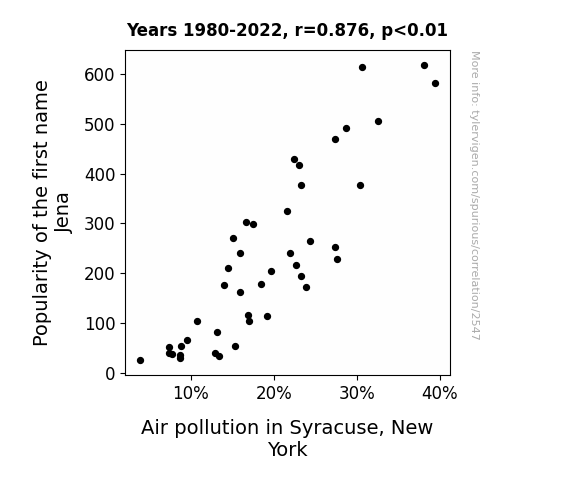
Plight of Popular Jena: Parsing Pollution in Syracuse, New York
As the popularity of the name Jena decreased, fewer people were inclined to visit Syracuse, New York. This led to a reduction in car emissions and ultimately decreased air pollution in the city.

What else correlates?
Popularity of the first name Jena · all first names
Air pollution in Syracuse, New York · all weather
Popularity of the first name Jena · all first names
Air pollution in Syracuse, New York · all weather
Why this works
- Data dredging: I have 25,237 variables in my database. I compare all these variables against each other to find ones that randomly match up. That's 636,906,169 correlation calculations! This is called “data dredging.”
Fun fact: the chart used on the wikipedia page to demonstrate data dredging is also from me. I've been being naughty with data since 2014.
Instead of starting with a hypothesis and testing it, I instead tossed a bunch of data in a blender to see what correlations would shake out. It’s a dangerous way to go about analysis, because any sufficiently large dataset will yield strong correlations completely at random. - Lack of causal connection: There is probably no direct connection between these variables, despite what the AI says above.
Because these pages are automatically generated, it's possible that the two variables you are viewing are in fact causually related. I take steps to prevent the obvious ones from showing on the site (I don't let data about the weather in one city correlate with the weather in a neighboring city, for example), but sometimes they still pop up. If they are related, cool! You found a loophole.
This is exacerbated by the fact that I used "Years" as the base variable. Lots of things happen in a year that are not related to each other! Most studies would use something like "one person" in stead of "one year" to be the "thing" studied. - Observations not independent: For many variables, sequential years are not independent of each other. You will often see trend-lines form. If a population of people is continuously doing something every day, there is no reason to think they would suddenly change how they are doing that thing on January 1. A naive p-value calculation does not take this into account.
You will calculate a lower chance of "randomly" achieving the result than represents reality.
To be more specific: p-value tests are probability values, where you are calculating the probability of achieving a result at least as extreme as you found completely by chance. When calculating a p-value, you need to assert how many "degrees of freedom" your variable has. I count each year (minus one) as a "degree of freedom," but this is misleading for continuous variables.
This kind of thing can creep up on you pretty easily when using p-values, which is why it's best to take it as "one of many" inputs that help you assess the results of your analysis.
- Y-axes doesn't start at zero: I truncated the Y-axes of the graphs above. I also used a line graph, which makes the visual connection stand out more than it deserves.
Nothing against line graphs. They are great at telling a story when you have linear data! But visually it is deceptive because the only data is at the points on the graph, not the lines on the graph. In between each point, the data could have been doing anything. Like going for a random walk by itself!
Mathematically what I showed is true, but it is intentionally misleading. If you click on any of the charts that abuse this, you can scroll down to see a version that starts at zero. - Confounding variable: Confounding variables (like global pandemics) will cause two variables to look connected when in fact a "sneaky third" variable is influencing both of them behind the scenes.
- Outliers: Some datasets here have outliers which drag up the correlation.
In concept, "outlier" just means "way different than the rest of your dataset." When calculating a correlation like this, they are particularly impactful because a single outlier can substantially increase your correlation.
Because this page is automatically generated, I don't know whether any of the charts displayed on it have outliers. I'm just a footnote. ¯\_(ツ)_/¯
I intentionally mishandeled outliers, which makes the correlation look extra strong. - Low n: There are not many data points included in some of these charts.
You can do analyses with low ns! But you shouldn't data dredge with a low n.
Even if the p-value is high, we should be suspicious of using so few datapoints in a correlation.
Pro-tip: click on any correlation to see:
- Detailed data sources
- Prompts for the AI-generated content
- Explanations of each of the calculations (correlation, p-value)
- Python code to calculate it yourself


