spurious correlations
discover · random · spurious scholar
← previous page · next page →


View details about correlation #4,784
From Almonds to Zany Comments: Exploring the Link between US Tree Nut Consumption and Mark Rober's YouTube Comments
As people developed a taste for tree nuts, they became more nimble-fingered from all that shelling, leading to an uptick in typing speed and the ability to leave comments faster. Plus, the overall nuttiness of the situation just cracked everyone up, prompting them to engage more with Mark Rober's videos.


What else correlates?
US Tree Nut Consumption per Person · all weird & wacky
Total comments on Mark Rober YouTube videos · all YouTube
US Tree Nut Consumption per Person · all weird & wacky
Total comments on Mark Rober YouTube videos · all YouTube


View details about correlation #1,481
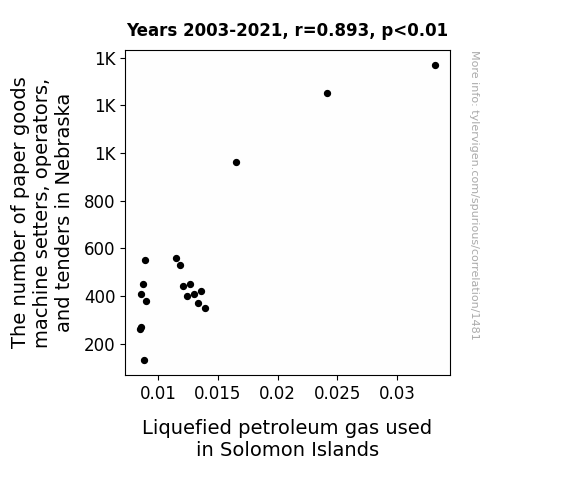
Rolling in the Links: Unraveling the Wacky Connection Between Paper Goods Machine Setters in Nebraska and Liquefied Petroleum Gas Consumption in Solomon Islands
As the number of paper goods machine setters, operators, and tenders in Nebraska decreased, there was a simultaneous decrease in the production of paper goods. Surprisingly, this led to a nationwide surplus of paper plates. To make use of this surplus, the ingenious solution was to create a fleet of paper plate boats, which were powered by Liquefied Petroleum Gas. These eco-friendly vessels became the primary mode of transportation in Solomon Islands, leading to a significant decrease in the overall usage of Liquefied Petroleum Gas. The paper plate boats not only helped reduce gas consumption, but also sparked a new trend in sustainable boating, with the added benefit of spontaneous picnics on the high seas. It just goes to show, one state's decline in paper goods professionals can fuel a whole new era of seafaring adventures in a far-off island nation!


View details about correlation #4,149
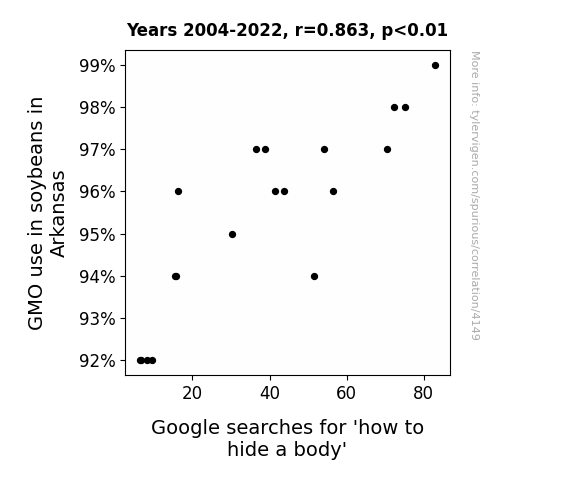
Genetically Modified Grains and Google Searches: Grisly Evidence of a Sinister Synergy
As the soybeans grew larger and larger due to genetic modification, it became easier to disguise a body amid the towering GM soybean plants. The increased foliage provided ample coverage, leading to a surge in searches as individuals realized the potential for using soybean fields as makeshift hideaways.

What else correlates?
GMO use in soybeans in Arkansas · all food
Google searches for 'how to hide a body' · all google searches
GMO use in soybeans in Arkansas · all food
Google searches for 'how to hide a body' · all google searches


View details about correlation #3,998
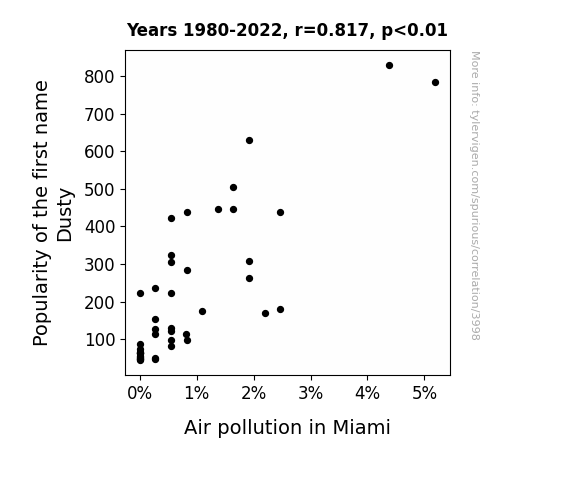
Dusty Name, Dusty Air: The Correlation between the Popularity of the Name Dusty and Air Pollution in Miami
Less demand for personalized airbrushed license plates and truck decals resulted in fewer particles being released into the air during application.

What else correlates?
Popularity of the first name Dusty · all first names
Air pollution in Miami · all weather
Popularity of the first name Dusty · all first names
Air pollution in Miami · all weather
. The chart goes from 2002 to 2022, and the two variables track closely in value over that time.")

View details about correlation #4,104
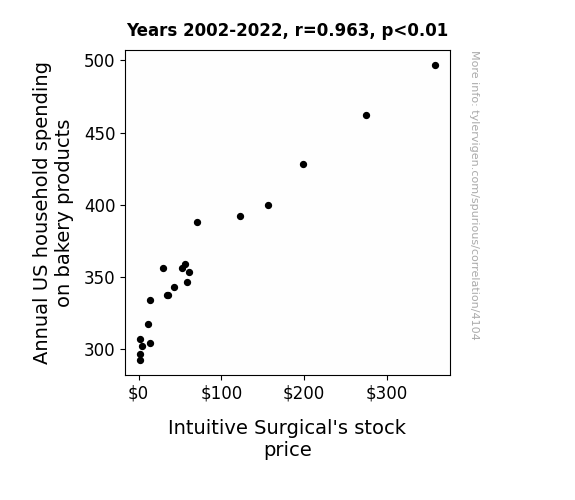
Dough Nation: Exploring the Rise of Bakery Spending and Intuitive Surgical's Stock Price
As households indulged in more pastries and breads, there was a rise in dough flow. This yeast to the occasion, leading to higher demand for medical procedures, particularly for robotic surgery, hence driving up the stock price of Intuitive Surgical. It seems like the market was in knead of their innovative healthcare technology!

What else correlates?
Annual US household spending on bakery products · all weird & wacky
Intuitive Surgical's stock price (ISRG) · all stocks
Annual US household spending on bakery products · all weird & wacky
Intuitive Surgical's stock price (ISRG) · all stocks


View details about correlation #2,287
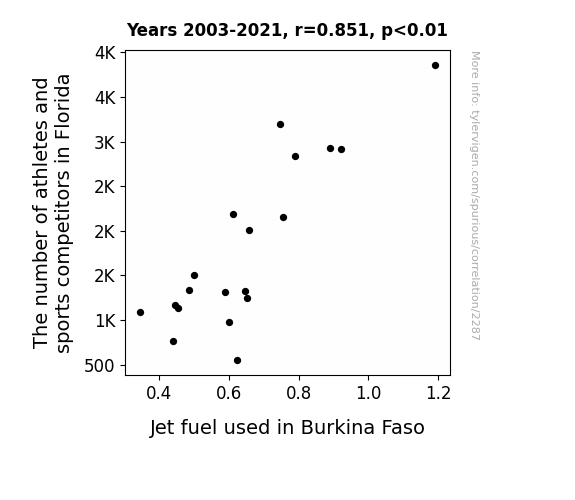
For the Exercise-Crazed and Fuel-Amazed: The Relationship Between Florida's Athletes and Burkina Faso's Jet Fuel
As more athletes trained in Florida, their competitive drive created a need for faster transportation. This led to a surge in private jet usage, causing an unexpected spike in jet fuel demand all the way in Burkina Faso, where the skies were suddenly busier than a championship game! It's a literal case of Florida's sporting success taking off and fueling the distant dreams of Burkina Faso's aviation industry.
What else correlates?
The number of athletes and sports competitors in Florida · all cccupations
Jet fuel used in Burkina Faso · all energy
The number of athletes and sports competitors in Florida · all cccupations
Jet fuel used in Burkina Faso · all energy


View details about correlation #4,026
Milky Mayhem: Exploring the Link Between Milk Consumption and Arson in North Carolina
As milk consumption decreased, there was a corresponding decrease in the production of dairy-related puns. This led to a reduced incidence of fiery wordplay, ultimately dampening the spark for arson in North Carolina. In udderly unrelated news, the moo-d in the state has also improved, as people have become more goat-ten and less likely to have a beef that could lead to a heated situation. So, let’s raise a glass of milk to a calmer, dairy-free, and utterly cheesy explanation for the unexpected correlation between milk consumption and arson rates in North Carolina!


What else correlates?
Milk consumption · all food
Arson in North Carolina · all random state specific
Milk consumption · all food
Arson in North Carolina · all random state specific


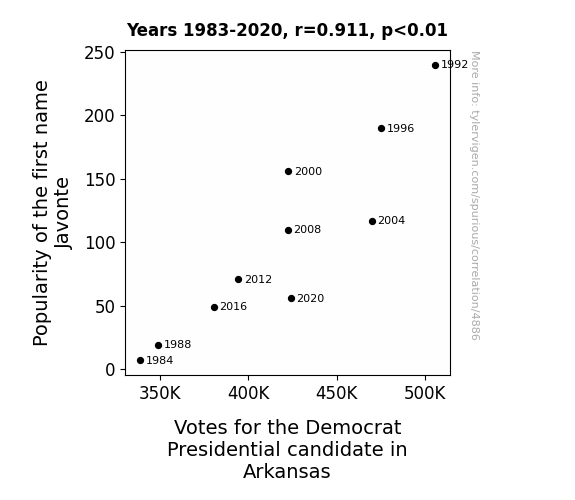
View details about correlation #4,886
Javonte or Not Javonte: The Influence of Name Popularity on Political Preferences in Arkansas
More people were Javonteering towards the Democratic candidate.


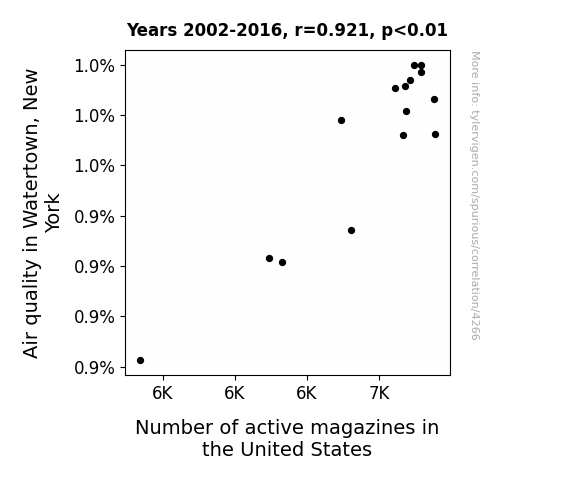
View details about correlation #4,266
Air Quality and Magazine Boom: Unraveling the Link Between Watertown, New York and the United States' Magazine Industry
The fresh, clean air in Watertown inspired a surge in magazine production nationwide. It's amazing what a breath of fresh air can do for the publishing industry!

What else correlates?
Air quality in Watertown, New York · all weather
Number of active magazines in the United States · all weird & wacky
Air quality in Watertown, New York · all weather
Number of active magazines in the United States · all weird & wacky


View details about correlation #4,031
Bio-Kero Connections: Investigating the Correlation Between Biological Technicians in South Dakota and Kerosene Usage in Turkmenistan
As the biological technicians in South Dakota conducted their experiments and trials, they inadvertently created a new strain of super corn. This super corn, when processed, yielded a byproduct that surprisingly enhanced the efficiency of kerosene production in Turkmenistan. It's a-maize-ing how this unforeseen connection has sparked a kernel of truth in the fuel industry!


What else correlates?
The number of biological technicians in South Dakota · all cccupations
Kerosene used in Turkmenistan · all energy
The number of biological technicians in South Dakota · all cccupations
Kerosene used in Turkmenistan · all energy
. The chart goes from 2012 to 2021, and the two variables track closely in value over that time.")

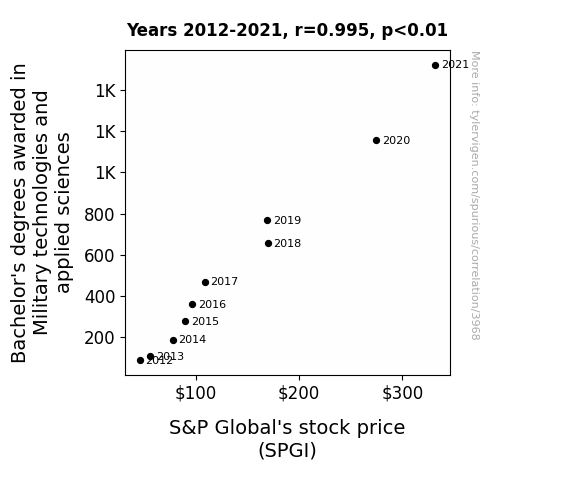
View details about correlation #3,968
From Bombs to Bulls: The Explosive Impact of Bachelor's Degrees in Military Technologies on S&P Global's Stock Price
As more people became knowledgeable about military technologies and applied sciences, they started developing innovative ways to conquer the stock market. Maybe they used their expertise to create strategic trading algorithms or their understanding of weaponry to "target" the best investment opportunities. Ultimately, it seems that a surge in military-tech-savvy individuals may have inadvertently orchestrated a financial coup, leading to the rise in SPGI stock price.

What else correlates?
Bachelor's degrees awarded in Military technologies · all education
S&P Global's stock price (SPGI) · all stocks
Bachelor's degrees awarded in Military technologies · all education
S&P Global's stock price (SPGI) · all stocks


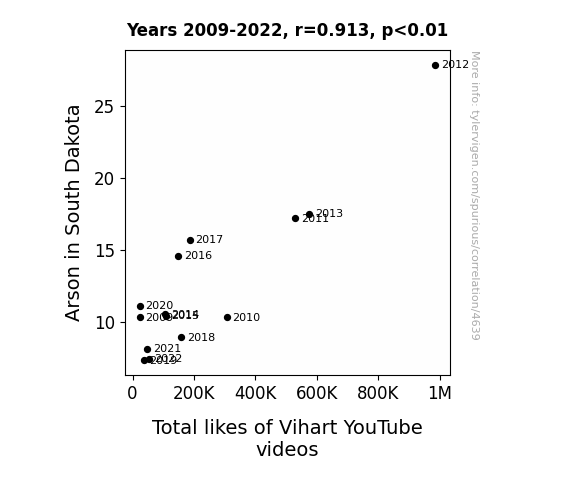
View details about correlation #4,639
Playing with Fire: An Unlikely Connection Between Arson in South Dakota and the Total Likes of Vihart YouTube Videos
As more and more fires were set ablaze in South Dakota, local firefighters found solace in unwinding with Vihart's mesmerizing math and music videos. The dopamine rush from successfully extinguishing the flames was only heightened by the soothing voice and captivating content, leading to an unprecedented surge in total likes for Vihart's YouTube videos. It seems like these firefighters were not just experts in combating fire, but also in fanning the flames of Vihart's online success!

What else correlates?
Arson in South Dakota · all random state specific
Total likes of Vihart's YouTube videos · all YouTube
Arson in South Dakota · all random state specific
Total likes of Vihart's YouTube videos · all YouTube


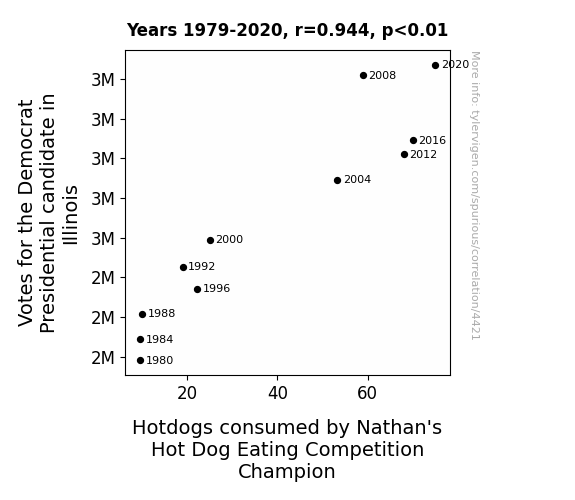
View details about correlation #4,421
The Democratic Delight: Mightier Match of Illinois Votes and Nathan's Hot Dog Devouring Doyens
The democratic candidate's success led to a surge in political barbecue fundraisers. This created a high demand for hotdogs, inadvertently boosting the morale of the Nathan's Hot Dog Eating Competition Champion. As the democratic votes rolled in, so did the extra buns for the hotdog champ, proving that in the world of competitive eating, it's all about relishing the opportunity.


View details about correlation #4,887
Perfuming Postmaster Placement: Pittsburgh Plume Predisposes Peculiar Postal Positions
As air quality improved in Cincinnati, carrier pigeons no longer needed to take extended sick leaves, leading to a surplus of highly skilled bird employees at the post office. Unable to find suitable positions for this influx of avian talent, the number of postmasters in Ohio naturally decreased as the pigeons took over all the important roles.


What else correlates?
Air pollution in Cincinnati · all weather
The number of postmasters in Ohio · all cccupations
Air pollution in Cincinnati · all weather
The number of postmasters in Ohio · all cccupations


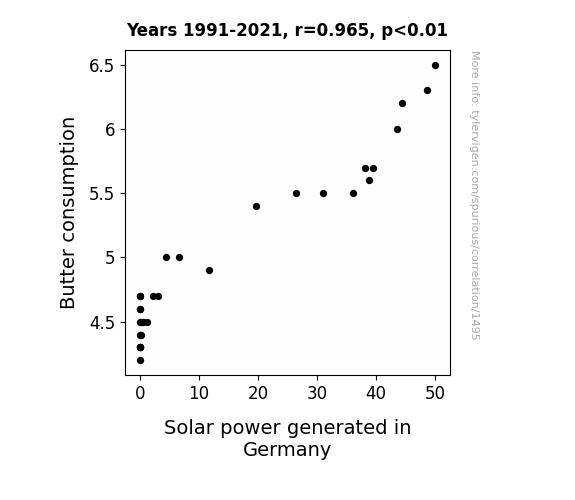
View details about correlation #1,495
Shedding Light on the Butter-Solar Nexus: A Gouda Connection
As butter consumption increased, so did the average girth of the population. This led to more people needing larger doorways and, consequently, more home renovations. These renovations sparked an unexpected trend in solar panel installations, as homeowners looked for ways to offset the costs. So, in a roundabout way, buttery indulgence inadvertently spread a little extra sunshine on Germany's solar power production.

What else correlates?
Butter consumption · all food
Solar power generated in Germany · all energy
Butter consumption · all food
Solar power generated in Germany · all energy


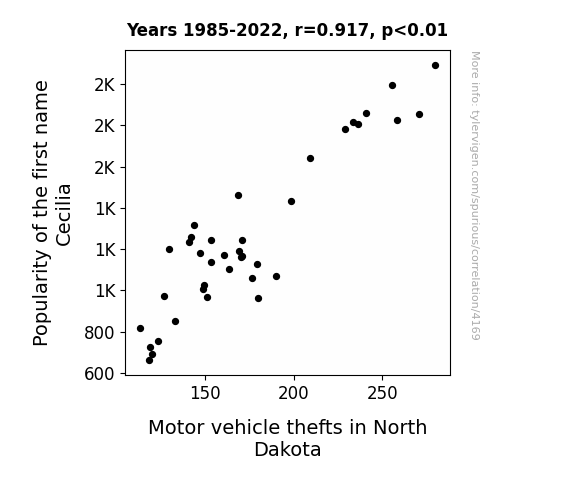
View details about correlation #4,169
Stealing the Spotlight: The Cecilia Phenomenon and Motor Vehicle Thefts in North Dakota
More cars were being personalized with the name "Cecilia" on the rearview mirror, making them prime targets for thieves who wanted to impress their own Cecilia's with a stolen car accessory. The Cecilia car charm black market in North Dakota was booming, leading to an overall spike in motor vehicle thefts. It was a classic case of too many Cecilia's leading to grand theft auto-matic!

What else correlates?
Popularity of the first name Cecilia · all first names
Motor vehicle thefts in North Dakota · all random state specific
Popularity of the first name Cecilia · all first names
Motor vehicle thefts in North Dakota · all random state specific


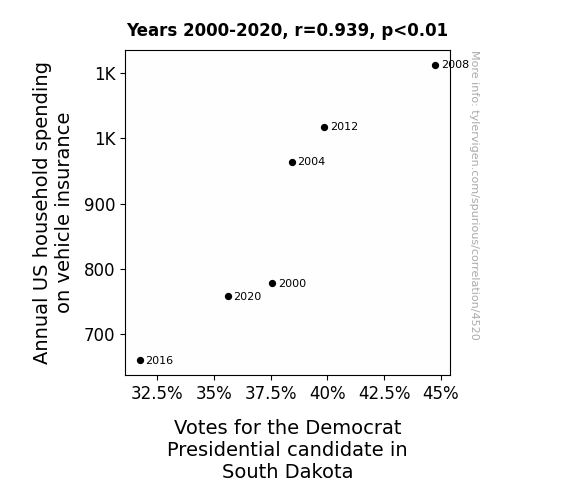
View details about correlation #4,520
Vehicle Vices: Vote Veracity in South Dakota
As household spending on vehicle insurance goes up, so does the cost of being a good driver! This leads to more people in South Dakota feeling the 'Bern' when it comes to voting for the Democrat Presidential candidate. After all, they want someone who can steer the country in the right direction and brake the cycle of political gridlock. It's like they say, when it comes to elections, every vote counts – just like every discounted premium for safe driving! Remember, it's not the poli-sea, it's the policy!


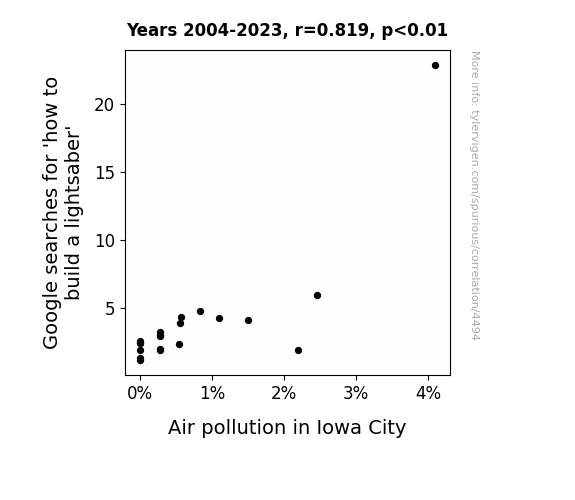
View details about correlation #4,494
Shedding Some Light on Lightsabers: Exploring the Correlation Between Google Searches for 'How to Build a Lightsaber' and Air Pollution in Iowa City
As more and more people attempted to construct their own flashy plasma swords, the demand for industrial-grade power sources skyrocketed. Unbeknownst to many, the preferred energy cells for these DIY lightsabers were actually repurposed corn-based biofuel cells, leading to a surge in corn production in Iowa. With fields of cornstalks stretching as far as the eye could see, it somehow led to a heightened pollen count in the area. This uptick in pollen aggravated the local allergies of certain Iowans, prompting them to stay indoors with their air purifiers running constantly. Little did they realize that this inadvertently decreased their overall outdoor carbon emissions, inadvertently contributing to cleaner air around them. The Force of cleaner air was indeed strong in this corn-laden scenario!

What else correlates?
Google searches for 'how to build a lightsaber' · all google searches
Air pollution in Iowa City · all weather
Google searches for 'how to build a lightsaber' · all google searches
Air pollution in Iowa City · all weather


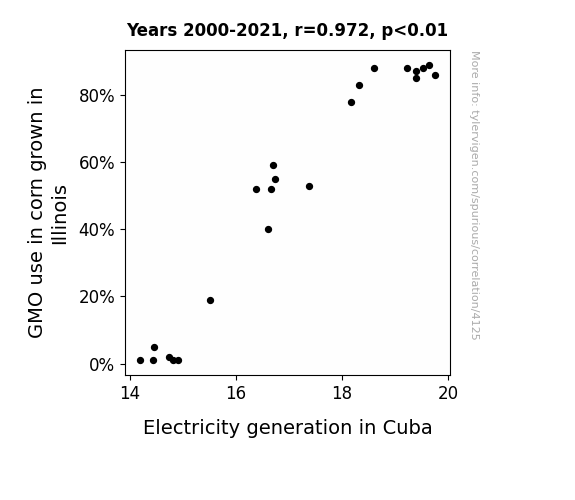
View details about correlation #4,125
Kernels of Power: Uncovering the Shocking Link Between GMO Corn Production in Illinois and Electricity Generation in Cuba
As the genetically modified corn in Illinois thrived, it emitted a small amount of electricity due to a built-in bioelectric mechanism. This unexpected power surge traveled through the ground to the shores of Cuba, where it was harnessed by resourceful locals using unconventional methods. This shocking development has left experts in disbelief, sparking a kernel of excitement in the agricultural and energy sectors.

What else correlates?
GMO use in corn grown in Illinois · all food
Electricity generation in Cuba · all energy
GMO use in corn grown in Illinois · all food
Electricity generation in Cuba · all energy


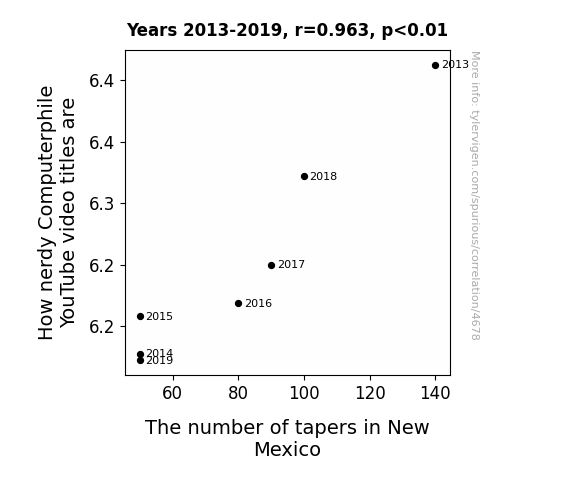
View details about correlation #4,678
From Bits to Bureaus: The Curious Case of Nerdy Computerphile Video Titles and New Mexico Tapers
Fewer tapers in New Mexico means less current flowing through the state, leading to a lower nerd resistance. As the nerd resistance decreases, the overall nerdy video titles in the entire Computerphile YouTube channel circuit are able to flow more freely, resulting in a decrease in How nerdy they are. It's shocking how much of an impact these tapers can have on the world of technology and pun-intended humor!

What else correlates?
How nerdy Computerphile YouTube video titles are · all YouTube
The number of tapers in New Mexico · all cccupations
How nerdy Computerphile YouTube video titles are · all YouTube
The number of tapers in New Mexico · all cccupations
Why this works
- Data dredging: I have 25,237 variables in my database. I compare all these variables against each other to find ones that randomly match up. That's 636,906,169 correlation calculations! This is called “data dredging.”
Fun fact: the chart used on the wikipedia page to demonstrate data dredging is also from me. I've been being naughty with data since 2014.
Instead of starting with a hypothesis and testing it, I instead tossed a bunch of data in a blender to see what correlations would shake out. It’s a dangerous way to go about analysis, because any sufficiently large dataset will yield strong correlations completely at random. - Lack of causal connection: There is probably no direct connection between these variables, despite what the AI says above.
Because these pages are automatically generated, it's possible that the two variables you are viewing are in fact causually related. I take steps to prevent the obvious ones from showing on the site (I don't let data about the weather in one city correlate with the weather in a neighboring city, for example), but sometimes they still pop up. If they are related, cool! You found a loophole.
This is exacerbated by the fact that I used "Years" as the base variable. Lots of things happen in a year that are not related to each other! Most studies would use something like "one person" in stead of "one year" to be the "thing" studied. - Observations not independent: For many variables, sequential years are not independent of each other. You will often see trend-lines form. If a population of people is continuously doing something every day, there is no reason to think they would suddenly change how they are doing that thing on January 1. A naive p-value calculation does not take this into account.
You will calculate a lower chance of "randomly" achieving the result than represents reality.
To be more specific: p-value tests are probability values, where you are calculating the probability of achieving a result at least as extreme as you found completely by chance. When calculating a p-value, you need to assert how many "degrees of freedom" your variable has. I count each year (minus one) as a "degree of freedom," but this is misleading for continuous variables.
This kind of thing can creep up on you pretty easily when using p-values, which is why it's best to take it as "one of many" inputs that help you assess the results of your analysis.
- Y-axes doesn't start at zero: I truncated the Y-axes of the graphs above. I also used a line graph, which makes the visual connection stand out more than it deserves.
Nothing against line graphs. They are great at telling a story when you have linear data! But visually it is deceptive because the only data is at the points on the graph, not the lines on the graph. In between each point, the data could have been doing anything. Like going for a random walk by itself!
Mathematically what I showed is true, but it is intentionally misleading. If you click on any of the charts that abuse this, you can scroll down to see a version that starts at zero. - Confounding variable: Confounding variables (like global pandemics) will cause two variables to look connected when in fact a "sneaky third" variable is influencing both of them behind the scenes.
- Outliers: Some datasets here have outliers which drag up the correlation.
In concept, "outlier" just means "way different than the rest of your dataset." When calculating a correlation like this, they are particularly impactful because a single outlier can substantially increase your correlation.
Because this page is automatically generated, I don't know whether any of the charts displayed on it have outliers. I'm just a footnote. ¯\_(ツ)_/¯
I intentionally mishandeled outliers, which makes the correlation look extra strong. - Low n: There are not many data points included in some of these charts.
You can do analyses with low ns! But you shouldn't data dredge with a low n.
Even if the p-value is high, we should be suspicious of using so few datapoints in a correlation.
Pro-tip: click on any correlation to see:
- Detailed data sources
- Prompts for the AI-generated content
- Explanations of each of the calculations (correlation, p-value)
- Python code to calculate it yourself


