spurious correlations
discover · random · spurious scholar
← previous page · next page →


View details about correlation #4,812
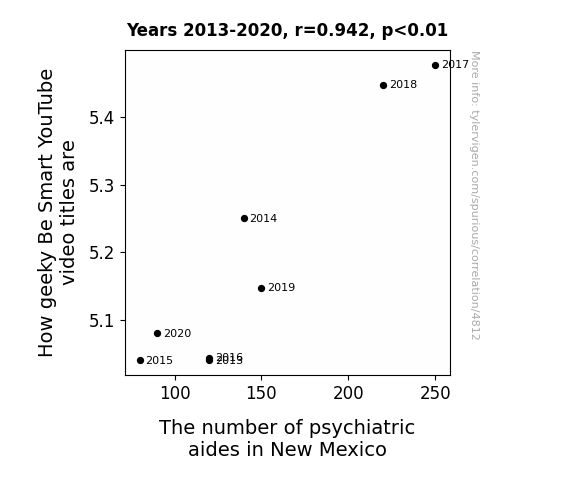
From Geek to Psych! Exploring the Correlation Between YouTube Video Titles and Psychiatric Aides in New Mexico
The influx of viewers experiencing existential crises after watching the videos has created a pressing need for psychiatric support. As more people ponder the meaning of life, the demand for psychiatric aides in New Mexico has skyrocketed. It's a race against time to ensure there are enough aides to calmly talk viewers down from their philosophical conundrums. Remember, when it comes to geeky wisdom, it's all fun and games until someone needs a therapy session!


View details about correlation #4,849
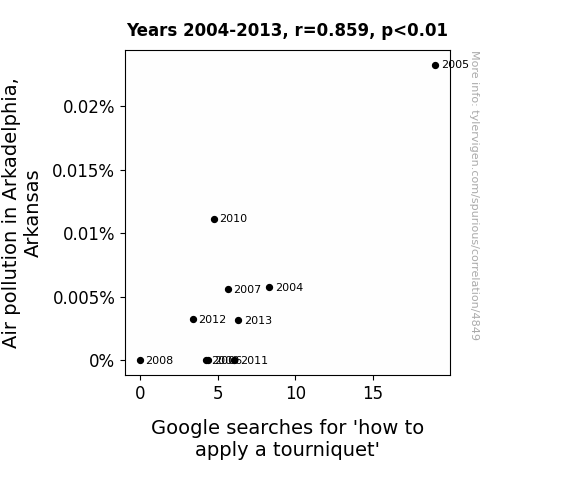
The Smoggy Suture: Investigating the Relationship Between Air Pollution in Arkadelphia, Arkansas and Google Searches for 'How to Apply a Tourniquet'
As the air quality worsened, residents started gasping for air, inadvertently exercising their arms in a desperate attempt to fan away the pollution, effectively improving their tourniquet-applying skills. It seems the smog in the air led to a surge in 'tie-dye' enthusiasts, who, in their quest to filter out the filth, unwittingly became experts in 'artery artistry.' Who knew that in Arkadelphia, Arkansas, dirty air would lead to cleaner, safer 'vein' streets!

What else correlates?
Air pollution in Arkadelphia, Arkansas · all weather
Google searches for 'how to apply a tourniquet' · all google searches
Air pollution in Arkadelphia, Arkansas · all weather
Google searches for 'how to apply a tourniquet' · all google searches


View details about correlation #4,144
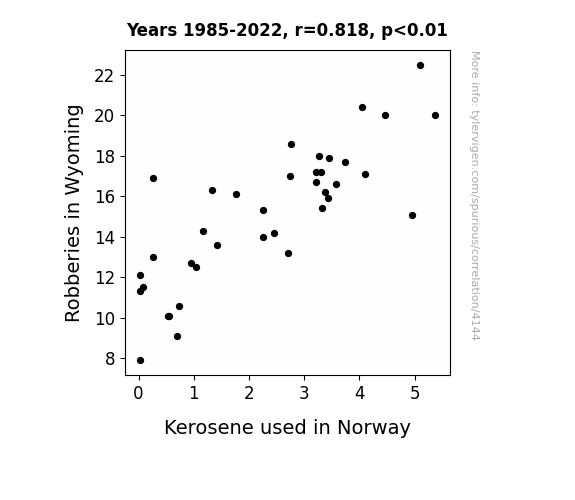
The Lighter Side of Crime: A Burning Connection Between Robberies in Wyoming and Kerosene Consumption in Norway
As the number of robberies in Wyoming decreased, there was a corresponding decrease in the demand for getaway vehicles. This led to a surplus of kerosene in the state, which was then exported to Norway. As a result, the overall kerosene usage in Norway decreased, contributing to a cleaner and more efficient energy landscape. Who knew that the path to a greener future could involve taking a bite out of crime in the Wild West!

What else correlates?
Robberies in Wyoming · all random state specific
Kerosene used in Norway · all energy
Robberies in Wyoming · all random state specific
Kerosene used in Norway · all energy


View details about correlation #4,464
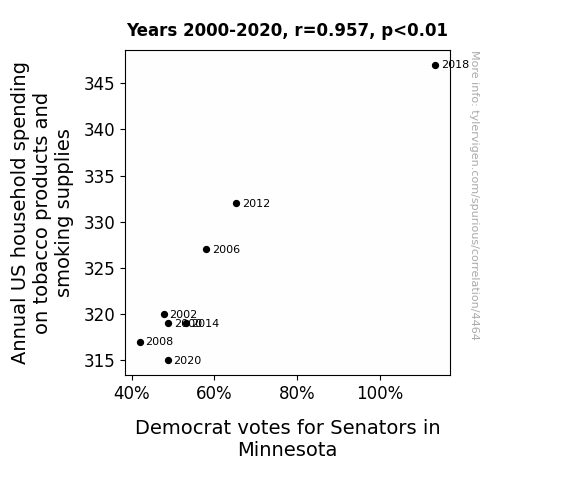
Up in Smoke: An Analysis of the Relationship Between Tobacco Spending and Democratic Votes in Minnesota
As household spending on tobacco products and smoking supplies increased, there was a corresponding increase in the production of smoke. This led to the formation of smoke signals, inadvertently influencing the voters in Minnesota. The correlation suggests that as more smoke filled the air, it carried subliminal messages favoring Democratic senators, ultimately swaying the election outcomes. This is, of course, a preposterous and whimsical notion with no scientific basis.


View details about correlation #4,510
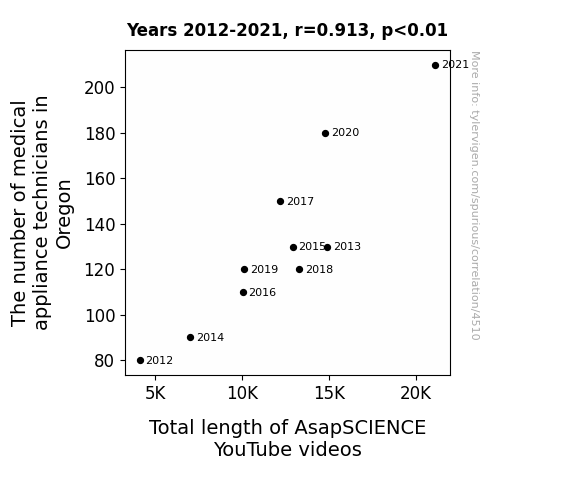
The Correlation Between the Fabrication Nation and YouTube Duration: A Medically Absurd Investigation
As the number of medical appliance technicians in Oregon rises, so does the average length of ASAPSCIENCE videos, because now there are more people in the state to help them extend their reach. After all, who better to assist with stretching out content than a group of professionals who specialize in making things longer and more durable? It's like they're applying their expertise to elongate the videos, ensuring that the creators can continue to deliver in-depth and extensive explanations on scientific topics.


View details about correlation #4,609
Got Milk? Exploring the Milky Way: A Holistic Approach to Investigate the Relationship between Milk Consumption and Air Pollution in Canton, Ohio
As people switched to almond and oat milk, there was a reduced dairy air quality in Canton. This udderly unexpected change curd not be ignored, as it led to a dairy good improvement in air pollution. It's a-moo-sing how something as unrelated as milk consumption could whey in on the air quality in Canton!


What else correlates?
Milk consumption · all food
Air pollution in Canton, Ohio · all weather
Milk consumption · all food
Air pollution in Canton, Ohio · all weather


View details about correlation #3,896
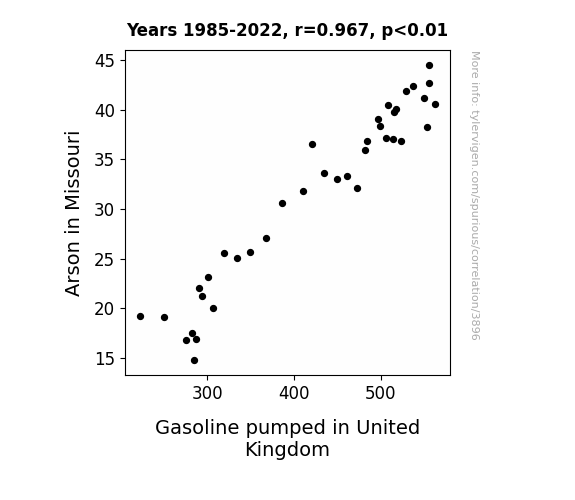
Burning Issues: Exploring the Fiery Relationship between Arson in Missouri and Gasoline in the United Kingdom
As the saying goes, "No fire in the Show-Me State means no need for fuel across the pond!" Without as many fiery incidents in Missouri, there was simply less demand for gasoline. This unexpected correlation has sparked a new potential approach to global fuel supply and demand management: fighting fire with, well, not needing fuel in the first place! Watch out, international energy market – Missouri is redefining what it means to "fire up" the economy. The real question now is: Can this trend lead to world peace or intergalactic rocket fuel harmony? Keep your eyes on the pump for the next sizzling installment of "Missouri's Flame-Proof Impact on Global Gas!" Remember to always fuel your day with a healthy dose of skepticism and a spark of laughter!
What else correlates?
Arson in Missouri · all random state specific
Gasoline pumped in United Kingdom · all energy
Arson in Missouri · all random state specific
Gasoline pumped in United Kingdom · all energy
. The chart goes from 2002 to 2022, and the two variables track closely in value over that time.")

View details about correlation #3,756
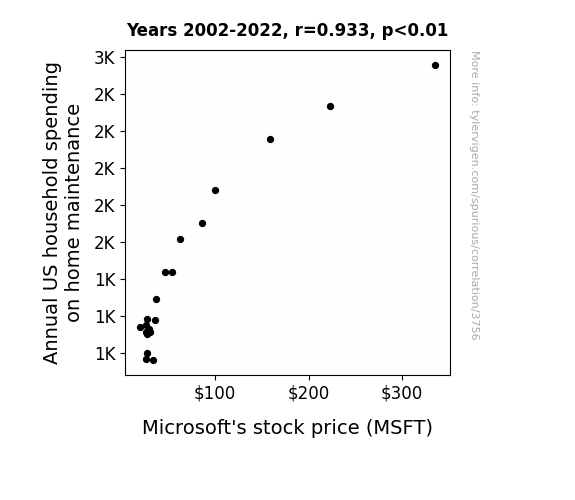
The Home is Where the Stock is Effect: Understanding the Relationship Between Annual US Household Spending on Home Maintenance and Microsoft's Stock Price
As Americans invested more in fixing up their homes, the demand for Windows (the glass kind) skyrocketed, leading to a surge in profits for glass manufacturers. This positive growth in the glass industry directly reflected on the stock market, boosting Microsoft's stock price as investors saw the company as a pane-ful opportunity.

What else correlates?
Annual US household spending on home maintenance · all weird & wacky
Microsoft's stock price (MSFT) · all stocks
Annual US household spending on home maintenance · all weird & wacky
Microsoft's stock price (MSFT) · all stocks


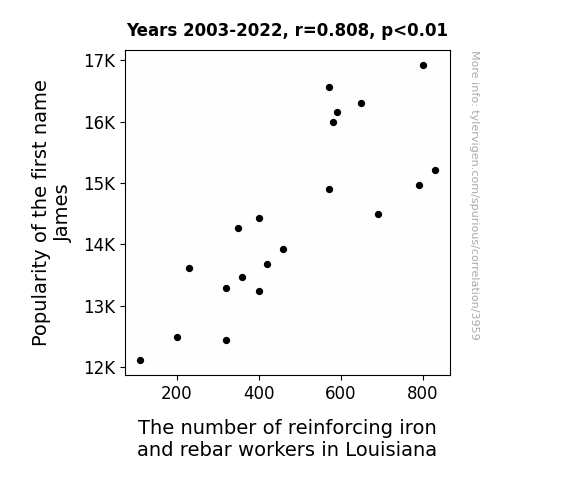
View details about correlation #3,959
Jovial James: Juggling Jackhammers in Jambalaya State - A Merriment of Monikers and Manual Labor
As the popularity of the name James waned, so did the interest in 'jamming' things together, including iron and rebar. It seems the name held the 'key' to keeping the job market 'bonded' in Louisiana, but now it's a 'rebar-bell' situation for the workforce. Who knew a name could have such a 'reinforcing' effect on a whole industry?


View details about correlation #4,848
The Political Chill: Libertarian Votes in Kansas and Google Searches for the Ice Bath Thrill
As more Libertarians voted, there was a surge in demand for freedom, leading to a sudden chill in the political climate. This shift caused Kansans to search for ways to cool off, inadvertently boosting the interest in ice baths. One-liner: Looks like the political race wasn't the only thing heating up in Kansas!


What else correlates?
Votes for Libertarian Senators in Kansas · all elections
Google searches for 'ice bath' · all google searches
Votes for Libertarian Senators in Kansas · all elections
Google searches for 'ice bath' · all google searches


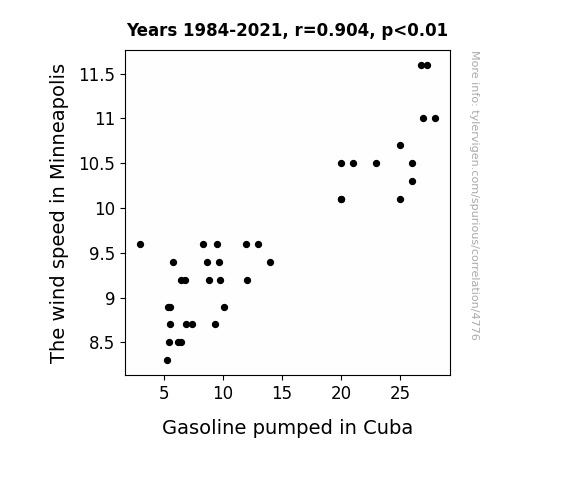
View details about correlation #4,776
A Cubic Link: Winds in Twin Cities and Gasoline in Cuba
The decrease in wind speed in Minneapolis led to a shortage of a key ingredient for creating wind power. This shortage caused a decrease in the production of electricity, which in turn affected the energy supply needed to refine gasoline. As a result, there was a decrease in the amount of gasoline pumped in Cuba. It seems like even the gentlest breeze in Minneapolis can have far-reaching effects on the other side of the world!

What else correlates?
The wind speed in Minneapolis · all weather
Gasoline pumped in Cuba · all energy
The wind speed in Minneapolis · all weather
Gasoline pumped in Cuba · all energy
. The chart goes from 2002 to 2022, and the two variables track closely in value over that time.")

View details about correlation #3,714
Meating Demands: The Correlation Between Household Spending on Animal Products and The Home Depot's Stock Price
As household spending on meats, poultry, fish, and eggs rose, more people were grilling and hosting backyard BBQs. This led to a spike in demand for home improvement products at The Home Depot, boosting their stock price. You could say it was a real "grill and drill" situation for the company!


View details about correlation #4,714
Counting on the Clickbait: The Correlation Between Professional-Sounding MrBeast YouTube Video Titles and Secretarial Employment in New Mexico
As the number of secretaries in New Mexico grows, there's a surge in efficient office work. This productivity boom somehow radiates through the universe, elevating the professionalism of MrBeast's video titles, one keystroke at a time. It's like a modern-day butterfly effect, but with typing pools and YouTube algorithms.


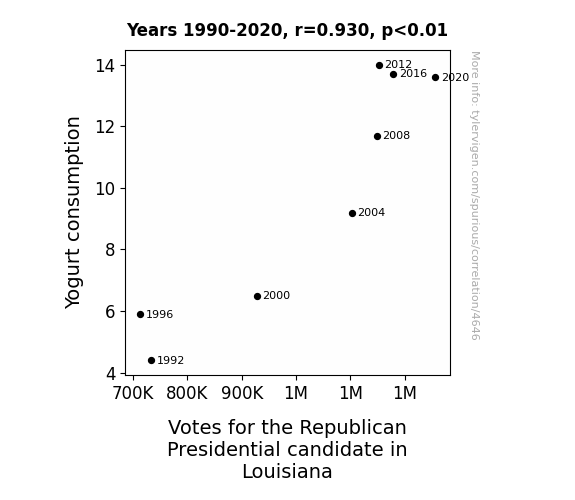
View details about correlation #4,646
Yogurtright: The Curious Case of Yogurt Consumption and Votes for the Republican Presidential Candidate in Louisiana
The live active cultures in yogurt inadvertently activated dormant conservative beliefs in individuals, leading to a surge in support for the Republican candidate. It seems like yogurt really does have a culture war going on!

What else correlates?
Yogurt consumption · all food
Votes for the Republican Presidential candidate in Louisiana · all elections
Yogurt consumption · all food
Votes for the Republican Presidential candidate in Louisiana · all elections


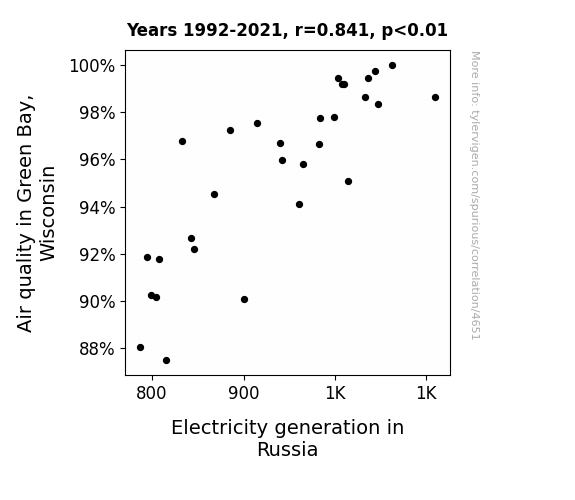
View details about correlation #4,651
Blowing Smoke: The Correlation Between Air Quality in Green Bay, Wisconsin and Electricity Generation in Russia
As the air quality in Green Bay improved, the cheeriness of the local population skyrocketed. This led to an increase in cheese production, creating a surplus of cheese in the area. The excess cheese was then exported to Russia, where it was used to host impromptu cheese-tasting parties. These fun, dairy-centric gatherings generated so much excitement that they inadvertently sparked a series of electrifying dance-offs. As the Russians boogied the nights away, their kinetic energy was harnessed and converted into electricity, ultimately boosting electricity generation in Russia. So, in a bizarre twist, Green Bay's cleaner air indirectly contributed to a gouda time in Russia, proving that when it comes to power, the curd definitely rises to the top!
What else correlates?
Air quality in Green Bay, Wisconsin · all weather
Electricity generation in Russia · all energy
Air quality in Green Bay, Wisconsin · all weather
Electricity generation in Russia · all energy
. The chart goes from 2002 to 2022, and the two variables track closely in value over that time.")

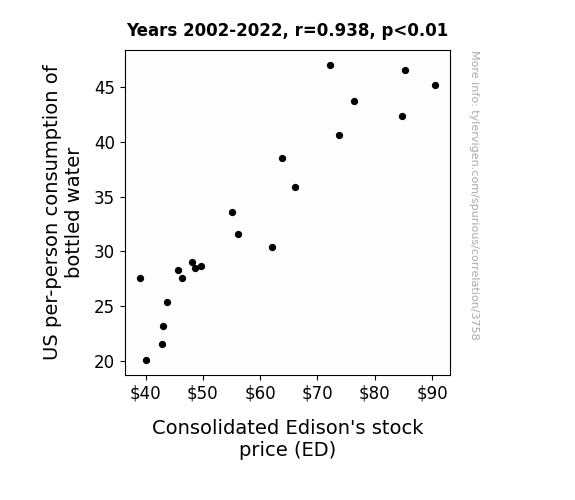
View details about correlation #3,758
The Thirst for Knowledge: An Exploration of the Bottled Water Consumption-Consolidated Edison Stock Price Connection
As people drank more bottled water, they stayed more hydrated. This led to increased brain function and decision-making skills. With the population making smarter choices, there was a surge in demand for electricity, ultimately boosting Consolidated Edison's stock price. "Who knew that the key to a shocking stock boost was just a bottle of water away!"

What else correlates?
US per-person consumption of bottled water · all weird & wacky
Consolidated Edison's stock price (ED) · all stocks
US per-person consumption of bottled water · all weird & wacky
Consolidated Edison's stock price (ED) · all stocks


View details about correlation #4,899
The Tenuous Tie Between the Tinkerers and Titillating Techies
There must be a connection between spark plug expertise and sparking interest in Simone's content! Perhaps the mechanics are revving up enthusiasm for her quirky DIY projects, or maybe they're just big fans of her electrifying personality! It's like they say, when it comes to spreading the love for Simone's videos, these mechanics are really gearing up for success!


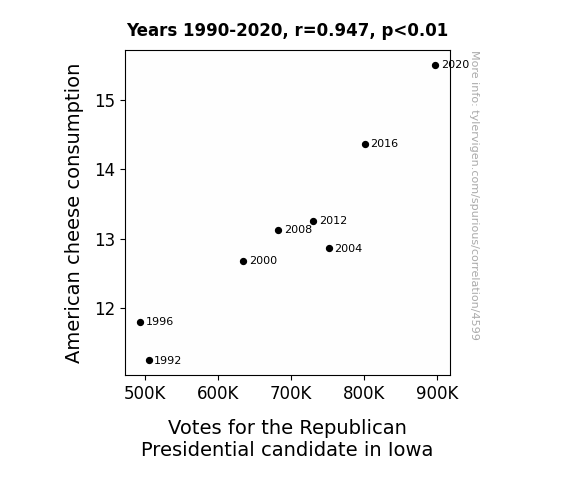
View details about correlation #4,599
Grate Expectations: The Curious Case of American Cheese Consumption and Republican Votes in Iowa
As American cheese consumption in Iowa increased, so did votes for the Republican Presidential candidate. This could be due to the fact that American cheese is a classic, comforting dairy product, much like the traditional values often associated with the Republican party. Furthermore, the creamy, melty texture of American cheese may have subconsciously swayed individuals towards choosing a candidate who they perceived to be as smooth and consistent as the cheese itself. Lastly, the yellowish hue of American cheese could have inadvertently elicited thoughts of the party's iconic color, reinforcing voters' support. However, it's also possible that these correlations are purely coincidental, and there may be no direct causation between cheese consumption and political preferences.

What else correlates?
American cheese consumption · all food
Votes for the Republican Presidential candidate in Iowa · all elections
American cheese consumption · all food
Votes for the Republican Presidential candidate in Iowa · all elections


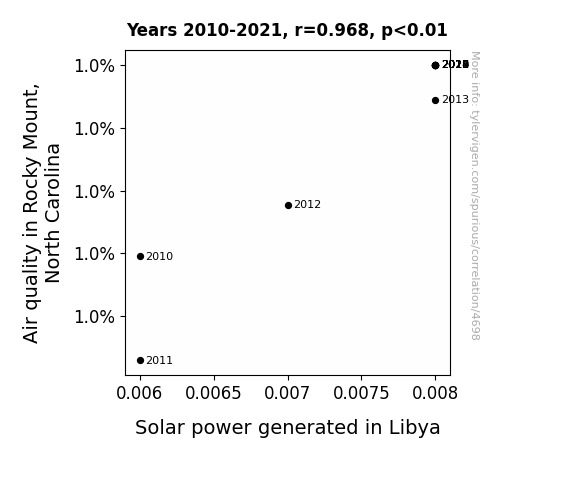
View details about correlation #4,698
Shedding Light on Pollution: Examining the Solar Connection Between Rocky Mount, NC and Libya
The cleaner air in Rocky Mount led to cheerier atmospheric conditions, promoting a sunnier outlook on solar power production in Libya. This in turn boosted the energy levels of the solar panels, prompting them to work more efficiently and effectively, creating a positive feedback loop of clean air and solar satisfaction. It's almost as if the two locations were part of a renewable energy comedy skit - a breath of fresh air for environmental correlations! All in all, it seems that when it comes to this connection, the Rocky Mount air quality really knows how to brighten the day for Libyan solar power.

What else correlates?
Air quality in Rocky Mount, North Carolina · all weather
Solar power generated in Libya · all energy
Air quality in Rocky Mount, North Carolina · all weather
Solar power generated in Libya · all energy
. The chart goes from 2002 to 2022, and the two variables track closely in value over that time.")

View details about correlation #4,152
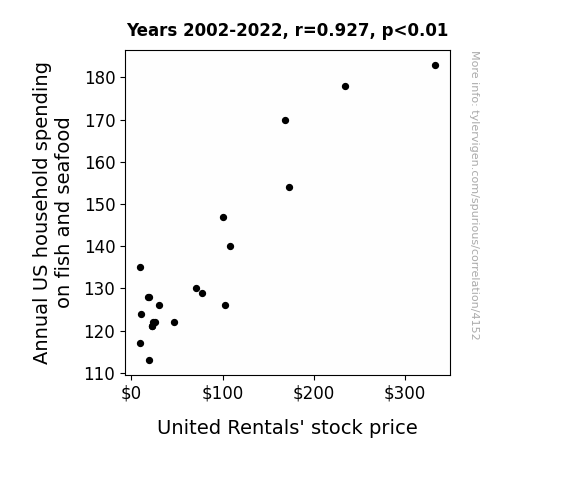
Fishing for Clues: A Study of the Correlation between US Household Spending on Fish and Seafood and United Rentals' Stock Price
As household spending on fish and seafood rose, more people started to feel a-boat the benefits of a balanced diet, leading to increased productivity. This, in turn, drove up the demand for construction equipment, including the one's provided by United Rentals, to scale up production.

What else correlates?
Annual US household spending on fish and seafood · all weird & wacky
United Rentals' stock price (URI) · all stocks
Annual US household spending on fish and seafood · all weird & wacky
United Rentals' stock price (URI) · all stocks
Why this works
- Data dredging: I have 25,237 variables in my database. I compare all these variables against each other to find ones that randomly match up. That's 636,906,169 correlation calculations! This is called “data dredging.”
Fun fact: the chart used on the wikipedia page to demonstrate data dredging is also from me. I've been being naughty with data since 2014.
Instead of starting with a hypothesis and testing it, I instead tossed a bunch of data in a blender to see what correlations would shake out. It’s a dangerous way to go about analysis, because any sufficiently large dataset will yield strong correlations completely at random. - Lack of causal connection: There is probably no direct connection between these variables, despite what the AI says above.
Because these pages are automatically generated, it's possible that the two variables you are viewing are in fact causually related. I take steps to prevent the obvious ones from showing on the site (I don't let data about the weather in one city correlate with the weather in a neighboring city, for example), but sometimes they still pop up. If they are related, cool! You found a loophole.
This is exacerbated by the fact that I used "Years" as the base variable. Lots of things happen in a year that are not related to each other! Most studies would use something like "one person" in stead of "one year" to be the "thing" studied. - Observations not independent: For many variables, sequential years are not independent of each other. You will often see trend-lines form. If a population of people is continuously doing something every day, there is no reason to think they would suddenly change how they are doing that thing on January 1. A naive p-value calculation does not take this into account.
You will calculate a lower chance of "randomly" achieving the result than represents reality.
To be more specific: p-value tests are probability values, where you are calculating the probability of achieving a result at least as extreme as you found completely by chance. When calculating a p-value, you need to assert how many "degrees of freedom" your variable has. I count each year (minus one) as a "degree of freedom," but this is misleading for continuous variables.
This kind of thing can creep up on you pretty easily when using p-values, which is why it's best to take it as "one of many" inputs that help you assess the results of your analysis.
- Y-axes doesn't start at zero: I truncated the Y-axes of the graphs above. I also used a line graph, which makes the visual connection stand out more than it deserves.
Nothing against line graphs. They are great at telling a story when you have linear data! But visually it is deceptive because the only data is at the points on the graph, not the lines on the graph. In between each point, the data could have been doing anything. Like going for a random walk by itself!
Mathematically what I showed is true, but it is intentionally misleading. If you click on any of the charts that abuse this, you can scroll down to see a version that starts at zero. - Confounding variable: Confounding variables (like global pandemics) will cause two variables to look connected when in fact a "sneaky third" variable is influencing both of them behind the scenes.
- Outliers: Some datasets here have outliers which drag up the correlation.
In concept, "outlier" just means "way different than the rest of your dataset." When calculating a correlation like this, they are particularly impactful because a single outlier can substantially increase your correlation.
Because this page is automatically generated, I don't know whether any of the charts displayed on it have outliers. I'm just a footnote. ¯\_(ツ)_/¯
I intentionally mishandeled outliers, which makes the correlation look extra strong. - Low n: There are not many data points included in some of these charts.
You can do analyses with low ns! But you shouldn't data dredge with a low n.
Even if the p-value is high, we should be suspicious of using so few datapoints in a correlation.
Pro-tip: click on any correlation to see:
- Detailed data sources
- Prompts for the AI-generated content
- Explanations of each of the calculations (correlation, p-value)
- Python code to calculate it yourself


