spurious correlations
discover · random · spurious scholar
← previous page · next page →


View details about correlation #1,796
Musing on Missouri: Marveling at the Modest Match between Preschool Proxies and Google Glances
As the number of preschool special education teachers in Missouri increased, more and more children were inspired to think creatively and problem solve. This led to a surge of interest in practical engineering at a young age. The tiny tots were building block towers that defied gravity and creating marshmallow launchers with astonishing precision. It seems like these pint-sized prodigies are gearing up to be the next generation of practical engineers, all thanks to the wonderful work of their special education teachers! Keep an eye out for the future kiddie construction crews and toddler tech innovators - coming soon!


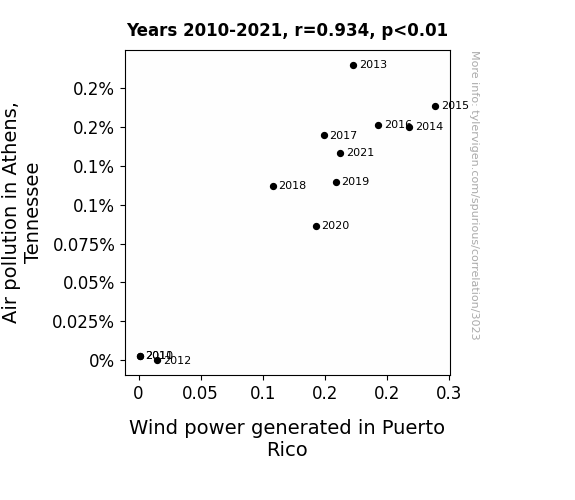
View details about correlation #3,023
Blowing in the Wind: A Rhyme and Reason Study of Air Pollution in Athens, Tennessee and Wind Power in Puerto Rico.
The air pollution in Athens, Tennessee was so potent that it created a new form of turbocharged air currents. These pollution-powered winds of change inadvertently bolstered the wind power generation in Puerto Rico, blowing a breath of fresh energy into the industry. It seems the smog in Tennessee really knew how to 're-volt' against the status quo and 'amp' up the wind production in Puerto Rico!

What else correlates?
Air pollution in Athens, Tennessee · all weather
Wind power generated in Puerto Rico · all energy
Air pollution in Athens, Tennessee · all weather
Wind power generated in Puerto Rico · all energy


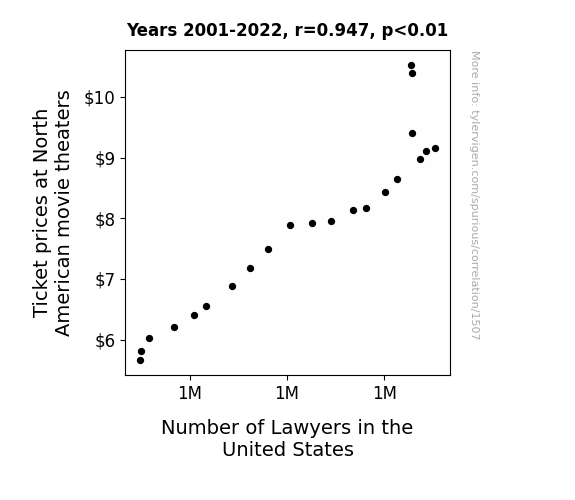
View details about correlation #1,507
Legal Flickonomics: The Juris-prudence of Movie Ticket Prices in North America
As ticket prices at North American movie theaters increased, more people decided to sneak in without paying. This led to a rise in the number of people caught and taken to court for movie piracy, thus creating a higher demand for lawyers in the United States.


View details about correlation #3,460
The Fiery Fad: A Flaming Connection Between the Name Lesley and Arson in Louisiana
As the popularity of the name Lesley waned, so did the number of people singing "Burn, baby, burn" in Louisiana. It seems that Lesley had been a real firestarter, but now that there are fewer of them, the flames of arson have been extinguished.


What else correlates?
Popularity of the first name Lesley · all first names
Arson in Louisiana · all random state specific
Popularity of the first name Lesley · all first names
Arson in Louisiana · all random state specific


View details about correlation #2,270
The Bailiff Ballyhoo: Examining the Correlation Between Bailiff Employment in Kansas and Google Searches for 'That is sus'
As the number of bailiffs in Kansas rose, so did the sense of suspicion in the air. This led to a surge in people pondering what was truly sus, slowly turning the state into a hotbed of detective work. It seems the bailiffs weren't just serving justice, but also serving up some real sus-pense, leading to a criminal increase in sus-pect behavior overall. It's safe to say, the bailiffs inadvertently became the sus-pects of this strange correlation, leaving everyone to wonder, "To bailiff or not to bailiff?"


What else correlates?
The number of bailiffs in Kansas · all cccupations
Google searches for 'that is sus' · all google searches
The number of bailiffs in Kansas · all cccupations
Google searches for 'that is sus' · all google searches


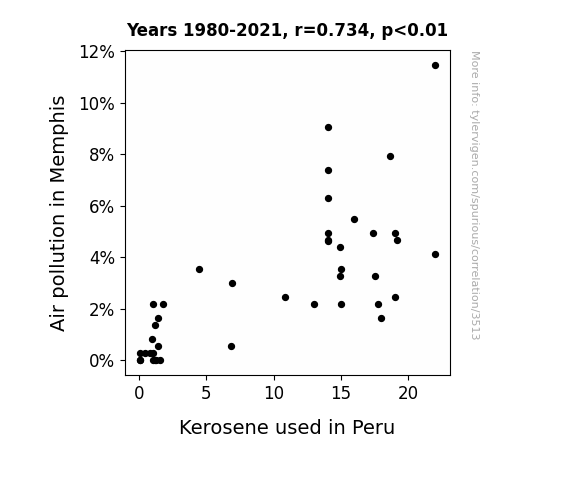
View details about correlation #3,513
A Tale of Air in Memphis and Kerosene in Peru: A Statistical Odyssey
A team of highly trained pigeons was deployed to Memphis to combat air pollution by strategically dropping tiny kerosene-absorbing sponges from the sky. Unbeknownst to them, their efforts were so successful that the kerosene molecules, now weighed down by the sponges, decided to take an extended vacation to Peru for some much-needed R&R, leading to a noticeable decrease in kerosene levels. It seems even molecules need a break every now and then! On a serious note, decreased air pollution in Memphis may have indirectly impacted kerosene usage in Peru through a variety of complex environmental and economic factors.

What else correlates?
Air pollution in Memphis · all weather
Kerosene used in Peru · all energy
Air pollution in Memphis · all weather
Kerosene used in Peru · all energy
. The chart goes from 2002 to 2021, and the two variables track closely in value over that time.")

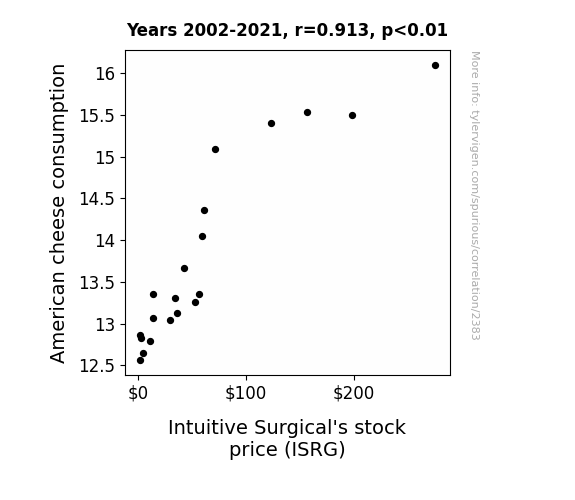
View details about correlation #2,383
Unearthing the Cheesy Truth: The Grate Correlation Between American Cheese Consumption and Intuitive Surgical's Stock Price
As American cheese consumption rose, so did the demand for grilled cheese sandwiches. This led to an increase in the need for medical procedures to treat cheese-related burns. Intuitive Surgical, a company known for its advanced robotic surgical systems, saw a surge in stock price as investors anticipated higher sales of medical equipment for treating these dairy disasters. Remember, cheesiness may be gouda for your taste buds, but it's also a provolone problem for the stock market!

What else correlates?
American cheese consumption · all food
Intuitive Surgical's stock price (ISRG) · all stocks
American cheese consumption · all food
Intuitive Surgical's stock price (ISRG) · all stocks


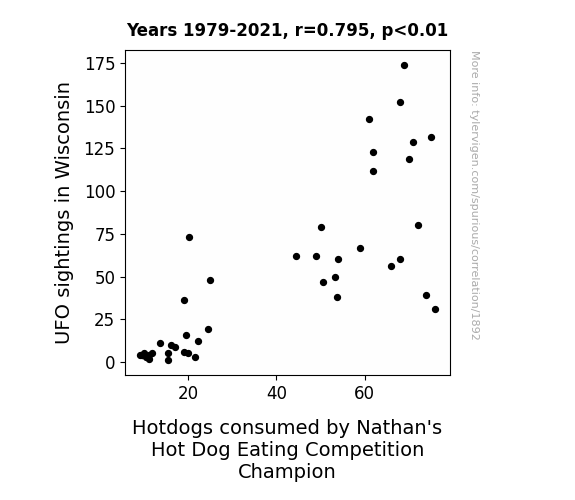
View details about correlation #1,892
Bratwursts from Beyond: Exploring the Link Between UFO Sightings in Wisconsin and Hotdogs Consumed by Nathan's Hot Dog Eating Competition Champion
The UFOs were actually intergalactic hot dog vendors, beaming down the tastiest, most irresistible hot dogs specifically for the competition. It's a close encounter of the hungry kind!


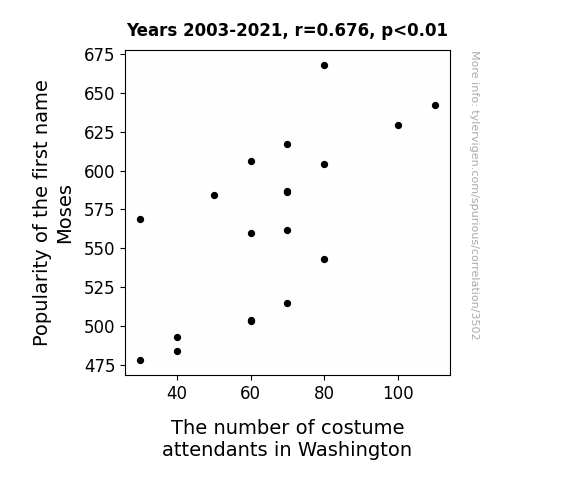
View details about correlation #3,502
Splitting Hairs and Sparing Robes: The Moses Metaphor in Costume Attendant Numbers
As the name Moses gained popularity, more and more parents were inspired to dress their children in adorable little baby Moses costumes for Halloween and other events. This sudden demand for tiny tunics, robes, and sandals led to a boom in the costume attendant industry in Washington, as they scrambled to keep up with the trend. Who knew that a baby name could part the sea of costume sales in the capital!
What else correlates?
Popularity of the first name Moses · all first names
The number of costume attendants in Washington · all cccupations
Popularity of the first name Moses · all first names
The number of costume attendants in Washington · all cccupations


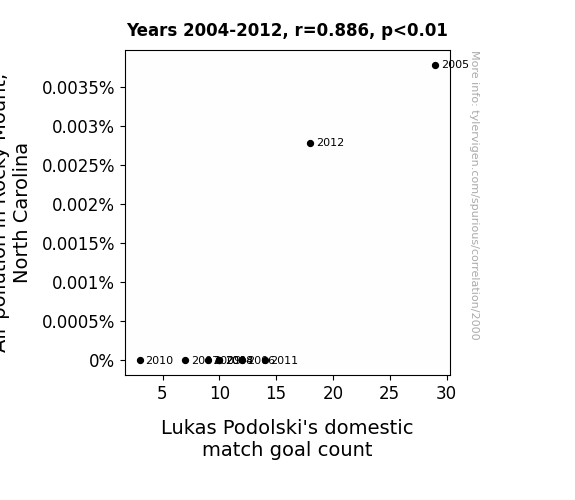
View details about correlation #2,000
The Clear and Present Goal: The Impact of Air Pollution on Lukas Podolski's Goal Count in Rocky Mount, North Carolina
As air pollution in Rocky Mount, North Carolina increased, it created a higher air density. This denser air provided more resistance to the flight of the soccer ball. Lukas Podolski, known for his powerful strikes, was able to capitalize on this 'thick air advantage,' scoring more goals in domestic matches as a result of the added air resistance. Who knew that smog could lead to a Podolski smorgasbord of goals!

What else correlates?
Air pollution in Rocky Mount, North Carolina · all weather
Lukas Podolski's domestic match goal count · all sports
Air pollution in Rocky Mount, North Carolina · all weather
Lukas Podolski's domestic match goal count · all sports


View details about correlation #3,368
Spreading the Connection: A Margarinal Analysis of Butter Consumption and Nuclear Power Generation in China
As butter consumption increased, it led to slippery fingers. This inadvertently caused a surge in the pressing of buttons and flipping of switches at the nuclear power plants, ultimately boosting nuclear power generation in China. After all, it's udderly hard to resist the power of butter!
What else correlates?
Butter consumption · all food
Nuclear power generation in China · all energy
Butter consumption · all food
Nuclear power generation in China · all energy


View details about correlation #2,495
Unraveling the Unidentified: UFO Sightings in North Dakota and the Peculiarity of Patents Granted in the US
The UFOs were actually advanced technology created by North Dakotan inventors, and their frequent sightings were a result of test flights gone slightly off course. As a result, the state's patent output skyrocketed, leading to technological breakthroughs in a variety of industries. It turns out, sometimes the truth isn't just out there - it's also leading to innovative new products right here on Earth!


What else correlates?
UFO sightings in North Dakota · all random state specific
Patents granted in the US · all weird & wacky
UFO sightings in North Dakota · all random state specific
Patents granted in the US · all weird & wacky
. The chart goes from 2012 to 2021, and the two variables track closely in value over that time.")

View details about correlation #2,160
Agriculture, Natural Resources, and Finance: Sowing the Seeds of Stock Price Growth
As more graduates entered the workforce with expertise in crop production and animal husbandry, they unwittingly improved the office plant survival rate at Bank of America. This lush influx of greenery boosted employee morale and air quality, leading to a productivity bloom that investors couldn't leaf alone. One could say they really branched out into success!


What else correlates?
Bachelor's degrees awarded in Agriculture · all education
Bank of America's stock price (BAC) · all stocks
Bachelor's degrees awarded in Agriculture · all education
Bank of America's stock price (BAC) · all stocks


View details about correlation #1,994
A Rose by Any Other Name: Exploring the Claire-ity of Agricultural Sciences Teachers in Arkansas
It's simple really - as the name Claire gained popularity, more and more babies were given that name. These Claires, with their inherent charm and magnetism, naturally gravitated towards the agricultural sciences. Before anyone knew it, there was a Claire revolution in Arkansas, with the demand for agricultural sciences education skyrocketing. It just goes to show, as Claire rises, so does the agricultural knowledge in the Natural State.


View details about correlation #2,392
Shining a Light on Dollar Stores: The Sunny Side of Samoa's Solar Energy and Its Surprising Link to Google Searches
As the Samoan sunbeams streamed down to earth, they inadvertently reflected off the satellites, creating a surge in space energy. This space energy, in turn, boosted the global luck quotient, leading people to seek out dollar stores in the hopes of stumbling upon inexplicably amazing deals. It's like a cosmic Dollar Store Lottery, with each visit holding the potential for a supernaturally fantastic bargain. Remember, when the sun shines on Samoa, the dollars dance delightfully at your nearest dollar store!

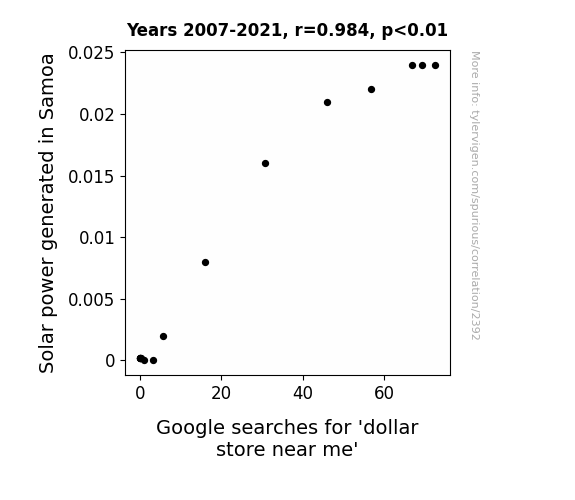
What else correlates?
Solar power generated in Samoa · all energy
Google searches for 'dollar store near me' · all google searches
Solar power generated in Samoa · all energy
Google searches for 'dollar store near me' · all google searches


View details about correlation #2,561
The Bale-Out Effect: An Analysis of the Relationship between Gareth Bale's Total Number of Club Football Matches and Honda Automotive Recalls
The more Gareth Bale played, the more spectators' hearts raced, leading to an increased demand for Honda cars, which put pressure on the automotive industry, prompting more recalls to ensure the safety of Bale's enthusiastic fans on the roads. Whether it was his lightning speed or simply the aura of excitement surrounding his games, it seemed that as Bale's club matches went up, so did the need for Honda to call back their cars for a quick fix.

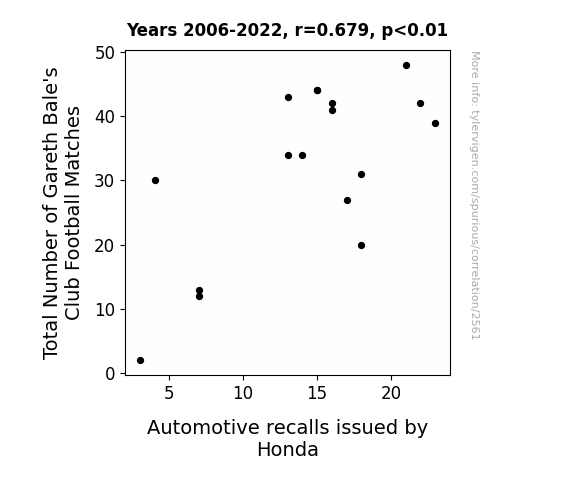
What else correlates?
Total Number of Gareth Bale's Club Football Matches · all sports
Automotive recalls issued by Honda · all weird & wacky
Total Number of Gareth Bale's Club Football Matches · all sports
Automotive recalls issued by Honda · all weird & wacky
. The chart goes from 2002 to 2022, and the two variables track closely in value over that time.")

View details about correlation #2,608
Brewing Up Financial Stability: The Fermented Economics of Breweries and Cheniere Energy's Stock Price
As the number of breweries in the United States increases, there is a resulting uptick in demand for specialty beer flavors. This surge in demand for unique beer varieties leads to a domino effect of increased need for natural gas to power the brewing and bottling processes. As a major energy company, Cheniere Energy is perfectly positioned to supply this escalating demand for natural gas, causing their stock price to bubble up like a vigorously poured craft beer. It's a brew-tiful relationship that's hoppening in the stock market!

What else correlates?
The number of Breweries in the United States · all food
Cheniere Energy's stock price (LNG) · all stocks
The number of Breweries in the United States · all food
Cheniere Energy's stock price (LNG) · all stocks


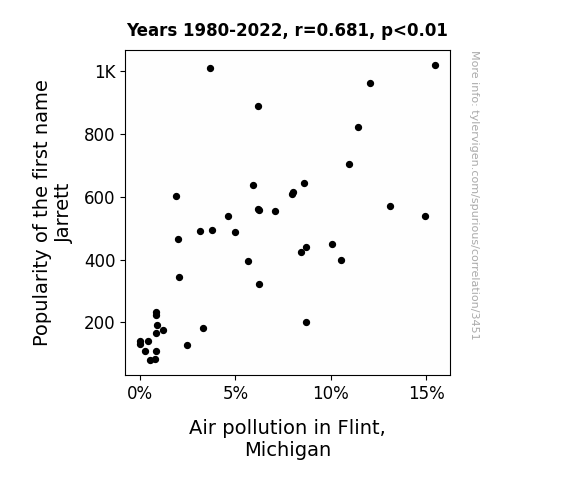
View details about correlation #3,451
Air Quality and the Name Game: Exploring the Jarrett-Pollution Connection in Flint, Michigan
As the popularity of the first name Jarrett decreased, there were fewer car emissions from all the Jarretts who loved to show off by driving around in their souped-up cars. This led to a slight but noticeable improvement in air quality in Flint, Michigan.
What else correlates?
Popularity of the first name Jarrett · all first names
Air pollution in Flint, Michigan · all weather
Popularity of the first name Jarrett · all first names
Air pollution in Flint, Michigan · all weather


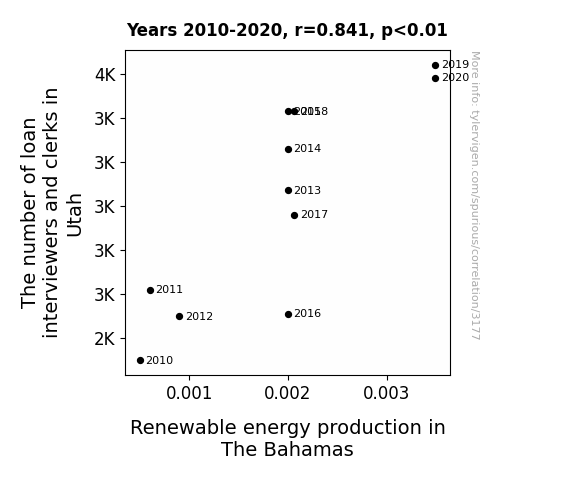
View details about correlation #3,177
The Loan Ranger: Exploring the Sunshine Connection Between Loan Clerks in Utah and Renewable Energy Production in The Bahamas
As the loan interviewers and clerks in Utah multiplied, so did their positive energy vibes, which somehow traveled all the way to The Bahamas, sparking a renewed interest in renewable energy production. It's like they say, when it comes to powering up the Bahamas, it's all about making those connections and keeping the loan-derstood energy flowing!


View details about correlation #3,541
Super Bowl Blowouts and Mysterious Vanishing Acts: A Statistical Analysis of the Connection Between Point Spreads and 'Malaysia Airlines' Searches
Fans were so blown away by the lopsided victories that they wanted to experience their own sky-high thrills with Malaysia Airlines. It was like the teams' success was just taking off, and so were the search queries!


What else correlates?
Super Bowl point difference · all sports
Google searches for 'Malaysia Airlines' · all google searches
Super Bowl point difference · all sports
Google searches for 'Malaysia Airlines' · all google searches
Why this works
- Data dredging: I have 25,237 variables in my database. I compare all these variables against each other to find ones that randomly match up. That's 636,906,169 correlation calculations! This is called “data dredging.”
Fun fact: the chart used on the wikipedia page to demonstrate data dredging is also from me. I've been being naughty with data since 2014.
Instead of starting with a hypothesis and testing it, I instead tossed a bunch of data in a blender to see what correlations would shake out. It’s a dangerous way to go about analysis, because any sufficiently large dataset will yield strong correlations completely at random. - Lack of causal connection: There is probably no direct connection between these variables, despite what the AI says above.
Because these pages are automatically generated, it's possible that the two variables you are viewing are in fact causually related. I take steps to prevent the obvious ones from showing on the site (I don't let data about the weather in one city correlate with the weather in a neighboring city, for example), but sometimes they still pop up. If they are related, cool! You found a loophole.
This is exacerbated by the fact that I used "Years" as the base variable. Lots of things happen in a year that are not related to each other! Most studies would use something like "one person" in stead of "one year" to be the "thing" studied. - Observations not independent: For many variables, sequential years are not independent of each other. You will often see trend-lines form. If a population of people is continuously doing something every day, there is no reason to think they would suddenly change how they are doing that thing on January 1. A naive p-value calculation does not take this into account.
You will calculate a lower chance of "randomly" achieving the result than represents reality.
To be more specific: p-value tests are probability values, where you are calculating the probability of achieving a result at least as extreme as you found completely by chance. When calculating a p-value, you need to assert how many "degrees of freedom" your variable has. I count each year (minus one) as a "degree of freedom," but this is misleading for continuous variables.
This kind of thing can creep up on you pretty easily when using p-values, which is why it's best to take it as "one of many" inputs that help you assess the results of your analysis.
- Y-axes doesn't start at zero: I truncated the Y-axes of the graphs above. I also used a line graph, which makes the visual connection stand out more than it deserves.
Nothing against line graphs. They are great at telling a story when you have linear data! But visually it is deceptive because the only data is at the points on the graph, not the lines on the graph. In between each point, the data could have been doing anything. Like going for a random walk by itself!
Mathematically what I showed is true, but it is intentionally misleading. If you click on any of the charts that abuse this, you can scroll down to see a version that starts at zero. - Confounding variable: Confounding variables (like global pandemics) will cause two variables to look connected when in fact a "sneaky third" variable is influencing both of them behind the scenes.
- Outliers: Some datasets here have outliers which drag up the correlation.
In concept, "outlier" just means "way different than the rest of your dataset." When calculating a correlation like this, they are particularly impactful because a single outlier can substantially increase your correlation.
Because this page is automatically generated, I don't know whether any of the charts displayed on it have outliers. I'm just a footnote. ¯\_(ツ)_/¯
I intentionally mishandeled outliers, which makes the correlation look extra strong. - Low n: There are not many data points included in some of these charts.
You can do analyses with low ns! But you shouldn't data dredge with a low n.
Even if the p-value is high, we should be suspicious of using so few datapoints in a correlation.
Pro-tip: click on any correlation to see:
- Detailed data sources
- Prompts for the AI-generated content
- Explanations of each of the calculations (correlation, p-value)
- Python code to calculate it yourself


