spurious correlations
discover · random · spurious scholar
← previous page · next page →


View details about correlation #3,926
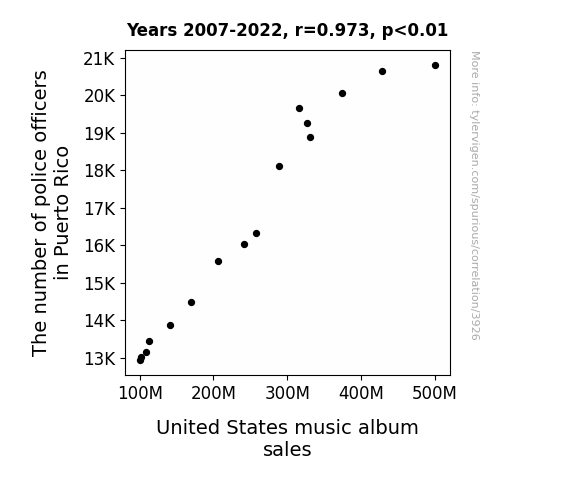
To Protect and Perform: The Beat Between Police Count and Album Amount
As police officers in Puerto Rico decreased, they started focusing on forming a reggaeton band instead of carrying out their regular duties. This new band, 'The Lawless Beats,' became so popular that they monopolized the music charts, leading to a nationwide obsession with Puerto Rican police music. As a result, US music album sales plummeted as everyone grooved to the unexpected musical stylings of the enforcers of the law.

What else correlates?
The number of police officers in Puerto Rico · all cccupations
United States music album sales · all weird & wacky
The number of police officers in Puerto Rico · all cccupations
United States music album sales · all weird & wacky


View details about correlation #5,664
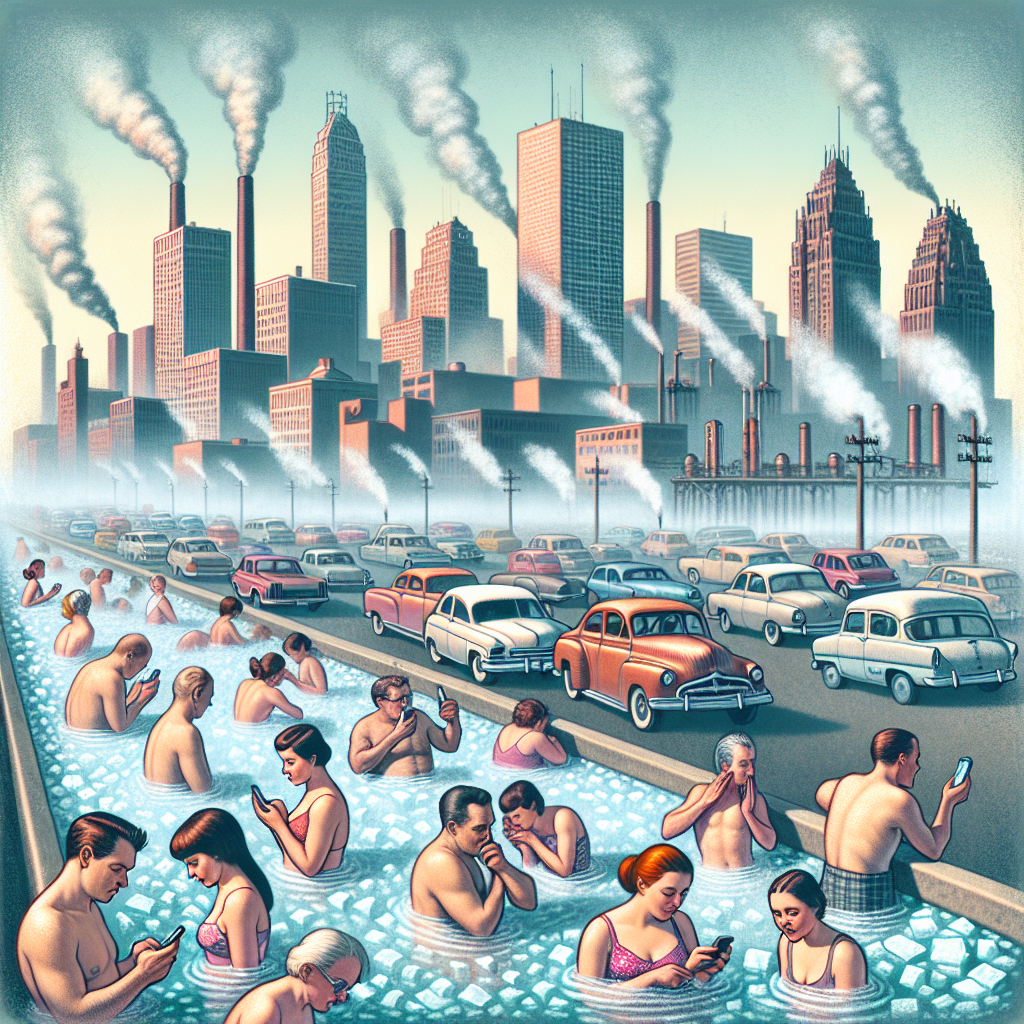
Chilling Connections: Unveiling the Relationship Between Air Pollution in Rockford, Illinois and the Piquant Pursuit of Ice Baths
Breathing in the dirty air prompted residents to seek out a refreshing ice bath experience for some much-needed relief from the environmental ills. Remember, when the going gets tough, the tough take icy baths!

What else correlates?
Air pollution in Rockford, Illinois · all weather
Google searches for 'ice bath' · all google searches
Air pollution in Rockford, Illinois · all weather
Google searches for 'ice bath' · all google searches


View details about correlation #5,540
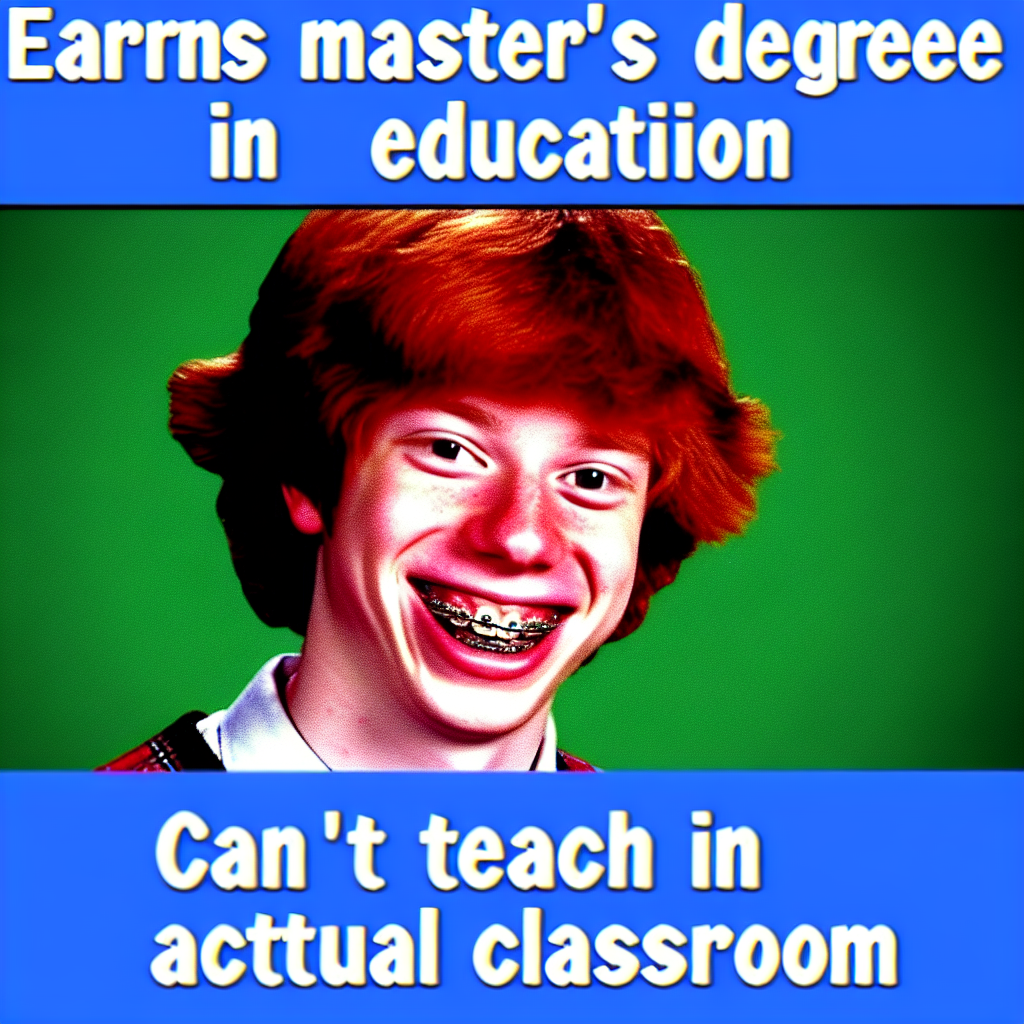
The Master's Meme: Exploring the Connection Between Education Degrees and 'Bad Luck Brian' Popularity
As the number of Master's degrees awarded in Education dropped, there were fewer teachers to appreciate the meme during school hours, leading to a decrease in its overall popularity. It seems Bad Luck Brian's luck ran out with the education system! Remember, a lack of masters means a master of bad luck!

What else correlates?
Master's degrees awarded in Education · all education
Popularity of the 'bad luck brian' meme · all memes
Master's degrees awarded in Education · all education
Popularity of the 'bad luck brian' meme · all memes


View details about correlation #4,477
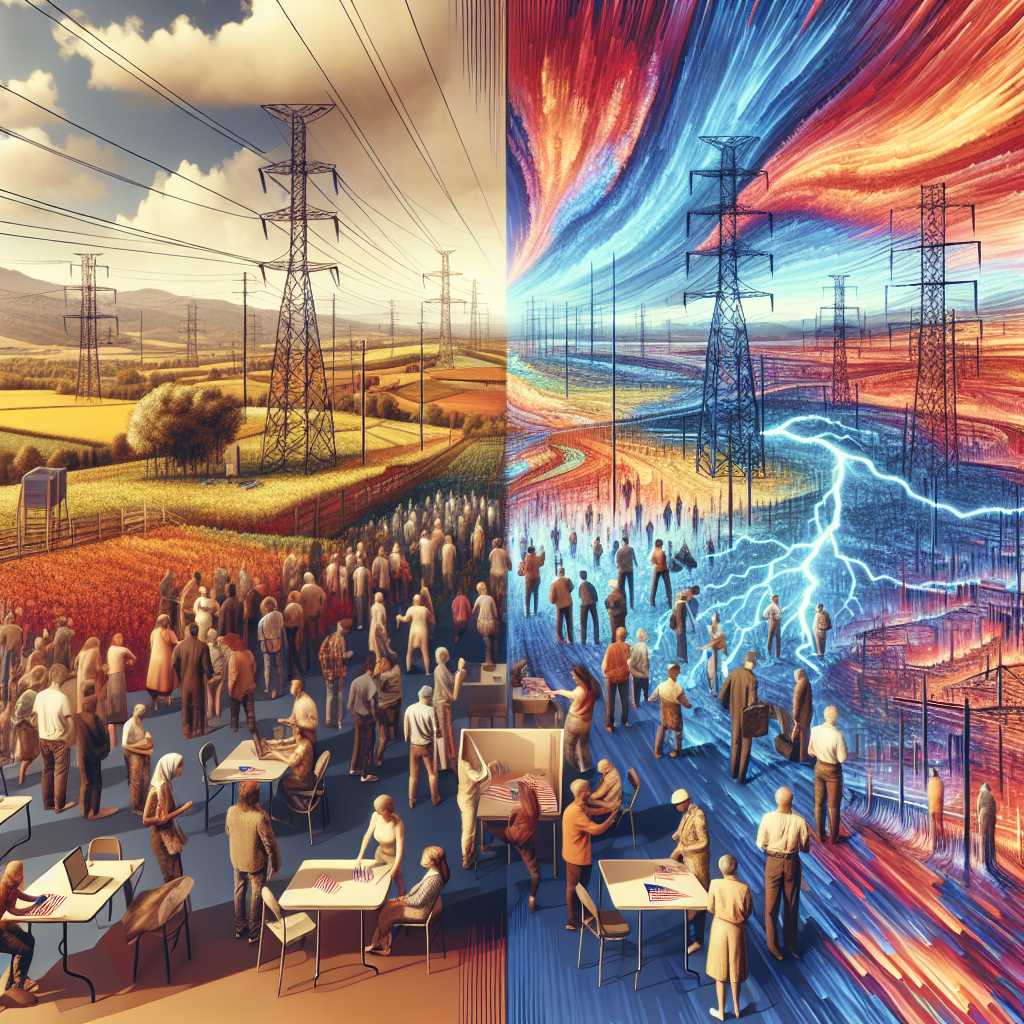
Wacky West Virginia Votes and Bosnian Electricity: A Bizarre Back-and-Forth
It turns out that with every "Watt" of support gained, there was a shocking surge in energy across the globe. It's like their political power sparked a chain reaction, leading to a truly electrifying outcome. Who would have thought that the key to boosting power production in Bosnia and Herzegovina lay in the American electoral currents? It's a realpolitik twist that no one saw coming, and it goes to show that in the game of global energy, every vote really does count!


View details about correlation #4,182
A Novel Connection: Exploring the Link Between Medical Equipment Repairers in Maine and New York Times Fiction Best Sellers
As the demand for medical equipment repairers grew in Maine, so did the need for technical manuals and instructional guides. This spike in the production of written material inadvertently provided New York Times fiction best sellers with new inspiration for riveting plots and captivating storytelling. After all, who wouldn't want to read a novel about the thrilling adventures of a daring medical equipment repairer in the picturesque backdrop of the Maine countryside? It's like the heartbeat of the repairers synced up with the pulse of the literary world, sparking a novel connection between stethoscopes and stories!


View details about correlation #5,091
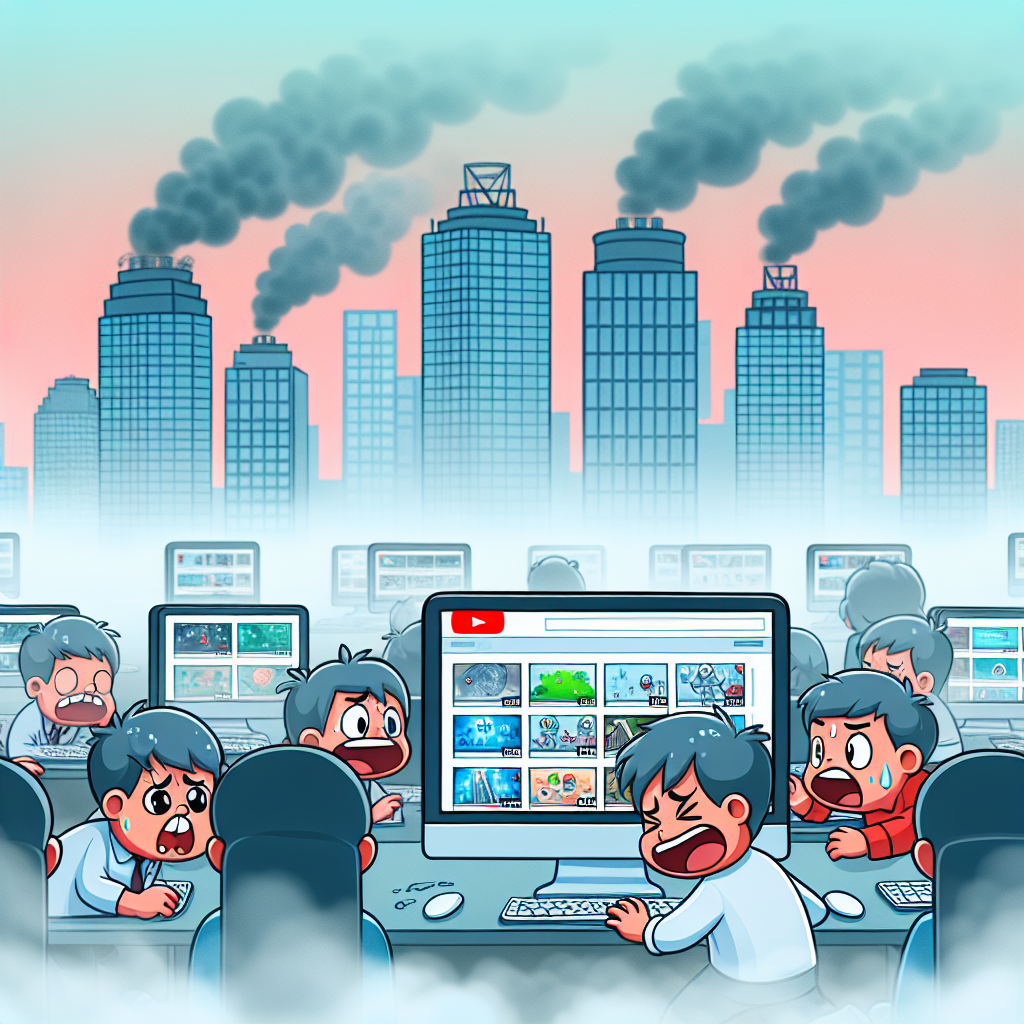
Perplexing Pluto Predicament: Probing the Peculiar Paradox of Numberphile's YouTube Titles and Public Perception
As more people question the status of Pluto, the gravitational pull of uncertainty causes Numberphile to orbit the topic, creating a celestial alignment of trendy videos. As the debate heats up, Numberphile simply can't resist the gravitational charm, leading to an out-of-this-world surge in 'hip and with it' video titles. It's like Pluto is the cool kid at the planetary party, and Numberphile just can't help but be drawn to its dwarf star power. So, the more the internet wonders about Pluto, the more Numberphile's content gets an astronomical boost, rocketing them to new levels of cosmic coolness. Watch out, because this trend is truly universal!

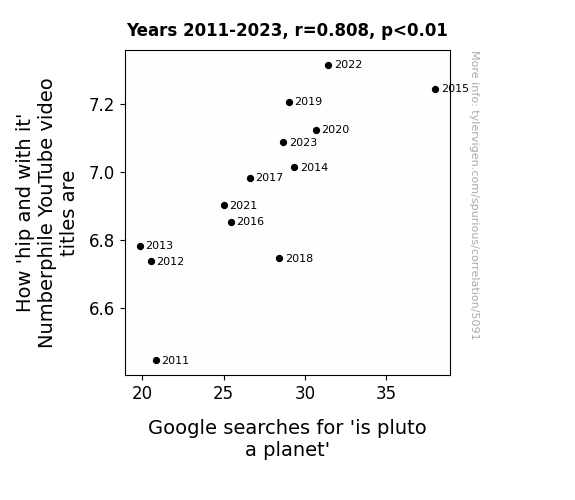
. The chart goes from 2011 to 2023, and the two variables track closely in value over that time.")

View details about correlation #5,160
Charged Up: Rickrolling Stock Prices - A Never Gonna Give You Up Meme and Tesla's Stock Price Correlation Analysis
As the 'never gonna give you up' meme gained traction, it sparked a wave of involuntary toe-tapping and head-bobbing worldwide. This, in turn, led to a surge in renewable energy as people's kinetic energy was harnessed, effectively powering up Tesla vehicles and charging stations. It's a shocking development in the world of finance, but it seems like Tesla's stocks are Rickrolling to the top!


What else correlates?
Searches for 'never gonna give you up' · all memes
Tesla's stock price (TSLA) · all stocks
Searches for 'never gonna give you up' · all memes
Tesla's stock price (TSLA) · all stocks


View details about correlation #3,905
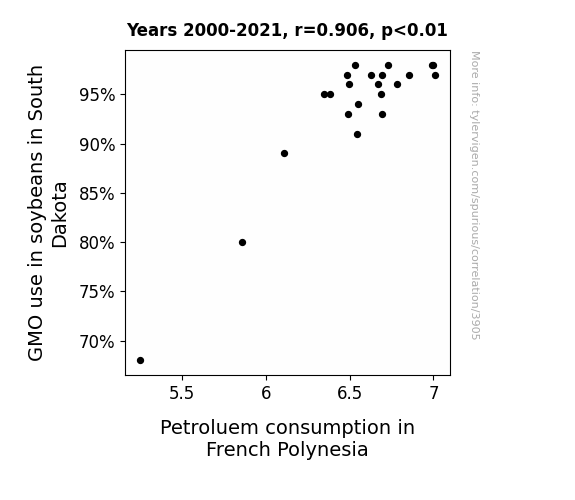
Soy Petroleum Connection: Unveiling the Relationship Between Soybean GMO Use in South Dakota and Petroleum Consumption in French Polynesia
As GMO soybeans in South Dakota flourished, they emitted a faint yet distinct signal that only French Polynesian petroleum molecules could detect. This led to a sudden and inexplicable attraction, causing a spike in petroleum consumption as the two seemingly unrelated entities formed an unexpected bond. It's like a secret, plant-based love story with a twist of fossil fuels in the picturesque landscapes of South Dakota and French Polynesia! Who would have thought that soybeans and petroleum were the newest star-crossed lovers in the global market?

What else correlates?
GMO use in soybeans in South Dakota · all food
Petroluem consumption in French Polynesia · all energy
GMO use in soybeans in South Dakota · all food
Petroluem consumption in French Polynesia · all energy


View details about correlation #4,743
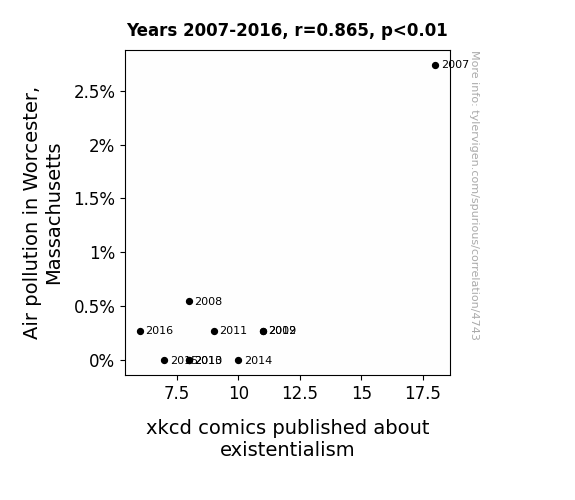
The Correlation Between Air Pollution Aggravation in Worcester, Massachusetts and xkcd Comics' Rumination on Existentialism
As the air quality improved, the local pigeons in Worcester found themselves with a renewed zest for life. However, this newfound joie de vivre led them to ponder the futility of their existence - ultimately inspiring the xkcd creator to explore more uplifting and non-existential topics. This in turn led to a decrease in the publication of xkcd comics about existentialism. So, in a way, you could say that cleaner air in Worcester literally gave the pigeons something else to think about, leading to a shift in comic content. After all, when the pigeons' outlook on life changed, so did the creator's inspiration for the comics.

What else correlates?
Air pollution in Worcester, Massachusetts · all weather
xkcd comics published about existentialism · all weird & wacky
Air pollution in Worcester, Massachusetts · all weather
xkcd comics published about existentialism · all weird & wacky


View details about correlation #5,225
Shuttering Stereotypes: Understanding the Relationship Between MrBeast YouTube Video Titles and the Snapshot of Photographers in West Virginia
As the number of photographers in West Virginia decreases, MrBeast's access to professional lighting and epic camera angles is limited. Without their magical geekifying touch, his video titles have lost their nerdy allure. It's a dark day for geeks everywhere!

What else correlates?
How geeky MrBeast's YouTube video titles are · all YouTube
The number of photographers in West Virginia · all cccupations
How geeky MrBeast's YouTube video titles are · all YouTube
The number of photographers in West Virginia · all cccupations


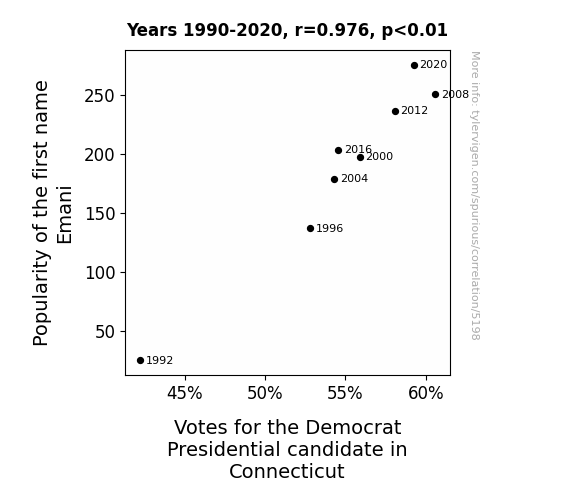
View details about correlation #5,198
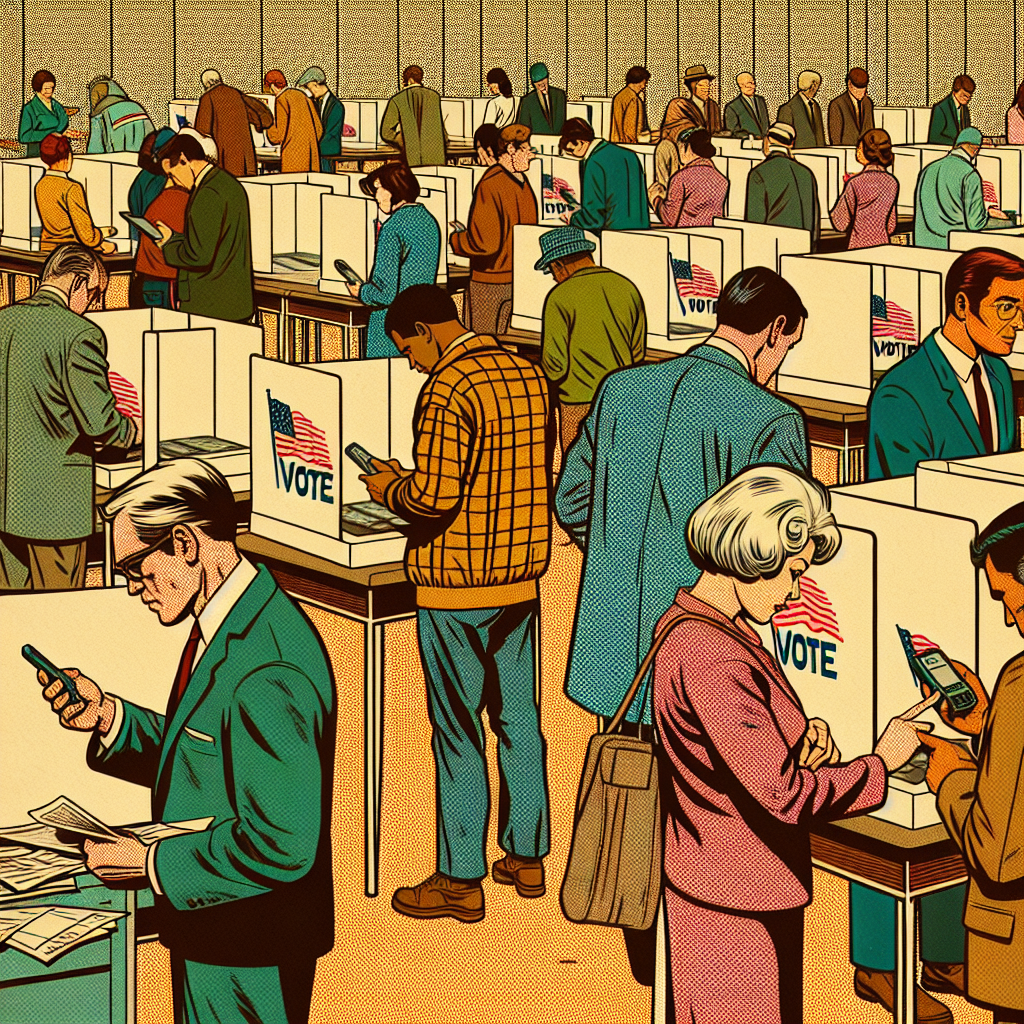
Emani's Popularity and Voting Majority: A Rhyming Analysis of Democrat Support in Connecticut
It turns out that the name Emani has a subliminal effect on people, making them more inclined to support democratic values and candidates. It's like a magical incantation for liberal leanings. As the number of Emojis in the state rose, so did the support for the Democratic Presidential candidate, creating a Emani-cipated blue wave.


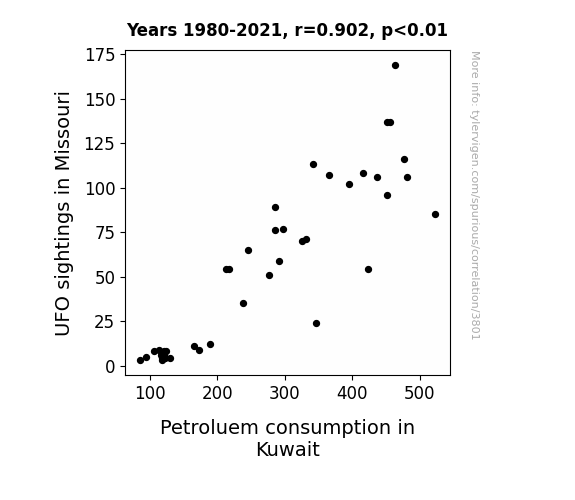
View details about correlation #3,801
Out of this World Correlations: Unveiling the Interstellar Connection Between UFO Sightings in Missouri and Petroleum Consumption in Kuwait
Perhaps the UFOs were really just giant, energy-hungry space snails on a secret mission to fuel up on Earth's oil reserves and Missouri was their intergalactic pit stop, leading to an inadvertent spike in petroleum consumption in Kuwait as they zoomed off back into the cosmos. After all, you can't expect extraterrestrial visitors to carpool, can you?
What else correlates?
UFO sightings in Missouri · all random state specific
Petroluem consumption in Kuwait · all energy
UFO sightings in Missouri · all random state specific
Petroluem consumption in Kuwait · all energy
. The chart goes from 2002 to 2022, and the two variables track closely in value over that time.")

View details about correlation #3,970
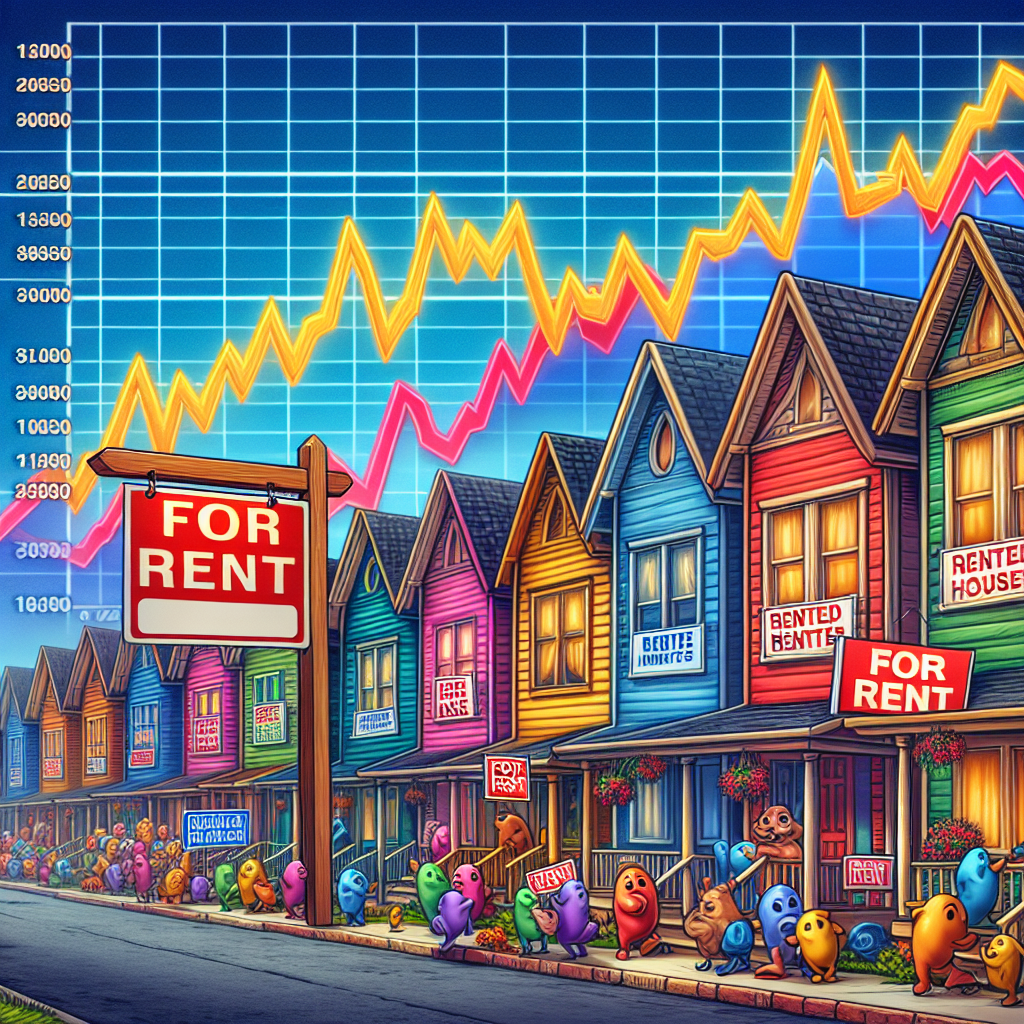
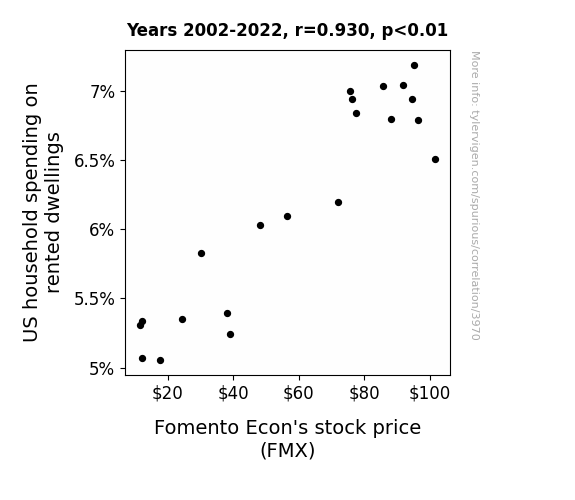
A Rhyme in Time: US Household Dime and Fomento Econ's Climb
As US household spending on rented dwellings increased, more people were able to afford extravagant quinceañera parties. This led to a surge in demand for Fomento Econ's beverages and boosted their overall sales, thereby driving up their stock price.
What else correlates?
US household spending on rented dwellings · all weird & wacky
Fomento Econ's stock price (FMX) · all stocks
US household spending on rented dwellings · all weird & wacky
Fomento Econ's stock price (FMX) · all stocks


View details about correlation #5,390
Air Affair: The Effect of Buffalo's Air Quality on the Witty Quotient of Be-Smart YouTube Video Titles
As the smog rolled in, the brainpower rolled out, leading to a surge in not-so-clever video titles. It's a case of hazy air leading to hazy creativity, creating a perfect storm of uninspired content. It's like the air pollution clouded not just the skies, but also the judgment of YouTubers everywhere. The struggle for clean air in Buffalo just got real - for the sake of catchy video titles, they might need to clear the air, literally!

What else correlates?
Air quality in Buffalo · all weather
How professional-sounding 'Be Smart' science YouTube video titles are · all YouTube
Air quality in Buffalo · all weather
How professional-sounding 'Be Smart' science YouTube video titles are · all YouTube


View details about correlation #4,934
The Mystery of Voting Behavior: Are North Dakota Republicans Searching for 'Scooby Doo, Where Are You'?
As North Dakotans found themselves enraptured by political rhetoric, they couldn't help but relate to the mystery-solving antics of Scooby and the gang. The thought of unmasking elusive villains resonated deeply with their recent electoral pursuits, leading to a surge in nostalgic searches for the animated sleuth. It seems like in the land of hotly contested races, everyone was just trying to uncover who was really behind all the political shenanigans, and they turned to Scooby Doo for some much-needed lighthearted escapades. It was a time of 'zoinks' and 'jinkies' mixed with a dash of 'red or blue, we've got a mystery to solve, Scooby-Doo!'


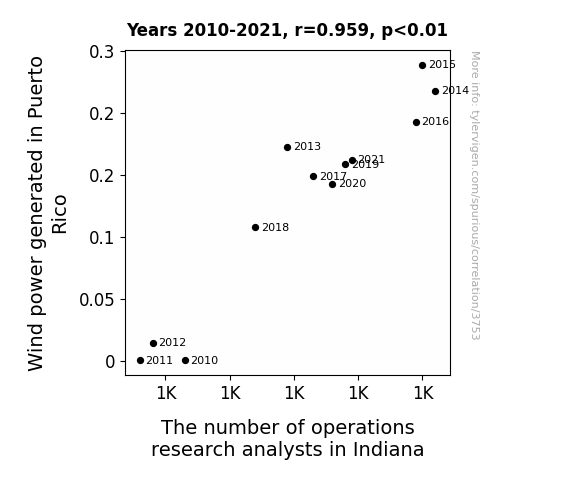
View details about correlation #3,753
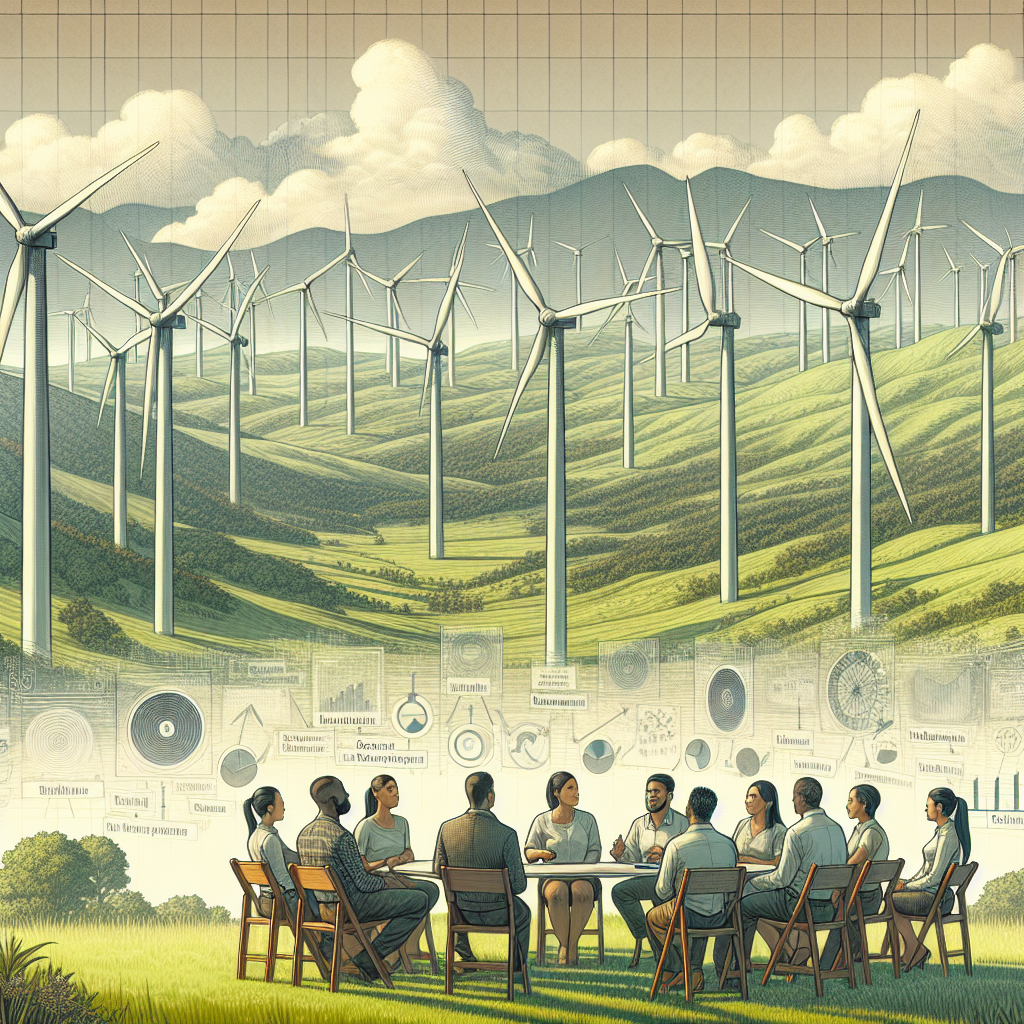
Blown Away: Uncovering the Winds of Change in the Relationship Between Wind Power in Puerto Rico and Operations Research Analysts in Indiana
The increase in Wind power in Puerto Rico has been generating a lot of energy buzz. This has led to a surge in productivity and efficiency across various industries. As a result, companies in Indiana are finding the need for more operations research analysts to help them ride the winds of change and make sense of all the new opportunities blowing their way! It's like they say, when it comes to hiring analysts, it's best to go with the flow of supply and demand!
What else correlates?
Wind power generated in Puerto Rico · all energy
The number of operations research analysts in Indiana · all cccupations
Wind power generated in Puerto Rico · all energy
The number of operations research analysts in Indiana · all cccupations


View details about correlation #3,895
Close Encounters of the Third Climbing Kind: A Statistical Analysis of UFO Sightings in Delaware and Successful Mount Everest Climbs
As more UFOs appeared over Delaware, it created a buzz among the locals. They started to think, "If aliens can reach new heights, why can't we?" This led to a surge in interest in Mount Everest expeditions, with people feeling inspired to elevate their own experiences. It's as if the UFOs were saying, "Take me to your summit!" The connection may seem far-fetched, but it's like they say, "The truth is out there, and so are the climbers!"


What else correlates?
UFO sightings in Delaware · all random state specific
Total Number of Successful Mount Everest Climbs · all weird & wacky
UFO sightings in Delaware · all random state specific
Total Number of Successful Mount Everest Climbs · all weird & wacky


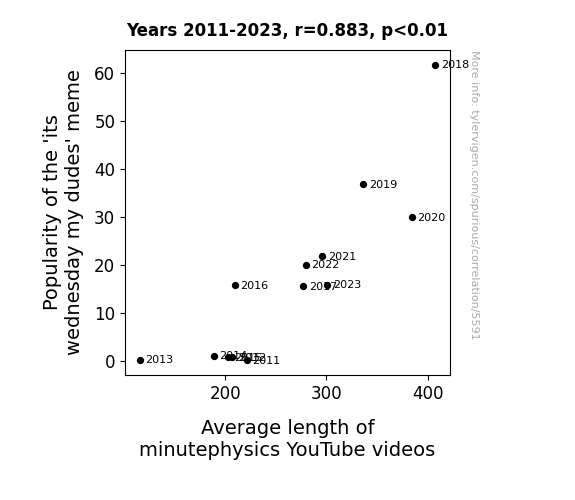
View details about correlation #5,591
The Connection Between 'It's Wednesday My Dudes' Meme Popularity and Average Length of minutephysics YouTube Videos: A Correlative Analysis
The popularity of the 'its wednesday my dudes' meme created a demand for longer content to keep people entertained on hump day. As the meme spread, it created a ripple effect leading to a surge in viewership for minutephysics. The creators, wanting to ride the wave of success, decided to add more 'depth' to their videos, making them 'unmeasurably' longer. It's a case of meme-orable influence on the space-time continuum of YouTube content!

What else correlates?
Popularity of the 'its wednesday my dudes' meme · all memes
Average length of minutephysics YouTube videos · all YouTube
Popularity of the 'its wednesday my dudes' meme · all memes
Average length of minutephysics YouTube videos · all YouTube


View details about correlation #5,711
Raekwon or Bluewon? Investigating the Relationship between Name Popularity and Political Preferences in Louisiana
It turns out, Raekwon had quite the fan base in Louisiana, who dubbed themselves the "Wu-Tang Blue Clan." As his name fell out of favor, so did their enthusiasm for the Democratic candidate. It seems Raekwon's waning popularity had a real political impact, making it a true electoral wu-tang dang!


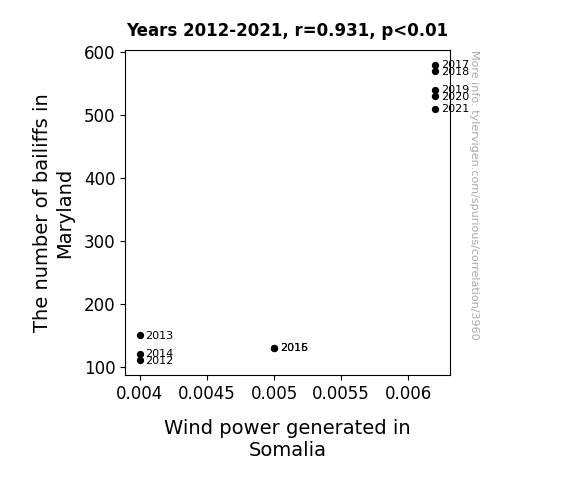
View details about correlation #3,960
Bailiffs Blowing in the Wind: Unraveling the Surprising Relationship Between Bailiff Numbers in Maryland and Wind Power Generation in Somalia
More bailiffs in Maryland led to a surge in the production of court documents. This, in turn, created a higher demand for paper, prompting Somalia to amp up its wind power production to operate the paper mills. It's a classic case of legal proceedings blowing some renewable energy across the globe!
What else correlates?
The number of bailiffs in Maryland · all cccupations
Wind power generated in Somalia · all energy
The number of bailiffs in Maryland · all cccupations
Wind power generated in Somalia · all energy
Why this works
- Data dredging: I have 25,237 variables in my database. I compare all these variables against each other to find ones that randomly match up. That's 636,906,169 correlation calculations! This is called “data dredging.”
Fun fact: the chart used on the wikipedia page to demonstrate data dredging is also from me. I've been being naughty with data since 2014.
Instead of starting with a hypothesis and testing it, I instead tossed a bunch of data in a blender to see what correlations would shake out. It’s a dangerous way to go about analysis, because any sufficiently large dataset will yield strong correlations completely at random. - Lack of causal connection: There is probably no direct connection between these variables, despite what the AI says above.
Because these pages are automatically generated, it's possible that the two variables you are viewing are in fact causually related. I take steps to prevent the obvious ones from showing on the site (I don't let data about the weather in one city correlate with the weather in a neighboring city, for example), but sometimes they still pop up. If they are related, cool! You found a loophole.
This is exacerbated by the fact that I used "Years" as the base variable. Lots of things happen in a year that are not related to each other! Most studies would use something like "one person" in stead of "one year" to be the "thing" studied. - Observations not independent: For many variables, sequential years are not independent of each other. You will often see trend-lines form. If a population of people is continuously doing something every day, there is no reason to think they would suddenly change how they are doing that thing on January 1. A naive p-value calculation does not take this into account.
You will calculate a lower chance of "randomly" achieving the result than represents reality.
To be more specific: p-value tests are probability values, where you are calculating the probability of achieving a result at least as extreme as you found completely by chance. When calculating a p-value, you need to assert how many "degrees of freedom" your variable has. I count each year (minus one) as a "degree of freedom," but this is misleading for continuous variables.
This kind of thing can creep up on you pretty easily when using p-values, which is why it's best to take it as "one of many" inputs that help you assess the results of your analysis.
- Y-axes doesn't start at zero: I truncated the Y-axes of the graphs above. I also used a line graph, which makes the visual connection stand out more than it deserves.
Nothing against line graphs. They are great at telling a story when you have linear data! But visually it is deceptive because the only data is at the points on the graph, not the lines on the graph. In between each point, the data could have been doing anything. Like going for a random walk by itself!
Mathematically what I showed is true, but it is intentionally misleading. If you click on any of the charts that abuse this, you can scroll down to see a version that starts at zero. - Confounding variable: Confounding variables (like global pandemics) will cause two variables to look connected when in fact a "sneaky third" variable is influencing both of them behind the scenes.
- Outliers: Some datasets here have outliers which drag up the correlation.
In concept, "outlier" just means "way different than the rest of your dataset." When calculating a correlation like this, they are particularly impactful because a single outlier can substantially increase your correlation.
Because this page is automatically generated, I don't know whether any of the charts displayed on it have outliers. I'm just a footnote. ¯\_(ツ)_/¯
I intentionally mishandeled outliers, which makes the correlation look extra strong. - Low n: There are not many data points included in some of these charts.
You can do analyses with low ns! But you shouldn't data dredge with a low n.
Even if the p-value is high, we should be suspicious of using so few datapoints in a correlation.
Pro-tip: click on any correlation to see:
- Detailed data sources
- Prompts for the AI-generated content
- Explanations of each of the calculations (correlation, p-value)
- Python code to calculate it yourself


