spurious correlations
discover · random · spurious scholar
← previous page · next page →


View details about correlation #1,906
Laying the Foundations of Love: A Pipedream or Reality?
As the number of pipelayers in New Jersey dwindled, so did the pipeline of love woes flowing into the United Kingdom. With fewer pipelayers around, there was less pipe-laying drama to go around, leading to smoother relationships and a decrease in divorces across the pond. It seems like when it comes to matters of the heart, even the pipeline industry has a stake in keeping things "couples flowing"!


What else correlates?
The number of pipelayers in New Jersey · all cccupations
Divorce rates in the United Kingdom · all weird & wacky
The number of pipelayers in New Jersey · all cccupations
Divorce rates in the United Kingdom · all weird & wacky


View details about correlation #1,491
A Stitch in Time Saves Nein: The Headache-inducing Connection Between Genetically Modified Cotton and Google Searches for 'I Have a Headache'
The GMO cotton was really sticking it to you, eh? As the cotton plants grew bigger and stronger, they were also releasing a new type of pest-erizing pollen. This pollen wasn't just a pain in the neck for bugs, but it also had an uncanny ability to gin up your headache frequency. It seems like the more the cotton grew, the more your headache problem seemed to be spinning out of control. Looks like you're not the only one experiencing a bit of a Monsanto-strosity in the form of a headache influx. Talk about a reaping what you sow situation, or should I say sewing what you're reaping?


What else correlates?
GMO use in cotton in California · all food
Google searches for 'i have a headache' · all google searches
GMO use in cotton in California · all food
Google searches for 'i have a headache' · all google searches


View details about correlation #2,773
Master-ing Burglary: A Hilarious Connection Between Master's Degrees in Area, Ethnic, Cultural, Gender, and Group Studies and Burglary Rates
As the number of experts in hidden histories and marginalized communities dwindled, so did the demand for stolen artifacts and black market cultural relics. Thieves just couldn't find a lucrative market for looted indigenous artwork or pilfered gender studies textbooks. With fewer opportunities for culturally themed heists, it seemed that even the criminal world had to acknowledge the importance of respecting people's stories and identities. Who knew that the key to reducing burglary rates lay in embracing diversity and inclusivity!


What else correlates?
Master's degrees awarded in gender studies · all education
Burglary rates in the US · all random state specific
Master's degrees awarded in gender studies · all education
Burglary rates in the US · all random state specific


View details about correlation #2,500
Fuming Fargo: Fluctuations in Air Pollution and the Gabonese Grin of Solar Power Generation
The smog particles inadvertently reflected more sunlight toward Gabon, giving their solar panels an unexpected boost in energy production. It's the unlikeliest of international partnerships - Fargo's pollution inadvertently becoming Gabon's eco-friendly, albeit unconventional, energy source. Who would have thought that as Fargo's pollution levels rose, so did Gabon's solar power output? It's a classic case of environmental irony - as one region's air quality darkened, another's clean energy prospects brightened.


What else correlates?
Air pollution in Fargo · all weather
Solar power generated in Gabon · all energy
Air pollution in Fargo · all weather
Solar power generated in Gabon · all energy
. The chart goes from 2003 to 2022, and the two variables track closely in value over that time.")

View details about correlation #3,070
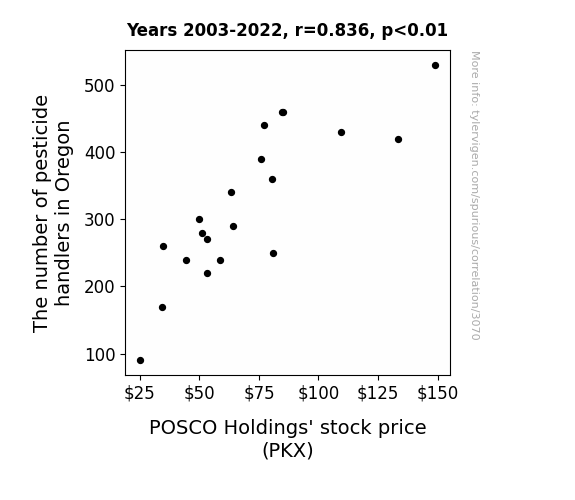
The Pesticide Handlers of Oregon: A Bizarre Influence on the Stock Price of POSCO Holdings (PKX)
The pesticide handlers were really branching out and finding innovative ways to weed out the competition, leading to a sprout in productivity. As they continued to cultivate their skills, it caused a ripple effect in the market, ultimately leading to a stock price that was just plane stunning.
What else correlates?
The number of pesticide handlers in Oregon · all cccupations
POSCO Holdings' stock price (PKX) · all stocks
The number of pesticide handlers in Oregon · all cccupations
POSCO Holdings' stock price (PKX) · all stocks


View details about correlation #2,197
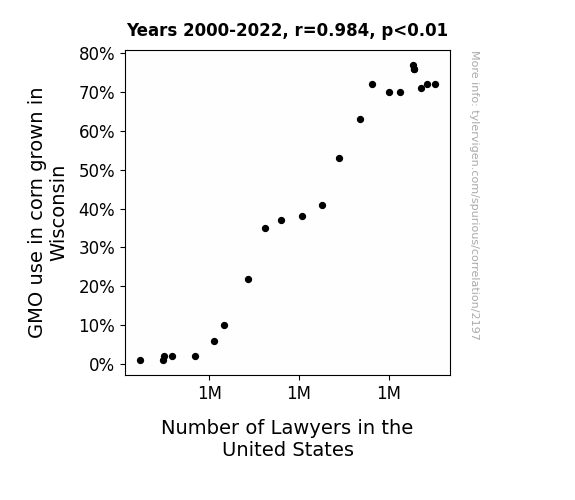
Kernel of Truth: Unveiling the Legal Cornundrum - Quantifying the Link Between GMO Corn in Wisconsin and the Number of Lawyers in the United States
As GMO corn production in Wisconsin surged, so did the population of corn earworms. These clever pests developed such a voracious appetite for the genetically modified corn that they inadvertently started a legal battle over the rights to the corn fields. As more and more corn-related lawsuits popped up, lawyers across the United States seized the opportunity to argue for or against the corny cases, leading to a dramatic increase in the number of lawyers. It was a-maize-ing how quickly the legal field became ear-resistibly attracted to this new source of litigation, creating a kernel of truth in the saying, "Where there's a kernel, there's a lawsuit!"

What else correlates?
GMO use in corn grown in Wisconsin · all food
Number of Lawyers in the United States · all weird & wacky
GMO use in corn grown in Wisconsin · all food
Number of Lawyers in the United States · all weird & wacky


View details about correlation #2,190
Field of Schemes: The Correlation Between Associates Degrees in Homeland Security and Protective Services and Ticket Sales for Washington Nationals Games
As more people became experts in homeland security, they realized the only way to truly defend their nation was by catching foul balls and intercepting home runs at Nationals games. It seems like learning about protective services really made them want to *catch* all the action on the field.


What else correlates?
Associates degrees awarded in Homeland security · all education
Ticket sales for Washington Nationals games · all sports
Associates degrees awarded in Homeland security · all education
Ticket sales for Washington Nationals games · all sports


View details about correlation #2,768
From Minneapolis Smog to Bulgarian Fuel: Unlikely Partners in Pollution
The decrease in air pollution in Minneapolis led to a worldwide movement for cleaner air. This movement, as air-odynamic as it was, blew over to Bulgaria and sparked a fuel frenzy for more eco-friendly transportation options. It seems like cleaner air in one city can really fuel change in another!


What else correlates?
Air pollution in Minneapolis · all weather
Petroluem consumption in Bulgaria · all energy
Air pollution in Minneapolis · all weather
Petroluem consumption in Bulgaria · all energy


View details about correlation #3,634
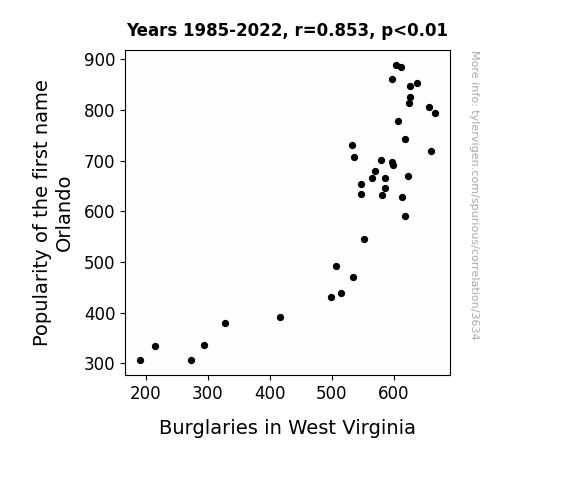
Orlando's Popularity and West Virginia's Criminality: A Correlational Study
Fewer parents were naming their kids after the city in Florida, leading to a decrease in subconscious desires to visit sunny, crime-free locations. As a result, the overall burglary rates in West Virginia decreased, because, let's face it, nobody wants to steal West Virginia's thunder.

What else correlates?
Popularity of the first name Orlando · all first names
Burglaries in West Virginia · all random state specific
Popularity of the first name Orlando · all first names
Burglaries in West Virginia · all random state specific


View details about correlation #2,838
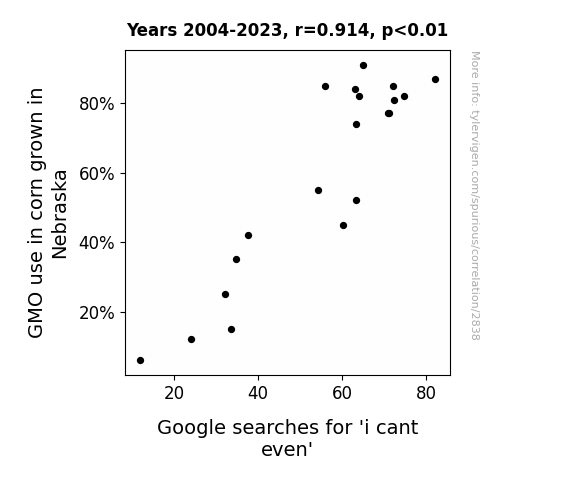
GMO Guzzling Corn: The Google Gambit on 'I Can't Even'
The GMO corn in Nebraska has developed a kernel of sass, leading to unprecedented levels of corn-based puns and sassiness on social media. People just can't ear it anymore!

What else correlates?
GMO use in corn grown in Nebraska · all food
Google searches for 'i cant even' · all google searches
GMO use in corn grown in Nebraska · all food
Google searches for 'i cant even' · all google searches
. The chart goes from 2007 to 2023, and the two variables track closely in value over that time.")

View details about correlation #2,153
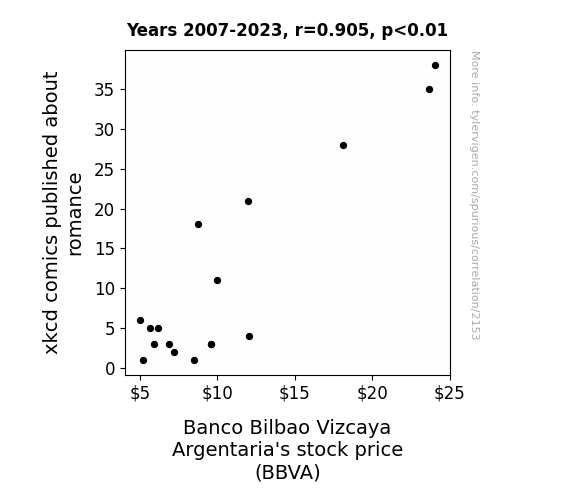
LOL: Love's Impact on Stock: Analyzing the Relationship between xkcd Romance Comics and Banco Bilbao Vizcaya Argentaria's Stock Price
As the number of romantic xkcd comics decreased, people's faith in love and relationships was shaken. This led to an increase in irrational financial decision-making, including selling off Banco Bilbao Vizcaya Argentaria stock, ultimately causing a decrease in the stock price. Remember, never underestimate the power of quirky stick figure comics on the economy!

What else correlates?
xkcd comics published about romance · all weird & wacky
Banco Bilbao Vizcaya Argentaria's stock price (BBVA) · all stocks
xkcd comics published about romance · all weird & wacky
Banco Bilbao Vizcaya Argentaria's stock price (BBVA) · all stocks


View details about correlation #2,986
Master's Degrees in Education and the Magnitude of Avionics Technicians in Tennessee: A Tenuous Tangle of Training?
As the number of Master's degrees awarded in Education decreased, there was a corresponding decline in the collective ability to construct and operate paper airplanes. With fewer skilled educators, the proficiency in paper airplane design and aerodynamics also took a nosedive. This ultimately led to a shortage of qualified avionics technicians in Tennessee, as the state's recruitment heavily relied on the precision and expertise honed through the art of paper aviation. It turns out, the flight of fancy for educational excellence had unforeseen consequences for the aviation industry in Tennessee.


What else correlates?
Master's degrees awarded in Education · all education
The number of avionics technicians in Tennessee · all cccupations
Master's degrees awarded in Education · all education
The number of avionics technicians in Tennessee · all cccupations


View details about correlation #1,910
Advantage Nuclear: Exploring the Sharapova Effect on France's Power Play
As Maria Sharapova's WTA title count increased, so did the power and energy she exuded on the court. This surge in her personal power was matched only by the unstoppable force of nuclear power generation in France. It's like she served up a winning formula for atomic success, acing her way to victory and inspiring an entire nation to unleash their own 'unbeatable' potential in the realm of nuclear energy. It's a smashing connection that proves in the game of power, Sharapova's influence is truly explosive!
What else correlates?
Maria Sharapova's WTA Title Count · all sports
Nuclear power generation in France · all energy
Maria Sharapova's WTA Title Count · all sports
Nuclear power generation in France · all energy


View details about correlation #3,172
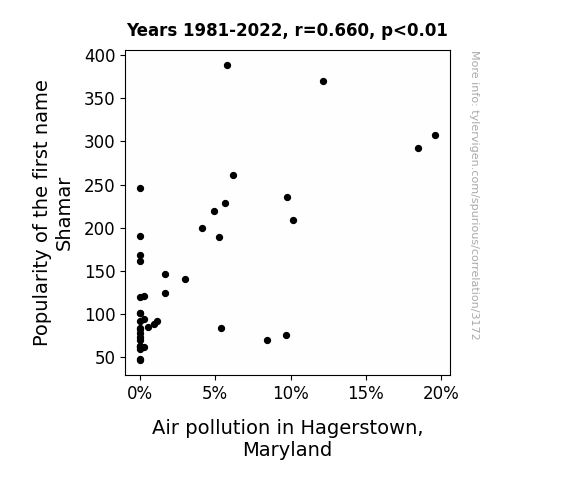
The AQI of Shamar: Exploring the Link Between The Popularity of the Name Shamar and Air Pollution in Hagerstown, Maryland
As the number of Shamar's increased, so did the demand for personalized air fresheners, leading to a spike in production at the local factory. The factory workers were so focused on creating the perfect scents that they accidentally released more pollutants into the air. It seems that Shamar's just couldn't help but make their mark on Hagerstown, one aromatic mishap at a time!

What else correlates?
Popularity of the first name Shamar · all first names
Air pollution in Hagerstown, Maryland · all weather
Popularity of the first name Shamar · all first names
Air pollution in Hagerstown, Maryland · all weather


View details about correlation #1,694
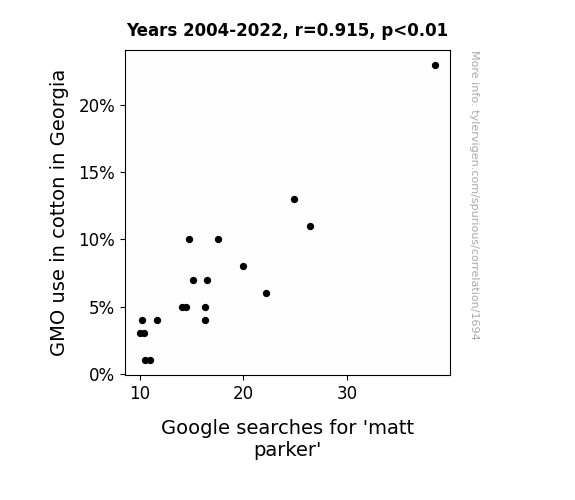
Cotton Pickin' Math: The Gossypium Hirsutum Hypothesis - Examining the Correlation Between GMO Cotton Cultivation in Georgia and Google Searches for 'Matt Parker'
The genetically modified cotton in Georgia was inadvertently transmitting internet-blocking signals, leading to a decrease in online activity whenever the cotton was in full bloom. As a result, fewer people were able to access the internet to search for Matt Parker, causing his Google searches to decrease.

What else correlates?
GMO use in cotton in Georgia · all food
Google searches for 'matt parker' · all google searches
GMO use in cotton in Georgia · all food
Google searches for 'matt parker' · all google searches


View details about correlation #3,526
Ridiculously Rapid Rice Rampage: The Relationship Between Global Per Capita Rice Consumption and The number of legislators in Alaska
People realized they could just stick to their day jobs instead of rice-ing to the occasion in politics.


What else correlates?
Global Per Capita Rice Consumption · all weird & wacky
The number of legislators in Alaska · all cccupations
Global Per Capita Rice Consumption · all weird & wacky
The number of legislators in Alaska · all cccupations


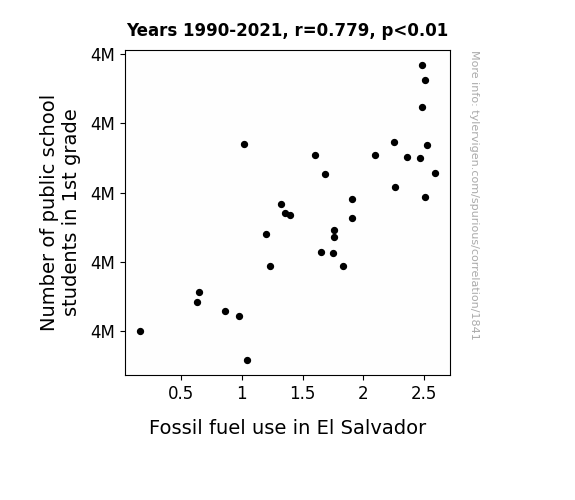
View details about correlation #1,841
First Grade Fossil Fiasco: A Study of the Connection Between Student Enrollment and Fuel Consumption in El Salvador
As the number of 1st graders in public schools in El Salvador increases, so does the demand for school buses, leading to a fossil fuel frenzy! It seems these youngsters are really *fueling* the nation's transportation sector. Seems like El Salvador is experiencing a grade-1 surge in fossil fuel use, all thanks to their education system's popularity! The situation is getting pretty *elementary*, my dear Watson.

What else correlates?
Number of public school students in 1st grade · all education
Fossil fuel use in El Salvador · all energy
Number of public school students in 1st grade · all education
Fossil fuel use in El Salvador · all energy


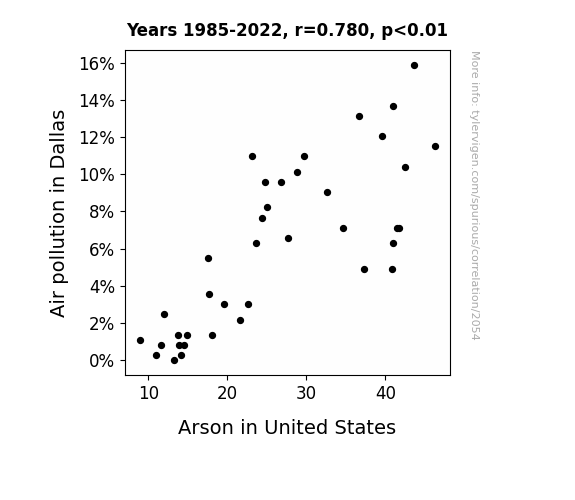
View details about correlation #2,054
Up in Smoke: Investigating the Link Between Air Pollution in Dallas and Arson in the United States
As air quality improved, it turns out that there was less need for people to "burn" with anger, leading to a reduction in fiery crimes. This unexpected correlation has sparked a new approach to fire prevention - just clear the air and let the flames of arson fizzle out!

What else correlates?
Air pollution in Dallas · all weather
Arson in United States · all random state specific
Air pollution in Dallas · all weather
Arson in United States · all random state specific
. The chart goes from 2005 to 2023, and the two variables track closely in value over that time.")

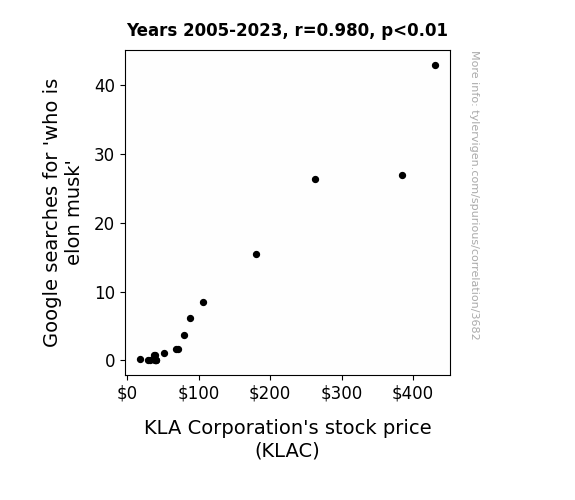
View details about correlation #3,682
Searching for Signals: The Shocking Connection Between Googling 'Who is Elon Musk' and KLA Corporation's Stock Price (KLAC)
As more people became acquainted with the enigmatic figure, Elon Musk, a wave of inspiration swept the nation. Suddenly, everyone wanted to be as innovative and forward-thinking as the man behind SpaceX and Tesla. This led to a spike in demand for high-tech equipment, including the products manufactured by KLA Corporation. It seems that even the stock market couldn't resist the gravitational pull of Elon's larger-than-life persona.

What else correlates?
Google searches for 'who is elon musk' · all google searches
KLA Corporation's stock price (KLAC) · all stocks
Google searches for 'who is elon musk' · all google searches
KLA Corporation's stock price (KLAC) · all stocks


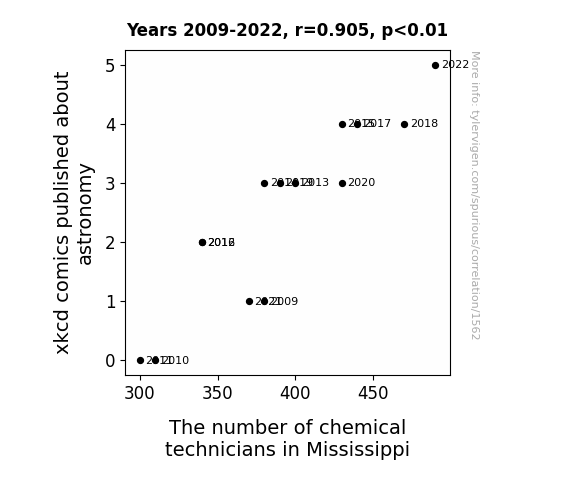
View details about correlation #1,562
Stellar Connections: The Interstellar Relationship Between xkcd Astronomy Comics and the Number of Chemical Technicians in the Magnolia State
The influx of astronomy-themed xkcd comics led to a cosmic shift in Mississippi's interest in chemistry. Perhaps the new comics were just the right "element" needed to spark curiosity and ignite a love for chemistry among the locals. It's like they say, when it comes to Mississippi's chemical technicians, the xkcd comics really "magnesium" difference!

Why this works
- Data dredging: I have 25,237 variables in my database. I compare all these variables against each other to find ones that randomly match up. That's 636,906,169 correlation calculations! This is called “data dredging.”
Fun fact: the chart used on the wikipedia page to demonstrate data dredging is also from me. I've been being naughty with data since 2014.
Instead of starting with a hypothesis and testing it, I instead tossed a bunch of data in a blender to see what correlations would shake out. It’s a dangerous way to go about analysis, because any sufficiently large dataset will yield strong correlations completely at random. - Lack of causal connection: There is probably no direct connection between these variables, despite what the AI says above.
Because these pages are automatically generated, it's possible that the two variables you are viewing are in fact causually related. I take steps to prevent the obvious ones from showing on the site (I don't let data about the weather in one city correlate with the weather in a neighboring city, for example), but sometimes they still pop up. If they are related, cool! You found a loophole.
This is exacerbated by the fact that I used "Years" as the base variable. Lots of things happen in a year that are not related to each other! Most studies would use something like "one person" in stead of "one year" to be the "thing" studied. - Observations not independent: For many variables, sequential years are not independent of each other. You will often see trend-lines form. If a population of people is continuously doing something every day, there is no reason to think they would suddenly change how they are doing that thing on January 1. A naive p-value calculation does not take this into account.
You will calculate a lower chance of "randomly" achieving the result than represents reality.
To be more specific: p-value tests are probability values, where you are calculating the probability of achieving a result at least as extreme as you found completely by chance. When calculating a p-value, you need to assert how many "degrees of freedom" your variable has. I count each year (minus one) as a "degree of freedom," but this is misleading for continuous variables.
This kind of thing can creep up on you pretty easily when using p-values, which is why it's best to take it as "one of many" inputs that help you assess the results of your analysis.
- Y-axes doesn't start at zero: I truncated the Y-axes of the graphs above. I also used a line graph, which makes the visual connection stand out more than it deserves.
Nothing against line graphs. They are great at telling a story when you have linear data! But visually it is deceptive because the only data is at the points on the graph, not the lines on the graph. In between each point, the data could have been doing anything. Like going for a random walk by itself!
Mathematically what I showed is true, but it is intentionally misleading. If you click on any of the charts that abuse this, you can scroll down to see a version that starts at zero. - Confounding variable: Confounding variables (like global pandemics) will cause two variables to look connected when in fact a "sneaky third" variable is influencing both of them behind the scenes.
- Outliers: Some datasets here have outliers which drag up the correlation.
In concept, "outlier" just means "way different than the rest of your dataset." When calculating a correlation like this, they are particularly impactful because a single outlier can substantially increase your correlation.
Because this page is automatically generated, I don't know whether any of the charts displayed on it have outliers. I'm just a footnote. ¯\_(ツ)_/¯
I intentionally mishandeled outliers, which makes the correlation look extra strong. - Low n: There are not many data points included in some of these charts.
You can do analyses with low ns! But you shouldn't data dredge with a low n.
Even if the p-value is high, we should be suspicious of using so few datapoints in a correlation.
Pro-tip: click on any correlation to see:
- Detailed data sources
- Prompts for the AI-generated content
- Explanations of each of the calculations (correlation, p-value)
- Python code to calculate it yourself


