spurious correlations
discover · random · spurious scholar
← previous page · next page →


View details about correlation #3,384
Brewing Up a Solar Storm: The Surprising Relationship Between U.S. Breweries and Solar Power Generation in Peru
As the number of breweries in the United States increased, so did the demand for beer. This led to a surge in hop production, creating a need for more agricultural labor in Peru. With more people working outdoors, the Peruvian solar power industry experienced a boost in productivity from all the extra sunshine beer as the real power source!


What else correlates?
The number of Breweries in the United States · all food
Solar power generated in Peru · all energy
The number of Breweries in the United States · all food
Solar power generated in Peru · all energy


View details about correlation #1,522
Ringed Planet’s Orbit and Desire to Procreate: A Statistical Analysis
Fewer distractions from Saturn's bling led to some out-of-this-world romance. Looks like love isn't the only thing that's been cosmic lately!


What else correlates?
The distance between Saturn and the Sun · all planets
Google searches for 'how to make baby' · all google searches
The distance between Saturn and the Sun · all planets
Google searches for 'how to make baby' · all google searches


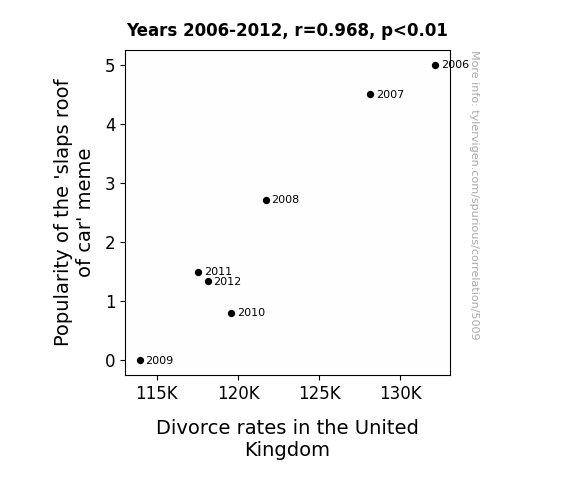
View details about correlation #5,009
Roof-Raising Resonance: Exploring the Tenuous Link between the 'Slaps Roof of Car' Meme and Divorce Rates in the United Kingdom
As the 'slaps roof of car' meme lost its appeal, spouses across the UK found themselves refraining from using meme references during arguments, leading to improved communication and fewer reasons to split. Looks like the meme's declining popularity paved the way for marital harmony. Remember, a meme in time saves matrimony!

What else correlates?
Popularity of the 'slaps roof of car' meme · all memes
Divorce rates in the United Kingdom · all weird & wacky
Popularity of the 'slaps roof of car' meme · all memes
Divorce rates in the United Kingdom · all weird & wacky


View details about correlation #2,317
From Degrees to Deeds: Public Administration and Social Services Graduates Leading Gas Plant Operaters to Fate's Beats
As the number of Bachelor's degrees in Public administration and social services rose, so did the enthusiasm for making a *career switch*. It seems that the graduates were well-versed in *managing gas emissions* and had a *knack for handling pressure* in the industry. This unexpected correlation suggests that when it comes to running gas plants, a background in public administration and social services might just be the *fuel for success*.

. The chart goes from 2002 to 2022, and the two variables track closely in value over that time.")

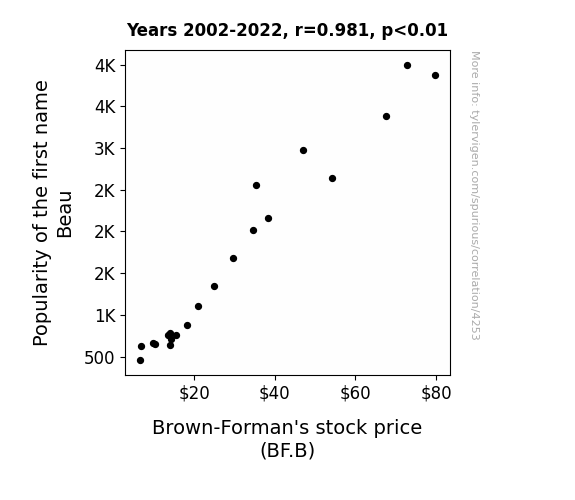
View details about correlation #4,253
Beau the Name, BF.B the Stock: A Beau-tiful Connection?
The more babies named Beau, the higher the demand for cute monogrammed baby bibs, leading to a spike in sales for Brown-Forman's subsidiary, Baby Bourbon Bibs Inc. This unexpected revenue boost sent Brown-Forman's stock price soaring, much to the bewilderment of the financial world.

What else correlates?
Popularity of the first name Beau · all first names
Brown-Forman's stock price (BF.B) · all stocks
Popularity of the first name Beau · all first names
Brown-Forman's stock price (BF.B) · all stocks


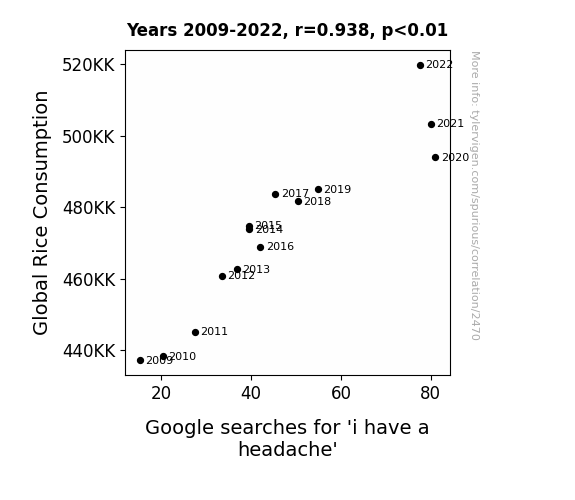
View details about correlation #2,470
Rice and Pains: Exploring the Correlation Between Global Rice Consumption and Google Searches for 'I Have a Headache'
As global rice consumption increases, so does the demand for soy sauce. The production of soy sauce leads to the release of tyramine, a compound known to trigger headaches in some individuals. So, the next time you reach for that bowl of rice, it might just be the soy sauce's way of saying "soy-ry, I'm causing a headache." Remember, this is all a funny made-up explanation!

What else correlates?
Global Rice Consumption · all food
Google searches for 'i have a headache' · all google searches
Global Rice Consumption · all food
Google searches for 'i have a headache' · all google searches


View details about correlation #1,159
Reaching New Heights: A Gastrointestinal Exploration of the Relationship Between Mount Everest Summits and Nathan's Hot Dog Eating Champions
As the number of successful Mount Everest climbs rises, so does the peak appetite for adventure. This, in turn, creates a sausage-yetis-faction where competitors are relishing the thrill of the challenge like never before, and they're on a roll to claim the title. It's a summit showdown of epic proportions, where each contender is truly reaching their peak performance. And as we all know, when it comes to devouring those dogs, these champions don't just climb, they condiment.


View details about correlation #1,727
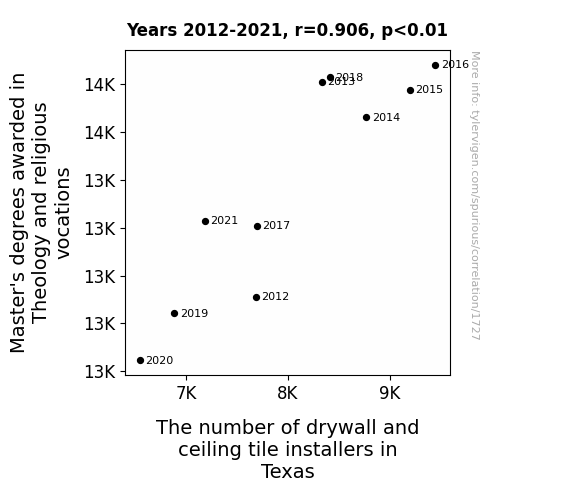
The Theology-Tile Tangle: Tracing the Tenuous Ties Between Master's Degrees in Theology and Religious Vocations and the Tally of Drywall and Ceiling Tile Installers in Texas
As more theologians entered the workforce, there was a surge in the creation of heavenly ceilings and immaculate walls, leading to a high demand for specialized installers in Texas. It's a case of divine intervention in the construction industry!

. The chart goes from 2002 to 2022, and the two variables track closely in value over that time.")

View details about correlation #2,645
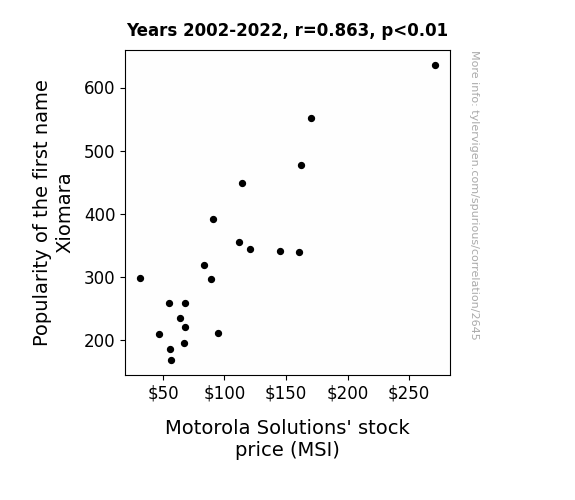
Xiomara's Popularity: A Quandary for MSI Prosperity
There were rumors that Motorola was planning to release a new line of smartphones specifically designed to cater to people with the name Xiomara. These phones would come in vibrant, unconventional colors and have a built-in feature that automatically translated popular slang and phrases into Xiomara's preferred dialect. The anticipation of this unexpected market strategy created a buzz around the company, leading to an uptick in their stock price.

What else correlates?
Popularity of the first name Xiomara · all first names
Motorola Solutions' stock price (MSI) · all stocks
Popularity of the first name Xiomara · all first names
Motorola Solutions' stock price (MSI) · all stocks


View details about correlation #4,623
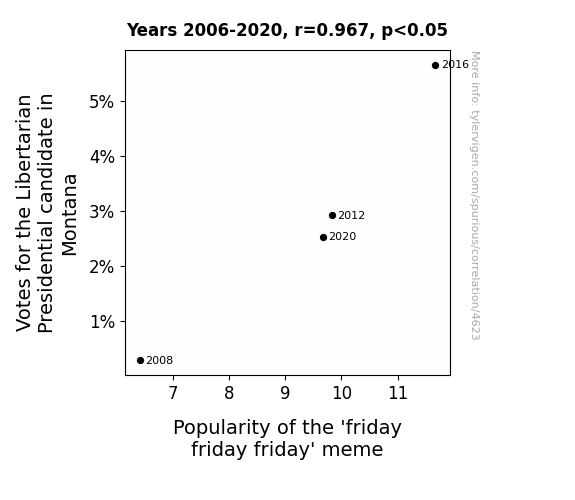
The Fringe Factor: Friday Friday Friday – A Libertarian Connection?
As more people embraced the Libertarian candidate's platform, they also adopted a 'free to have fun' mindset. This led to a surge in sharing the 'friday friday friday' meme as a rebellious declaration of their love for weekends and individual liberty. The meme became the unofficial anthem of breaking away from the traditional two-party system and embracing a 'live free, meme hard' mentality.


View details about correlation #2,632
E-nergy Connection: Shedding Light on the Link between Internet Access Rates in the US and Solar Power Generation in Honduras
As more Americans basked in the glow of cat videos and memes, their collective laughter resonated through the Earth, leading to a surge in solar energy production in distant lands. It's the first case of 'lol-ecology' on a global scale!


What else correlates?
Internet Access Rate among US Citizens · all weird & wacky
Solar power generated in Honduras · all energy
Internet Access Rate among US Citizens · all weird & wacky
Solar power generated in Honduras · all energy


View details about correlation #1,779
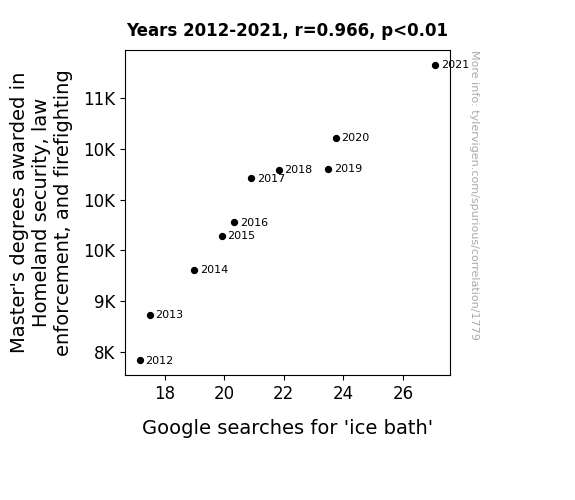
The Chilling Connection Between Master's Degrees and 'Ice Bath' Google Searches: A Statistical Splash
As the number of Master's degrees in homeland security, law enforcement, and firefighting has risen, so has the demand for highly trained professionals. These experts are bringing a whole new meaning to the phrase "keeping cool under pressure." With their specialized knowledge, they're creating a chillaxed atmosphere, leading to a nationwide trend of ice baths for stress relief. It seems like their ability to handle heated situations is positively impacting the nation's relaxation habits!


View details about correlation #3,596
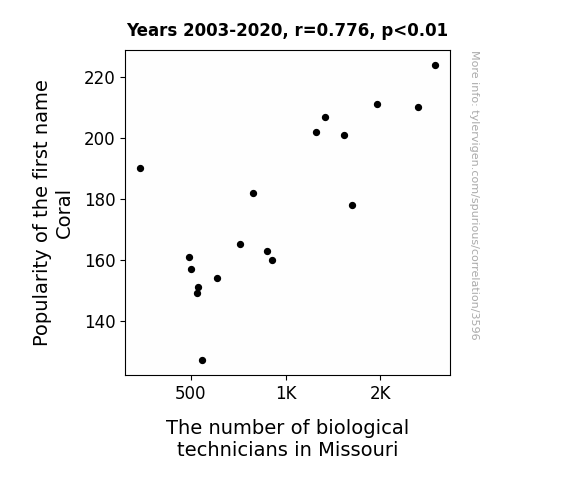
The Coral Connection: Examining the Link Between the Popularity of the Name Coral and the Employment of Biological Technicians in Missouri
As fewer babies were named Coral, there was a ripple effect in the marine biology community, leading to a decreased interest in studying coral reefs. This ultimately led to a reduced demand for biological technicians in Missouri who specialized in marine ecosystems. It seems the name Coral had more influence than we ever imagined, creating waves of change in unexpected places!

What else correlates?
Popularity of the first name Coral · all first names
The number of biological technicians in Missouri · all cccupations
Popularity of the first name Coral · all first names
The number of biological technicians in Missouri · all cccupations
. The chart goes from 2002 to 2023, and the two variables track closely in value over that time.")

View details about correlation #2,636
Stellar Stock Forecasting: Unveiling the Celestial Connection Between Neptune, Uranus, and Cognizant Technology Solutions' Stock Price
As the gravitational tug-of-war between the two outer planets intensified, it created a ripple effect in the space-time continuum, leading to a surge in cosmic productivity. This inexplicable celestial occurrence somehow boosted the demand for IT services, propelling Cognizant Technology Solutions' stock price to astronomical heights. Who knew that the key to financial success lay hidden in the outer realms of our solar system!


What else correlates?
The distance between Neptune and Uranus · all planets
Cognizant Technology Solutions' stock price (CTSH) · all stocks
The distance between Neptune and Uranus · all planets
Cognizant Technology Solutions' stock price (CTSH) · all stocks


View details about correlation #1,746
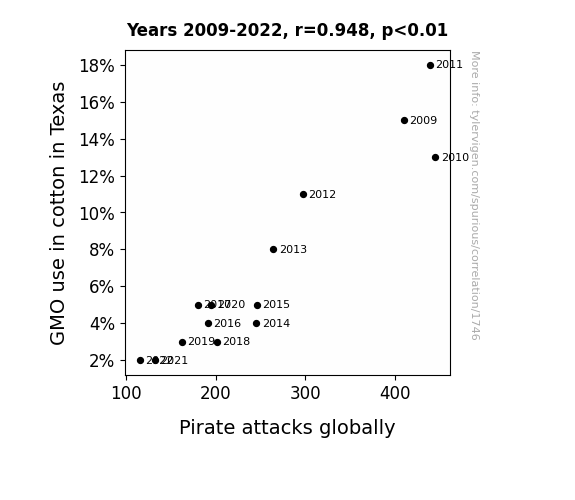
Stalk, Ship, and Swagger: The Unlikely Link Between GMO Cotton in Texas and Global Pirate Attacks
As GMO use in cotton decreased in Texas, it led to a reduction in the production of pirate-themed cotton clothing. This, in turn, caused a decline in people dressing up as pirates for 'Talk Like a Pirate Day', ultimately leading to a global decrease in pirate-related shenanigans. In other words, it seems that the Texas GMO change has truly 'sailed' the high seas of fashion and folklore!

What else correlates?
GMO use in cotton in Texas · all food
Pirate attacks globally · all weird & wacky
GMO use in cotton in Texas · all food
Pirate attacks globally · all weird & wacky


View details about correlation #2,163
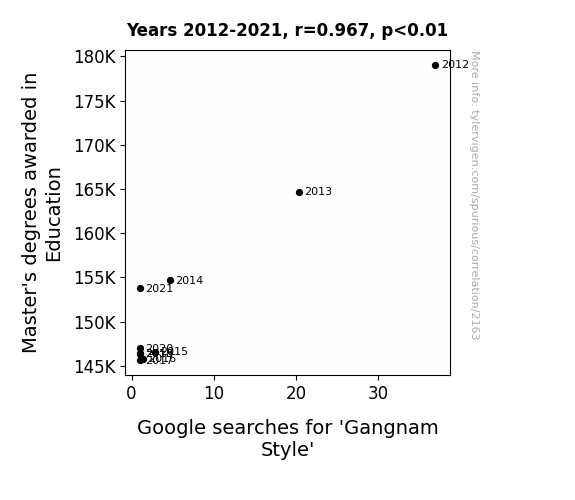
Mastering Gangnam Style: A Correlational Study of Education Master's Degrees and Google Searches
As the number of Master's degrees awarded in Education decreased, there was a corresponding decline in the proficiency of educators to perform the Gangnam Style dance in school environments, leading to less encouragement and opportunity for students to engage with the trend. Ultimately, this created a domino effect where 'Gangnam Style' became less influential in popular culture, all because educators couldn't keep up with the dance moves. Maybe they should have offered a Master's program in Dance Education!

What else correlates?
Master's degrees awarded in Education · all education
Google searches for 'Gangnam Style' · all google searches
Master's degrees awarded in Education · all education
Google searches for 'Gangnam Style' · all google searches


View details about correlation #1,059
Fueling the Farm: A Crude Connection Between Petroleum Consumption in Azerbaijan and the Number of Farm Equipment Mechanics in Alabama
As Azerbaijan's demand for petroluem grew, they started importing more petro-dollars from Alabama, leading to a spike in the sales of farm equipment. This, in turn, created a pressing need for additional farm equipment mechanics in Alabama to keep the increasingly busy farms up and running. It's like a chain reaction, but with a lot more grease and horsepower!

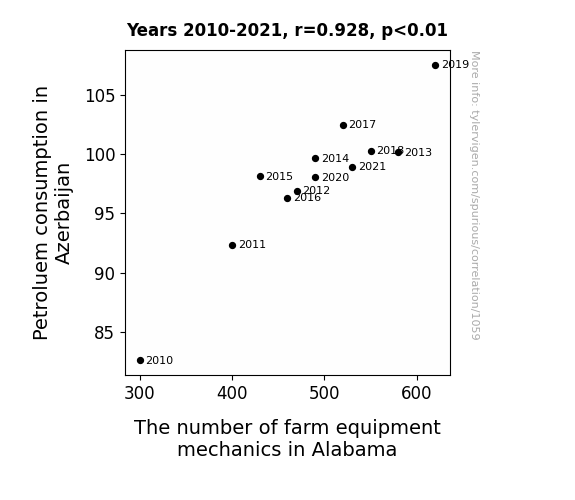
What else correlates?
Petroluem consumption in Azerbaijan · all energy
The number of farm equipment mechanics in Alabama · all cccupations
Petroluem consumption in Azerbaijan · all energy
The number of farm equipment mechanics in Alabama · all cccupations


View details about correlation #5,949
The Smog Blog: Does Air Pollution Foggily Influence the Propensity for the Name Kirk?
As the air cleared, people were no longer feeling the urge to "Kirk" off and stay indoors! With pollution levels down, parents were no longer "Kirk-umspect" about naming their children. The correlation is elementary, my dear Watson!

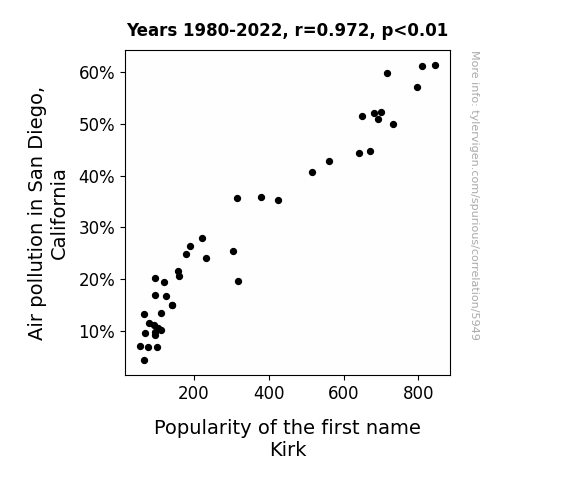
What else correlates?
Air pollution in San Diego, California · all weather
Popularity of the first name Kirk · all first names
Air pollution in San Diego, California · all weather
Popularity of the first name Kirk · all first names


View details about correlation #1,199
Put to the Test: Does American Cheese Bring Google's Profits to Their Knees?
As American cheese consumption melted, so did Google's competition, allowing them to brie the top dog in annual revenue. It's grate for Google, but they'll need to be careful not to get too cheesy with their success!

What else correlates?
American cheese consumption · all food
Google's Annual Global Revenue · all weird & wacky
American cheese consumption · all food
Google's Annual Global Revenue · all weird & wacky


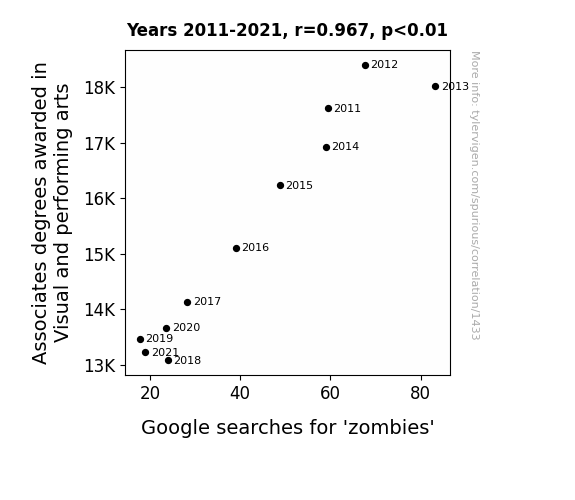
View details about correlation #1,433
Astonishing Affinity: Associates degrees in Arts and the Attraction of the Zombie Apocalypse
As the number of visual and performing arts degrees decreased, there were fewer people with the skills to create lifelike zombie special effects. This led to a decline in realistic zombie portrayals in movies and TV shows. In other words, it seems the art of crafting undead characters was on its way to a dead end.

Why this works
- Data dredging: I have 25,237 variables in my database. I compare all these variables against each other to find ones that randomly match up. That's 636,906,169 correlation calculations! This is called “data dredging.”
Fun fact: the chart used on the wikipedia page to demonstrate data dredging is also from me. I've been being naughty with data since 2014.
Instead of starting with a hypothesis and testing it, I instead tossed a bunch of data in a blender to see what correlations would shake out. It’s a dangerous way to go about analysis, because any sufficiently large dataset will yield strong correlations completely at random. - Lack of causal connection: There is probably no direct connection between these variables, despite what the AI says above.
Because these pages are automatically generated, it's possible that the two variables you are viewing are in fact causually related. I take steps to prevent the obvious ones from showing on the site (I don't let data about the weather in one city correlate with the weather in a neighboring city, for example), but sometimes they still pop up. If they are related, cool! You found a loophole.
This is exacerbated by the fact that I used "Years" as the base variable. Lots of things happen in a year that are not related to each other! Most studies would use something like "one person" in stead of "one year" to be the "thing" studied. - Observations not independent: For many variables, sequential years are not independent of each other. You will often see trend-lines form. If a population of people is continuously doing something every day, there is no reason to think they would suddenly change how they are doing that thing on January 1. A naive p-value calculation does not take this into account.
You will calculate a lower chance of "randomly" achieving the result than represents reality.
To be more specific: p-value tests are probability values, where you are calculating the probability of achieving a result at least as extreme as you found completely by chance. When calculating a p-value, you need to assert how many "degrees of freedom" your variable has. I count each year (minus one) as a "degree of freedom," but this is misleading for continuous variables.
This kind of thing can creep up on you pretty easily when using p-values, which is why it's best to take it as "one of many" inputs that help you assess the results of your analysis.
- Y-axes doesn't start at zero: I truncated the Y-axes of the graphs above. I also used a line graph, which makes the visual connection stand out more than it deserves.
Nothing against line graphs. They are great at telling a story when you have linear data! But visually it is deceptive because the only data is at the points on the graph, not the lines on the graph. In between each point, the data could have been doing anything. Like going for a random walk by itself!
Mathematically what I showed is true, but it is intentionally misleading. If you click on any of the charts that abuse this, you can scroll down to see a version that starts at zero. - Confounding variable: Confounding variables (like global pandemics) will cause two variables to look connected when in fact a "sneaky third" variable is influencing both of them behind the scenes.
- Outliers: Some datasets here have outliers which drag up the correlation.
In concept, "outlier" just means "way different than the rest of your dataset." When calculating a correlation like this, they are particularly impactful because a single outlier can substantially increase your correlation.
Because this page is automatically generated, I don't know whether any of the charts displayed on it have outliers. I'm just a footnote. ¯\_(ツ)_/¯
I intentionally mishandeled outliers, which makes the correlation look extra strong. - Low n: There are not many data points included in some of these charts.
You can do analyses with low ns! But you shouldn't data dredge with a low n.
Even if the p-value is high, we should be suspicious of using so few datapoints in a correlation.
Pro-tip: click on any correlation to see:
- Detailed data sources
- Prompts for the AI-generated content
- Explanations of each of the calculations (correlation, p-value)
- Python code to calculate it yourself


