spurious correlations
discover · random · spurious scholar
← previous page · next page →


View details about correlation #1,212
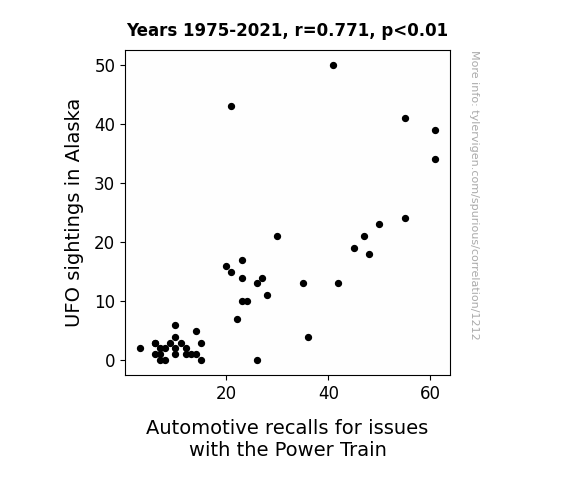
The UFO-Borne Power Train Predicament: A Close Encounter of the Wheels Kind
Due to the magnetic fields of the UFOs, the Power Train systems in cars were being temporarily scrambled, leading to a higher likelihood of malfunctions. This created a demand for better-designed Power Train systems, prompting automotive manufacturers to issue recalls in order to upgrade and improve the Power Train technology to be UFO-resistant.

What else correlates?
UFO sightings in Alaska · all random state specific
Automotive recalls for issues with the Power Train · all weird & wacky
UFO sightings in Alaska · all random state specific
Automotive recalls for issues with the Power Train · all weird & wacky


View details about correlation #4,484
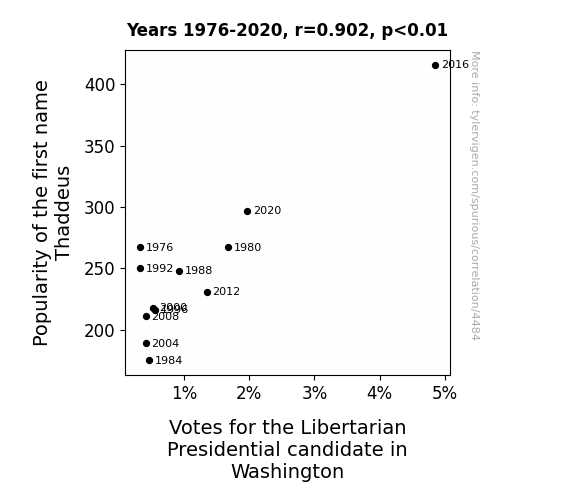
The Thaddeus Effect: Examining the Relationship Between Name Popularity and Political Leanings in Washington State
As the name Thaddeus gained popularity, more and more people couldn't help but associate it with the image of a sophisticated philosopher. This subconscious connection led to a surge in interest in political ideologies, prompting a notable increase in support for the Libertarian candidate among the intellectually-inclined population of Washington. It seems like Thaddeus was unwittingly paving the way for a politico-philosophical revolution!

. The chart goes from 2002 to 2022, and the two variables track closely in value over that time.")

View details about correlation #4,138
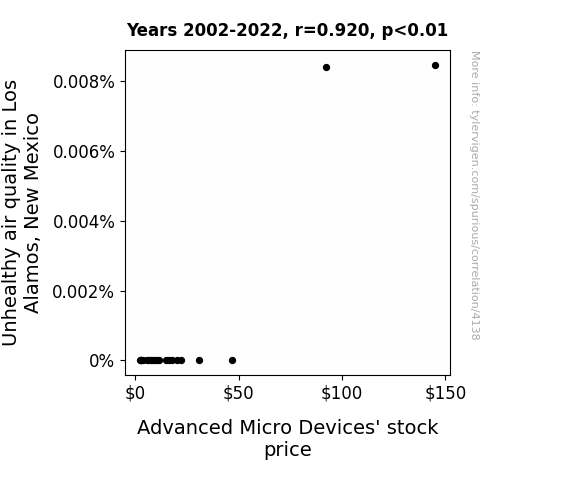
Gasping for Air: The Correlation Between Air Pollution in Los Alamos, New Mexico and AMD's Stock Price
The air pollution created a hazy barrier, effectively trapping rising stock prices within the city limits of Los Alamos. This led to a localized surge in demand for AMD stocks as residents scrambled to capitalize on the unexpected financial smog-fest.

What else correlates?
Air pollution in Los Alamos, New Mexico · all weather
Advanced Micro Devices' stock price (AMD) · all stocks
Air pollution in Los Alamos, New Mexico · all weather
Advanced Micro Devices' stock price (AMD) · all stocks


View details about correlation #3,362
The Vend and Kero Connection: An Unorthodox Link Between Vending Machine Repairers in New Hampshire and Kerosene Usage in Guinea
As the vending machine repairers in New Hampshire decreased, there was a ripple effect on the availability of snacks. This led to a dip in the demand for salty treats. With fewer people munching on snacks, there was a reduced need for kerosnack (kerosene for snacks) in Guinea, ultimately leading to a decrease in kerosene used. It seems like the lack of repairers really SNACKed the supply chain, creating a whole new conundrum.


What else correlates?
The number of vending machine repairers in New Hampshire · all cccupations
Kerosene used in Guinea · all energy
The number of vending machine repairers in New Hampshire · all cccupations
Kerosene used in Guinea · all energy


View details about correlation #1,834
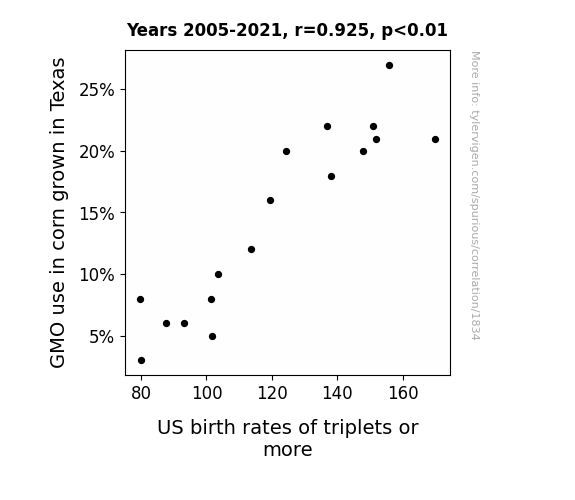
Genetically Modified Corn in Texas: Gearing Galore of Growing Great Grains and Grandiose Gravidity
As Texas corn lost its GMO superpowers, it could only manage to fertilize one kernel at a time. Less GM corn meant fewer corny pick-up lines for the storks to deliver.

What else correlates?
GMO use in corn grown in Texas · all food
US birth rates of triplets or more · all weird & wacky
GMO use in corn grown in Texas · all food
US birth rates of triplets or more · all weird & wacky


View details about correlation #4,857
Barking Up the Political Tree: Republican Votes for Senators in Michigan and Google Searches for 'Adopt a Dog'
As more Republican senators were elected, their campaign strategies focused heavily on loyalty, prompting a surge in supporters feeling the need to demonstrate their own faithfulness. This inadvertently led to a statewide wave of 'adopt a dog' searches, as Michiganders subconsciously sought to prove their dedication by expanding their own adoption base. After all, what better way to show allegiance than by embracing a new, four-legged member into their homes? It seems that in this political race, the call for constituents to 'fetch' a furry friend resonated far and wide, solidifying the notion that in the game of 'paw'-litics, everyone's a winner with a loyal canine companion by their side!

What else correlates?
Votes for Republican Senators in Michigan · all elections
Google searches for 'adopt a dog' · all google searches
Votes for Republican Senators in Michigan · all elections
Google searches for 'adopt a dog' · all google searches


View details about correlation #4,926
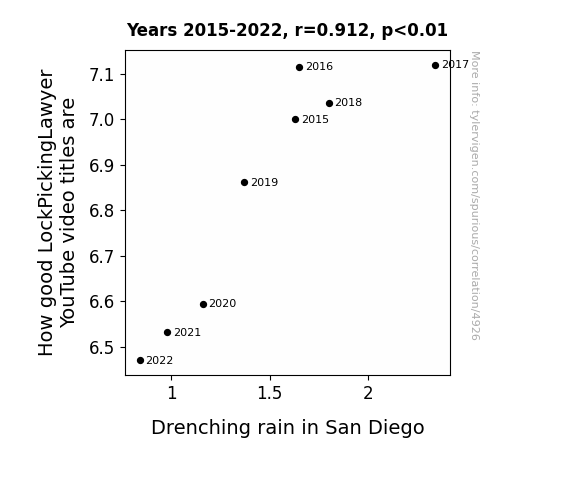
Rain in San Diego, LockPickingLawyer's Video Titles, and the Mystery Unveiled
As the rain pours down in San Diego, the local birds seek shelter and happen to nest near LockPickingLawyer's home. To express their frustration with the wet weather, they chirp loudly, disrupting the audio quality of his recordings. As a result, the LockPickingLawyer is unable to produce his usual high-quality content with subpar bird noise in the background, leading to a decrease in the goodness of his video titles. It's a true case of "fowl" play impacting the world of lock-picking entertainment.

What else correlates?
How good LockPickingLawyer YouTube video titles are · all YouTube
Drenching rain in San Diego · all weather
How good LockPickingLawyer YouTube video titles are · all YouTube
Drenching rain in San Diego · all weather


View details about correlation #3,181
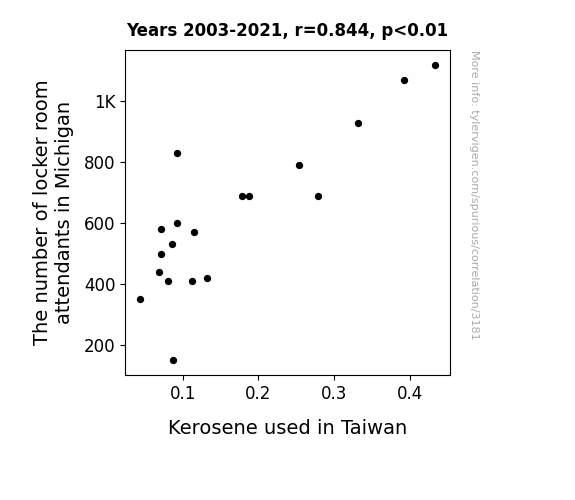
Linking Locker Room Labor to Luminous Liquid: An Eccentric Examination
The fewer locker room attendants in Michigan meant less idle locker room chatter. This led to a decrease in hot air production, resulting in a reduced global demand for kerosene in a bizarrely interconnected way.

What else correlates?
The number of locker room attendants in Michigan · all cccupations
Kerosene used in Taiwan · all energy
The number of locker room attendants in Michigan · all cccupations
Kerosene used in Taiwan · all energy


View details about correlation #1,499
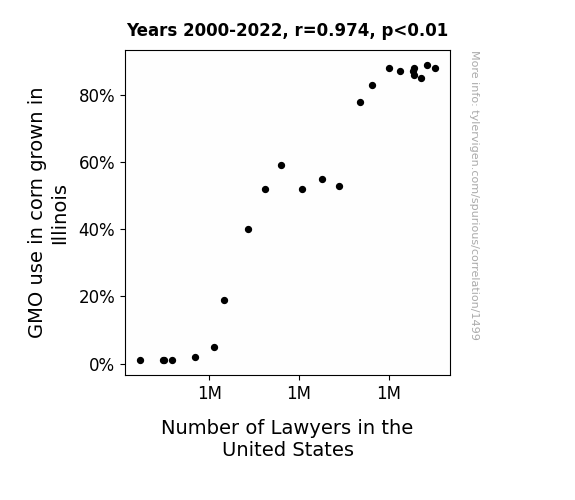
GMO Corn in IL: A Juxtaposition with Lawyers in the US - Is There a Kernel of Truth?
As GMO corn in Illinois grew larger and more robust, it inadvertently led to a kernel of legal controversy. The unruly cornstalks began to trespass onto neighboring fields, sparking a-maize-ing property disputes. Farmers couldn't shuck off their legal responsibilities, so they lawyered up, turning the fields into a battleground. The cases kept popping up like... well, corn! The legal cob-dundrum resulted in a corn-ucopia of work for lawyers across the country, giving a whole new meaning to the term "agricultural law." It was a-maize-ing how a little genetic modification could lead to so much litig-corn!
What else correlates?
GMO use in corn grown in Illinois · all food
Number of Lawyers in the United States · all weird & wacky
GMO use in corn grown in Illinois · all food
Number of Lawyers in the United States · all weird & wacky


View details about correlation #4,457
Harry Potter and Iowa Republican Voter Plotter: A Correlational Analysis
Some Iowans mistakenly thought they were voting for a new Defense Against the Dark Arts professor. When they realized their error, they decided to brush up on their Harry Potter knowledge for the next election.


What else correlates?
Votes for Republican Senators in Iowa · all elections
Google searches for 'harry potter' · all google searches
Votes for Republican Senators in Iowa · all elections
Google searches for 'harry potter' · all google searches


View details about correlation #4,893
The Myesha Mystique: A Breath of Fresh Air in Clinton, Iowa
As the number of Myeshas dwindled, so did the collective ability to generate positive vibes. This led to a noticeable lack of people complimenting the air, which in turn caused the air quality in Clinton to spiral downwards. Who knew that Myesha had been low-key carrying the responsibility of keeping the air pristine all along? It's a Myesha mystery!


What else correlates?
Popularity of the first name Myesha · all first names
Air quality in Clinton, Iowa · all weather
Popularity of the first name Myesha · all first names
Air quality in Clinton, Iowa · all weather


View details about correlation #3,420
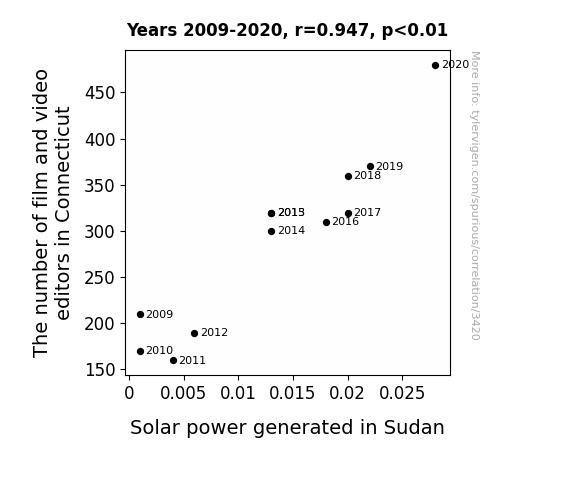
Editing Energies: The Reel Connection between Film Editors in Connecticut and Solar Power in Sudan
As more film and video editors in Connecticut honed their craft, they inadvertently perfected the art of brightening scenes. This led to an unexpected side effect - a surge in solar panel efficiency in Sudan as the edited videos somehow beamed a newfound cinematic radiance, energizing the previously lackluster solar power production. It seems the real power of editing was not just in shaping stories, but in also shining a light on renewable energy in a truly illuminating collaboration between the entertainment industry and the sun-drenched deserts of Sudan. Who knew that the key to boosting solar power lay in the reel world of film editing!

What else correlates?
The number of film and video editors in Connecticut · all cccupations
Solar power generated in Sudan · all energy
The number of film and video editors in Connecticut · all cccupations
Solar power generated in Sudan · all energy


View details about correlation #1,440
Butter Boosts or Busts: Bizarre Connection Between Butter Consumption and Hyundai Motor America Automotive Recalls
As butter consumption rose, so did the number of slippery fingers. This led to an increase in car accidents, prompting Hyundai Motor America to issue more recalls for vehicle safety issues. It's a classic case of dairy-licious disaster leading to a greasy road of automotive mayhem. Remember, when it comes to butter and cars, it's best to spread cautiously and keep a firm grip on the wheel!


What else correlates?
Butter consumption · all food
Automotive recalls issued by Hyundai Motor America · all weird & wacky
Butter consumption · all food
Automotive recalls issued by Hyundai Motor America · all weird & wacky
. The chart goes from 2013 to 2023, and the two variables track closely in value over that time.")

View details about correlation #4,910
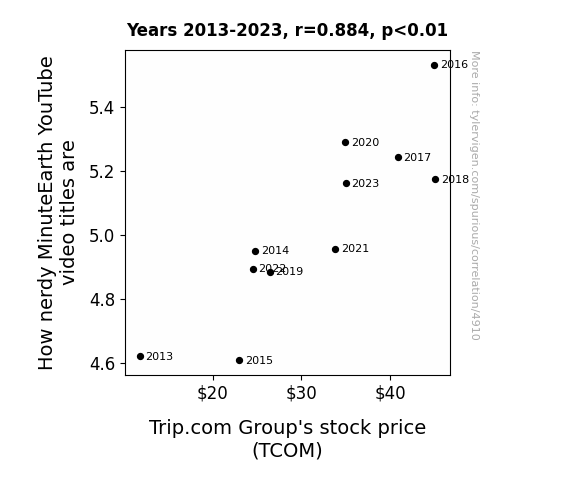
The Nerdy and the Nifty: Exploring the Relationship Between MinuteEarth Video Titles and Trip.com Group's Stock Price
As more people watch MinuteEarth, they become interested in nerdy topics. This leads to a surge in demand for pocket protectors and thick-rimmed glasses, inadvertently causing a spike in TCOM stock, because everyone knows that true nerds book their trips through Trip.com!

What else correlates?
How nerdy MinuteEarth YouTube video titles are · all YouTube
Trip.com Group's stock price (TCOM) · all stocks
How nerdy MinuteEarth YouTube video titles are · all YouTube
Trip.com Group's stock price (TCOM) · all stocks


View details about correlation #4,727
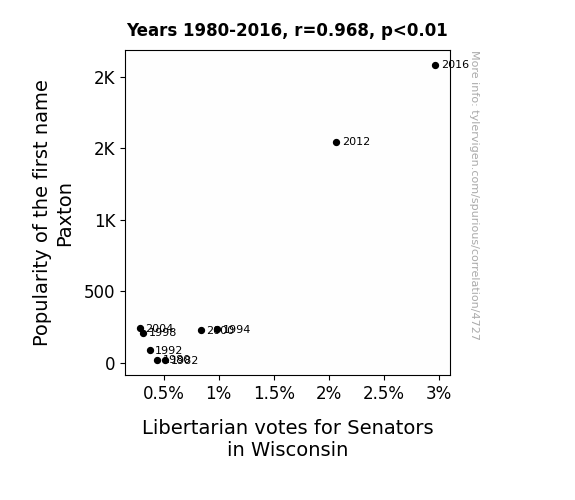
The Paxton Paradox: A Statistical Connection between First Name Popularity and Libertarian Votes for Senators in Wisconsin
The name Paxton exudes an aura of independence and nonconformity. It's like the name itself comes with a tiny flag and a copy of Atlas Shrugged. People hear the name Paxton and suddenly they're all about personal freedom and limited government. It's as if there's a subconscious association with Pax, the Latin word for peace, and non-interventionist foreign policy. Maybe it's because Paxton sounds like a renegade cowboy who only answers to himself. Or perhaps there's a secret society of Paxtons covertly promoting individual liberties. Clearly, the correlation between the name Paxton and Libertarian votes in Wisconsin is no coincidence. It's like a peaceful rebellion led by a legion of Paxton-empowered voters. Or maybe it's just a statistical fluke. Who's to say?
What else correlates?
Popularity of the first name Paxton · all first names
Votes for Libertarian Senators in Wisconsin · all elections
Popularity of the first name Paxton · all first names
Votes for Libertarian Senators in Wisconsin · all elections


View details about correlation #3,553
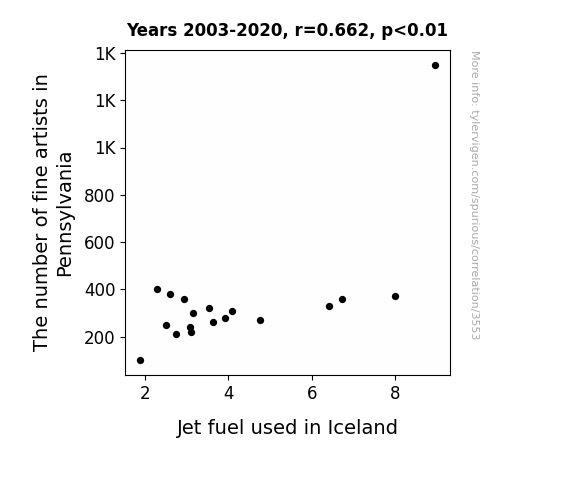
Fine Artists in Pennsylvania and Jet Fuel in Iceland: An Unlikely Connection
As the number of fine artists in Pennsylvania decreased, there was a corresponding decline in demand for intricate, hand-painted aircraft designs. This led to a surplus of unused jet fuel in Iceland, as the planes no longer required as many coats of artistic paint to fly smoothly through the sky. In other words, it seems like the art of flying lost its touch in Pennsylvania, but at least now the skies above Iceland are less fashionably late!
What else correlates?
The number of fine artists in Pennsylvania · all cccupations
Jet fuel used in Iceland · all energy
The number of fine artists in Pennsylvania · all cccupations
Jet fuel used in Iceland · all energy


View details about correlation #1,849
Unbundling the Buns: Unraveling the Interplay between GMO Cotton Cultivation in Mississippi and Nathan's Hot Dog Eating Contest Champion's Consumption
The genetically modified cotton in Mississippi somehow released a pheromone that attracted competitive eaters like a siren song of processed meat. It's a real sausage fest down in the cotton fields!


View details about correlation #4,192
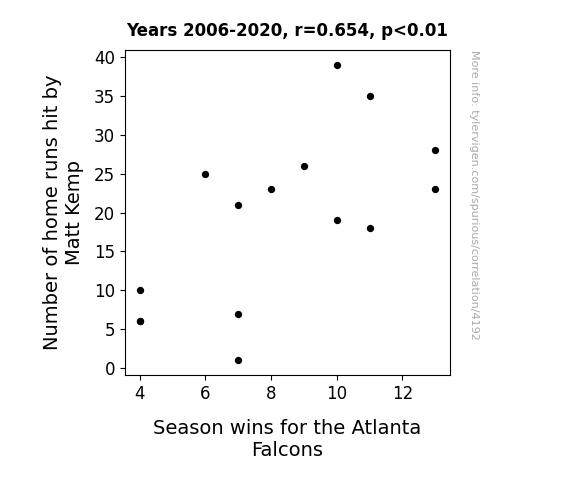
Hitting Home Runs and Falcons' Runs: A Playful Examination of the Correlation between Matt Kemp's Bats and Atlanta's Stats
As Matt Kemp hits more home runs, the gravitational pull of the baseballs affects the airflow over football fields, creating favorable kicking conditions for the Atlanta Falcons.

What else correlates?
Number of home runs hit by Matt Kemp · all sports
Season wins for the Atlanta Falcons · all sports
Number of home runs hit by Matt Kemp · all sports
Season wins for the Atlanta Falcons · all sports
. The chart goes from 2011 to 2023, and the two variables track closely in value over that time.")

View details about correlation #4,299
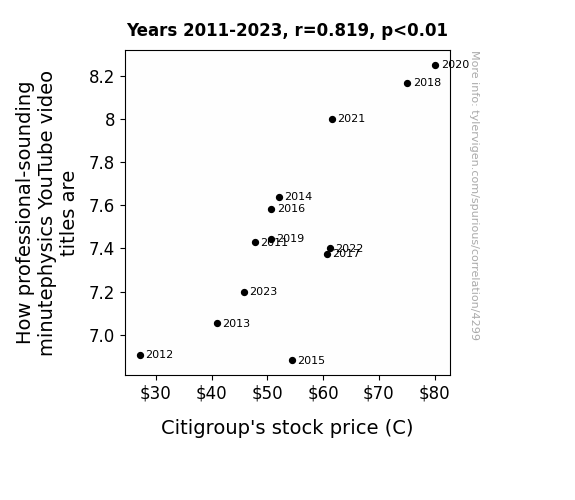
Connecting the Cleverness of YouTube Titles to Citigroup's Stock: A Curious Correlation
The more professional-sounding minutephysics videos there are, the greater the interest in complex financial concepts among Citigroup investors, leading to more informed trading decisions and driving up the stock price. As quantum finance theories collide with conventional banking algorithms, Citi finds itself riding the wave of professionalism, proving once and for all that in the world of finance, every minute counts.

What else correlates?
How professional-sounding minutephysics YouTube video titles are · all YouTube
Citigroup's stock price (C) · all stocks
How professional-sounding minutephysics YouTube video titles are · all YouTube
Citigroup's stock price (C) · all stocks


View details about correlation #3,421
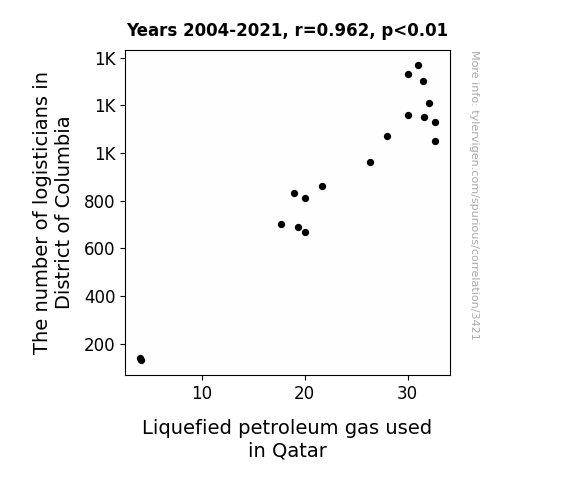
Up in the Air: The Gas-tifying Link Between Logisticians in the District of Columbia and Liquefied Petroleum Gas in Qatar
As the number of logisticians in District of Columbia rises, so does their expert handling of supply chain management. This leads to a surplus of Liquefied Petroleum Puns in the form of well-organized and smoothly delivered gas-related goods. Qatar, catching wind of this, naturally increases their demand for the pun-believable product, creating a gas frenzy and ultimately fueling the need for more Liquefied Petroleum Gas usage. It's a logistical and gas-tastic chain reaction, proving that when it comes to the world of fuel, the delivery of laughs is just as important as the delivery of gas!

What else correlates?
The number of logisticians in District of Columbia · all cccupations
Liquefied petroleum gas used in Qatar · all energy
The number of logisticians in District of Columbia · all cccupations
Liquefied petroleum gas used in Qatar · all energy
Why this works
- Data dredging: I have 25,237 variables in my database. I compare all these variables against each other to find ones that randomly match up. That's 636,906,169 correlation calculations! This is called “data dredging.”
Fun fact: the chart used on the wikipedia page to demonstrate data dredging is also from me. I've been being naughty with data since 2014.
Instead of starting with a hypothesis and testing it, I instead tossed a bunch of data in a blender to see what correlations would shake out. It’s a dangerous way to go about analysis, because any sufficiently large dataset will yield strong correlations completely at random. - Lack of causal connection: There is probably no direct connection between these variables, despite what the AI says above.
Because these pages are automatically generated, it's possible that the two variables you are viewing are in fact causually related. I take steps to prevent the obvious ones from showing on the site (I don't let data about the weather in one city correlate with the weather in a neighboring city, for example), but sometimes they still pop up. If they are related, cool! You found a loophole.
This is exacerbated by the fact that I used "Years" as the base variable. Lots of things happen in a year that are not related to each other! Most studies would use something like "one person" in stead of "one year" to be the "thing" studied. - Observations not independent: For many variables, sequential years are not independent of each other. You will often see trend-lines form. If a population of people is continuously doing something every day, there is no reason to think they would suddenly change how they are doing that thing on January 1. A naive p-value calculation does not take this into account.
You will calculate a lower chance of "randomly" achieving the result than represents reality.
To be more specific: p-value tests are probability values, where you are calculating the probability of achieving a result at least as extreme as you found completely by chance. When calculating a p-value, you need to assert how many "degrees of freedom" your variable has. I count each year (minus one) as a "degree of freedom," but this is misleading for continuous variables.
This kind of thing can creep up on you pretty easily when using p-values, which is why it's best to take it as "one of many" inputs that help you assess the results of your analysis.
- Y-axes doesn't start at zero: I truncated the Y-axes of the graphs above. I also used a line graph, which makes the visual connection stand out more than it deserves.
Nothing against line graphs. They are great at telling a story when you have linear data! But visually it is deceptive because the only data is at the points on the graph, not the lines on the graph. In between each point, the data could have been doing anything. Like going for a random walk by itself!
Mathematically what I showed is true, but it is intentionally misleading. If you click on any of the charts that abuse this, you can scroll down to see a version that starts at zero. - Confounding variable: Confounding variables (like global pandemics) will cause two variables to look connected when in fact a "sneaky third" variable is influencing both of them behind the scenes.
- Outliers: Some datasets here have outliers which drag up the correlation.
In concept, "outlier" just means "way different than the rest of your dataset." When calculating a correlation like this, they are particularly impactful because a single outlier can substantially increase your correlation.
Because this page is automatically generated, I don't know whether any of the charts displayed on it have outliers. I'm just a footnote. ¯\_(ツ)_/¯
I intentionally mishandeled outliers, which makes the correlation look extra strong. - Low n: There are not many data points included in some of these charts.
You can do analyses with low ns! But you shouldn't data dredge with a low n.
Even if the p-value is high, we should be suspicious of using so few datapoints in a correlation.
Pro-tip: click on any correlation to see:
- Detailed data sources
- Prompts for the AI-generated content
- Explanations of each of the calculations (correlation, p-value)
- Python code to calculate it yourself


