spurious correlations
discover · random · spurious scholar
← previous page · next page →
. The chart goes from 2002 to 2022, and the two variables track closely in value over that time.")

View details about correlation #3,808
The Stock Price Link to Name Fame: How Sadie's Popularity Affects WMB Game
As the name Sadie gained popularity, more and more people were drawn to the character of 'Sadie the Stock Saver,' a fictional investor with a knack for picking winning stocks. This led to a surge in interest in investing, and as a result, The Williams Companies' stock price experienced a 'WMB' (Winning More Bucks) situation.


What else correlates?
Popularity of the first name Sadie · all first names
The Williams Companies' stock price (WMB) · all stocks
Popularity of the first name Sadie · all first names
The Williams Companies' stock price (WMB) · all stocks


View details about correlation #1,749
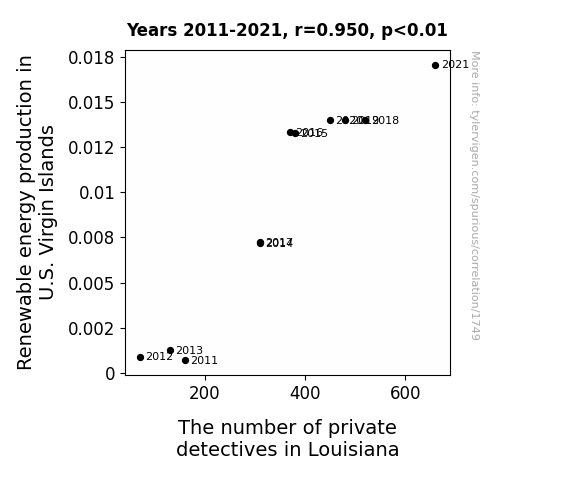
Shocking Connections: Renewable Energy in U.S. Virgin Islands and the Sleuth Surge in Louisiana
As the U.S. Virgin Islands embraced renewable energy, it inadvertently led to an influx of new, high-tech equipment. This surplus of tech found its way to Louisiana, where private detectives, always on the cutting edge of surveillance, eagerly adopted and repurposed the renewable energy technology for their sleuthing needs. Suddenly, solar-powered stakeouts and wind turbine hidden cameras became the latest craze in the world of private investigation, creating an unprecedented demand for private detectives in Louisiana. Who knew that the sun and wind would become the new best friends of gumshoes in the Bayou state? It's a renewable energy revolution that's truly a-mystery to behold!


View details about correlation #3,995
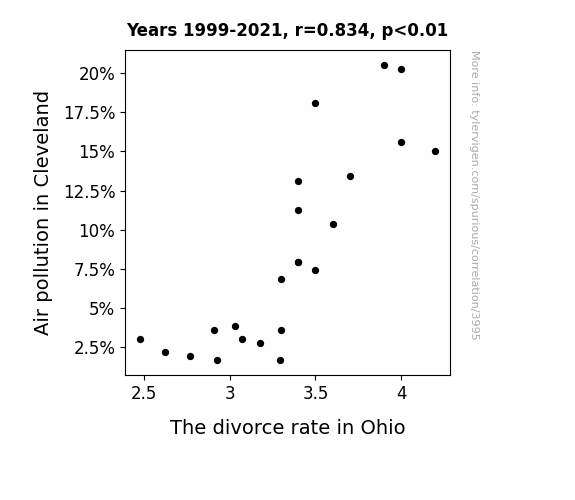
Particulate Breakup: Exploring the Relationship Between Air Pollution and Divorce Rates in Ohio
As the smog lifted, so did the marital fog. With cleaner air, it was easier for couples to breathe and mend their relationship instead of gasping for a breath of fresh AIRE. The spark of romance was no longer being extinguished by the smoky atmosphere, leading to a reduction in heated arguments. It seems like love wasn't the only thing in the air - there was also a clear correlation between a cleaner environment and happier marriages.

What else correlates?
Air pollution in Cleveland · all weather
The divorce rate in Ohio · all random state specific
Air pollution in Cleveland · all weather
The divorce rate in Ohio · all random state specific


View details about correlation #4,456
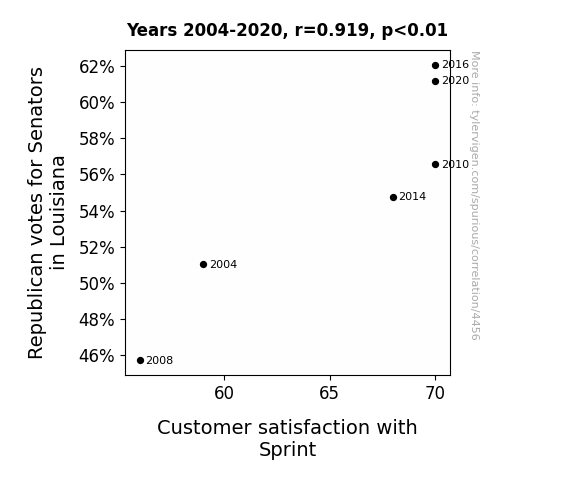
Calling Senators and Sprinting to Votes: A Correlative Examination of Republican Voting Patterns in Louisiana and Sprint Customer Satisfaction
The Republican Senators in Louisiana must have boosted the signals for Sprint, leading to a stronger reception of customer satisfaction! It looks like their political power was just the boost Sprint needed to win over more voters!

What else correlates?
Votes for Republican Senators in Louisiana · all elections
Customer satisfaction with Sprint · all weird & wacky
Votes for Republican Senators in Louisiana · all elections
Customer satisfaction with Sprint · all weird & wacky
. The chart goes from 2002 to 2022, and the two variables track closely in value over that time.")

View details about correlation #3,811
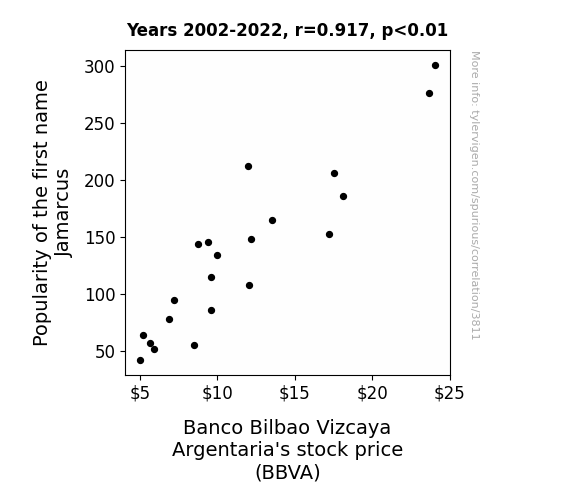
Jamarcus Jackpots and Banco Bilbao Vizcaya Argentaria's Bucks: Exploring the Connection
People named Jamarcus tend to be unusually avid investors in Banco Bilbao Vizcaya Argentaria, and as the number of Jamarcus-es dwindles, so does the demand for BBVA stock, leading to a decrease in its price. Nowadays, it seems like it's not just Jamarcus's popularity that's tanking, but also BBVA's stock price!

What else correlates?
Popularity of the first name Jamarcus · all first names
Banco Bilbao Vizcaya Argentaria's stock price (BBVA) · all stocks
Popularity of the first name Jamarcus · all first names
Banco Bilbao Vizcaya Argentaria's stock price (BBVA) · all stocks


View details about correlation #3,083
Lost in Translation: Exploring the Unlikely Link Between Interpreters and Translators in New Hampshire and Gasoline Pumped in Suriname
As the demand for interpreters and translators in New Hampshire rose, so did the need for international business dealings. This led to an unexpected surge in Surinamese gasoline imports, as fluent speakers of Surinamese languages facilitated lucrative trade agreements. Who knew that multilingual skills could fuel such a unique and specific economic connection?
What else correlates?
The number of interpreters and translators in New Hampshire · all cccupations
Gasoline pumped in Suriname · all energy
The number of interpreters and translators in New Hampshire · all cccupations
Gasoline pumped in Suriname · all energy


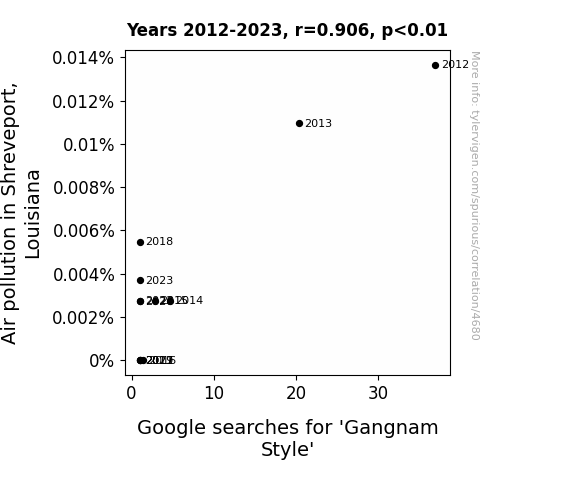
View details about correlation #4,680
Gasping for Air or Grooving for Gangnam: A Statistical Analysis of the Relationship between Air Pollution in Shreveport, Louisiana and Google Searches for 'Gangnam Style'
As the air got cleaner in Shreveport, people had less need to 'oppan air pollution style' and were able to 'breathe easy' instead of busting out the Gangnam moves. The correlation seems to suggest that as the smog cleared, so did the craze for this K-pop hit. It's like the atmosphere said, "Hey, sexy pollutant, get out!"

What else correlates?
Air pollution in Shreveport, Louisiana · all weather
Google searches for 'Gangnam Style' · all google searches
Air pollution in Shreveport, Louisiana · all weather
Google searches for 'Gangnam Style' · all google searches


View details about correlation #3,993
Days of Our Crimes: Unraveling the Link Between New Mexico Burglaries and Days of Our Lives Viewership
As burglaries in New Mexico decreased, it led to a surplus of spare time for the residents. This unexpected surplus of time prompted a shift in daily routines, including a decline in midday television viewing. As a result, the viewership count for Days of Our Lives experienced a dip, proving that even the most unexpected factors can influence TV watching habits.


What else correlates?
Burglaries in New Mexico · all random state specific
Viewership count for Days of Our Lives · all weird & wacky
Burglaries in New Mexico · all random state specific
Viewership count for Days of Our Lives · all weird & wacky


View details about correlation #4,847
Alices Adore Alternatives: Analyzing the Association Between Alice's Antics and Libertarian Loyalties in New York
As the name Alice gained more popularity, people couldn't help but wonder, "Who is leading a wonderland-esque political campaign?" This curiosity led them to discover the Libertarian candidate, creating a ripple effect of support. It seems like the idea of casting their political beliefs down the rabbit hole really resonated with the newly-Alice-named supporters. Who would have thought that a shift in popularity could lead to such electoral madness?


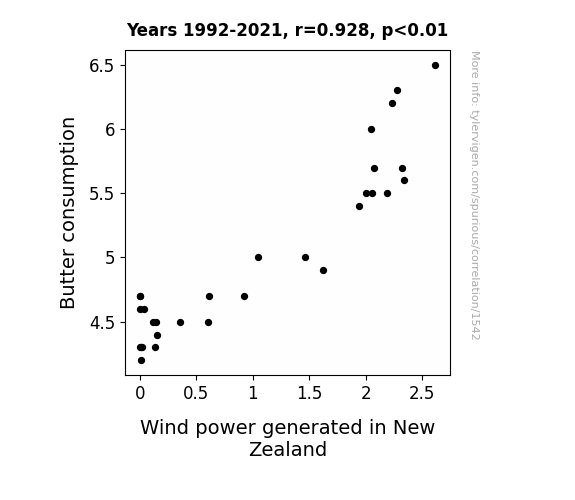
View details about correlation #1,542
Spreading the Wind: A Butterly Connection between Consumption and Generation in New Zealand
As butter consumption increased, people became more gaseous, leading to an uptick in wind power in New Zealand as a result of the increased flatulence levels. It's a case of dairy air leading to a surge in renewable energy!

What else correlates?
Butter consumption · all food
Wind power generated in New Zealand · all energy
Butter consumption · all food
Wind power generated in New Zealand · all energy


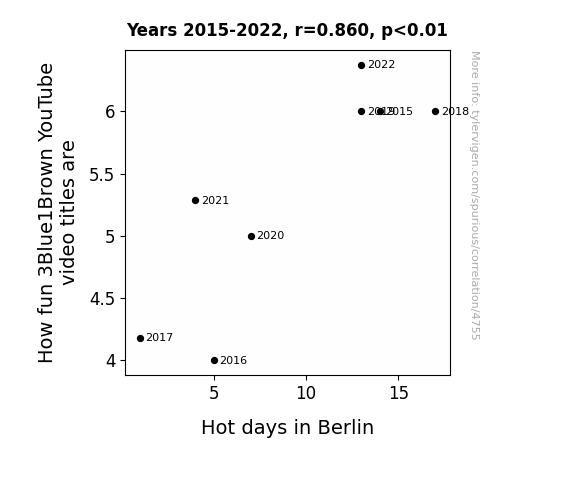
View details about correlation #4,755
The Sunny Side of Math: A Bright Relationship Between 3Blue1Brown Video Titles and Hot Days in Berlin
The hotter it gets in Berlin, the more people seek indoor refuge, where they stumble upon 3Blue1Brown videos. The mind-bending math concepts are like a mental AC, making the heat more bearable. As a result, the fun factor of the video titles is cranked up to match the rising temperatures, creating a sizzling demand for enjoyable and educational content. It's a calculus of cooling off with captivating concepts, leading to a summertime surge in 3Blue1Brown video enjoyment.

What else correlates?
How fun 3Blue1Brown YouTube video titles are · all YouTube
Hot days in Berlin · all weather
How fun 3Blue1Brown YouTube video titles are · all YouTube
Hot days in Berlin · all weather
. The chart goes from 2002 to 2022, and the two variables track closely in value over that time.")

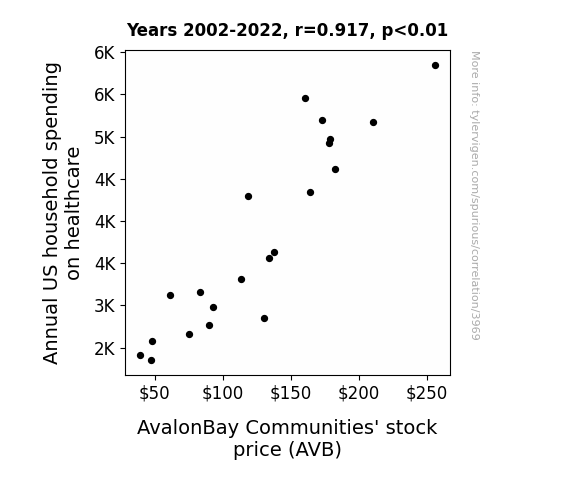
View details about correlation #3,969
Healthy Investments: The Correlation Between Annual US Household Healthcare Spending and AvalonBay Communities' Stock Price
As household spending on healthcare rises, more people become interested in healthy living. This leads to a surge in demand for homes with amenities like gyms and outdoor spaces, causing AvalonBay Communities' stock price to soar. After all, a house with a built-in hospital bed is the new American dream!

What else correlates?
Annual US household spending on healthcare · all weird & wacky
AvalonBay Communities' stock price (AVB) · all stocks
Annual US household spending on healthcare · all weird & wacky
AvalonBay Communities' stock price (AVB) · all stocks


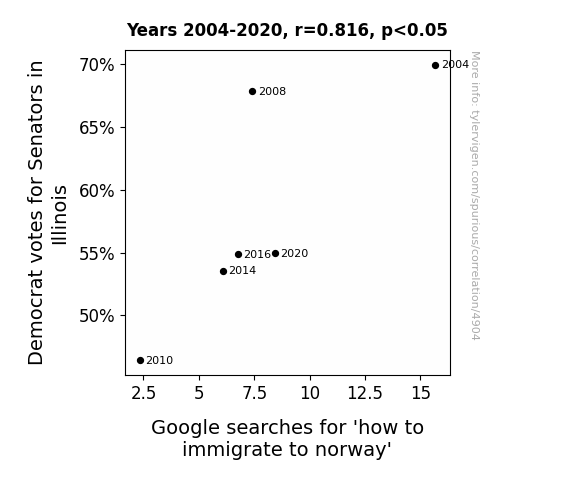
View details about correlation #4,904
The Left Leaps: Exploring the Link between Democratic Sentiments in Illinois and Curious Google Searches for Nordic Immigration
It seems that as the Democratic votes for Senators in Illinois decreased, so did the desirability to navigate to Norway! It's like they say, as Illinois goes, so goes the nation -- and apparently, potentially to a Scandinavian destination as well! The political shift must have created a 'Nordic knock-on effect,' leading some to reconsider their international relocation plans. Who knew there was a direct link between Illinois politics and the allure of fjords and Northern lights? It's a real 'Senatorial Snowball Effect' on transatlantic travel intentions!


View details about correlation #3,363
Microbiologists and Nukes: Illinois Strikes, Iran Reacts
As the number of microbiologists in Illinois grows, so does their love for deep dish pizza. This leads to a spike in demand for mozzarella cheese. To meet this demand, dairy farms across the country ramp up production, inadvertently increasing the need for electricity to power their operations. Unbeknownst to them, this surge in power usage ends up indirectly boosting the nuclear power generation in Iran through a complex series of international energy exchanges and power grid connections. It's a gouda example of how cheese, scientists, and nuclear power can all be interconnected in a wheely bizarre way!
What else correlates?
The number of microbiologists in Illinois · all cccupations
Nuclear power generation in Iran · all energy
The number of microbiologists in Illinois · all cccupations
Nuclear power generation in Iran · all energy


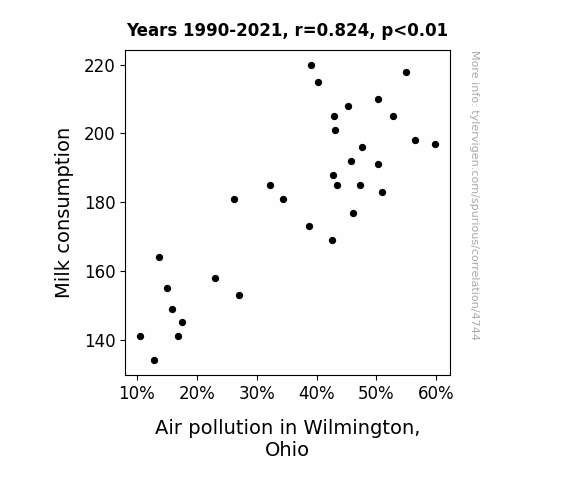
View details about correlation #4,744
Milky Whey: Exploring the Udderly Surprising Link Between Milk Consumption and Air Pollution in Wilmington, Ohio
As people drank less milk, there was a decrease in dairy flatulence, leading to a reduction in methane gas emissions. This ultimately contributed to an improvement in air quality in Wilmington, Ohio.

What else correlates?
Milk consumption · all food
Air pollution in Wilmington, Ohio · all weather
Milk consumption · all food
Air pollution in Wilmington, Ohio · all weather


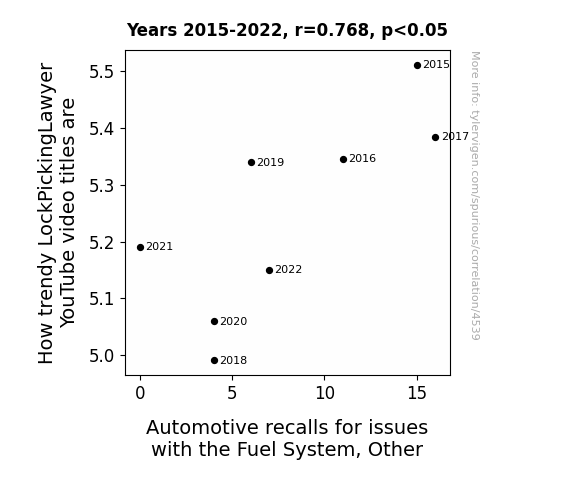
View details about correlation #4,539
LockPickingLaws and Fuel Flaws: An Unconventional Connection Between YouTube Title Trends and Automotive Recalls
As the LockPickingLawyer's YouTube video titles become less trendy, there's a corresponding decrease in automotive recalls for fuel system and other issues because it turns out that the cars were just trying to stay on brand. They didn't want to be outshone by the latest lock-picking trends, so they decided to behave themselves and not make a spectacle of their own malfunctioning antics. It seems like even vehicles have a strong need for external validation and a fear of being seen as outdated!

. The chart goes from 2002 to 2022, and the two variables track closely in value over that time.")

View details about correlation #3,839
Name Game: The Maeve Effect on TSM Stock Price
As the name Maeve gained popularity, more parents were inspired by the Celtic heritage and unique sound. This led to a surge in demand for baby name consultation services, causing a shortage in consultants. To cope with the shortage, these consultants turned to advanced technology for efficiency, increasing their reliance on electronic devices. This unexpected demand for electronics prompted a sudden need for semiconductor chips, with Taiwan Semiconductor Manufacturing Company (TSM) being a key supplier. The ripple effect of the Maeve naming trend ultimately contributed to TSM's stock price increase. Remember, while this connection may seem far-fetched, in the world of stock prices, even the most unexpected factors can play a role!


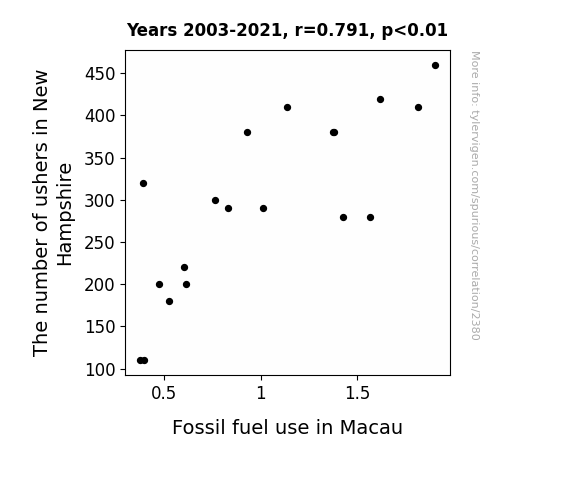
View details about correlation #2,380
Ushers in New Hampshire and Unearthing Unusual Urban Usage: Unraveling the Unconventional Undertakings
As the number of ushers in New Hampshire dwindled, there was a corresponding decline in theatre attendance. With fewer people traveling to the theatre, there was a slight but noticeable reduction in overall fuel consumption. This unexpected connection led to a ripple effect, ultimately impacting the demand for fossil fuels in the bustling city of Macau. It seems the actions of ushers in one corner of the world can reach all the way to a distant land, highlighting the truly interconnected nature of our global energy usage. Who would have thought that ushers in New Hampshire held the key to environmental change in Macau? It's a tale of dwindling ushers leading to a fueling mystery of dramatic proportions! Remember, the next time you attend a play, the fate of fossil fuel use in a far-off city might just depend on the ushers you encounter.

What else correlates?
The number of ushers in New Hampshire · all cccupations
Fossil fuel use in Macau · all energy
The number of ushers in New Hampshire · all cccupations
Fossil fuel use in Macau · all energy


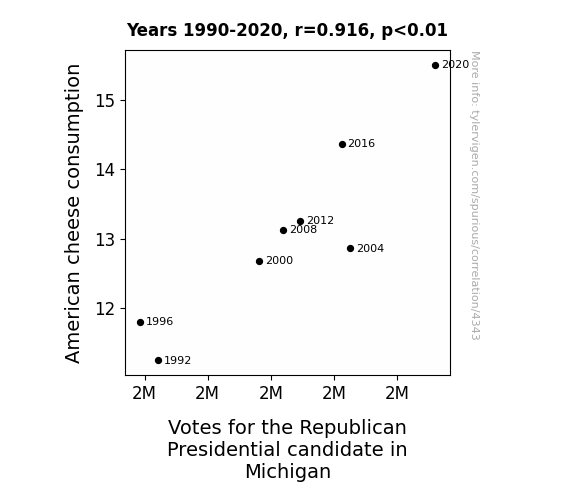
View details about correlation #4,343
The Cheddar Vote: American Cheese Consumption and Republican Candidate Preference in Michigan
As American cheese consumption goes up, so does the nation's level of cheesy puns and jokes. This extra cheesiness leads to a gouda mood overall, prompting people to brie more lighthearted and provolone in their interactions. As a result, when it comes time to cast their ballots, they may feel feta about the candidate who promises to bring the most cheddar to the table. So, it's not just a queso coincidence that as American cheese consumption rises, so does support for the Republican Presidential candidate in Michigan. After all, in the land of the free, home of the brave, and kingdom of cheese, anything is nacho-sible!

What else correlates?
American cheese consumption · all food
Votes for the Republican Presidential candidate in Michigan · all elections
American cheese consumption · all food
Votes for the Republican Presidential candidate in Michigan · all elections


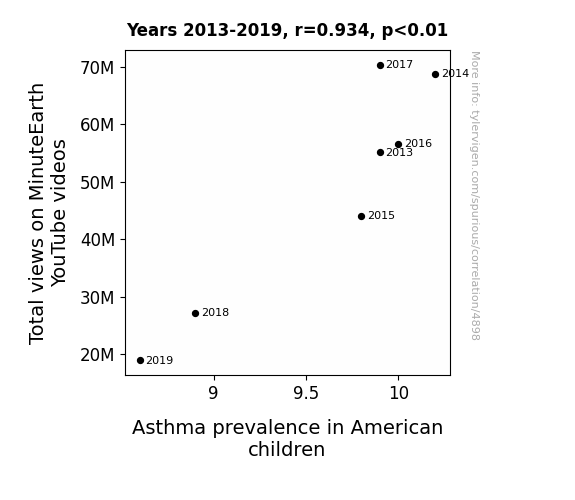
View details about correlation #4,898
Breathing Easy or Wheezy: A Wheely Asthmatic Look at MinuteEarth YouTube Views and Pediatric Asthma Prevalence
MinuteEarth's videos were so informative and captivating that kids were too busy watching and learning to go outside and encounter asthma triggers. The power of educational entertainment strikes again!

What else correlates?
Total views on MinuteEarth YouTube videos · all YouTube
Asthma prevalence in American children · all weird & wacky
Total views on MinuteEarth YouTube videos · all YouTube
Asthma prevalence in American children · all weird & wacky
Why this works
- Data dredging: I have 25,237 variables in my database. I compare all these variables against each other to find ones that randomly match up. That's 636,906,169 correlation calculations! This is called “data dredging.”
Fun fact: the chart used on the wikipedia page to demonstrate data dredging is also from me. I've been being naughty with data since 2014.
Instead of starting with a hypothesis and testing it, I instead tossed a bunch of data in a blender to see what correlations would shake out. It’s a dangerous way to go about analysis, because any sufficiently large dataset will yield strong correlations completely at random. - Lack of causal connection: There is probably no direct connection between these variables, despite what the AI says above.
Because these pages are automatically generated, it's possible that the two variables you are viewing are in fact causually related. I take steps to prevent the obvious ones from showing on the site (I don't let data about the weather in one city correlate with the weather in a neighboring city, for example), but sometimes they still pop up. If they are related, cool! You found a loophole.
This is exacerbated by the fact that I used "Years" as the base variable. Lots of things happen in a year that are not related to each other! Most studies would use something like "one person" in stead of "one year" to be the "thing" studied. - Observations not independent: For many variables, sequential years are not independent of each other. You will often see trend-lines form. If a population of people is continuously doing something every day, there is no reason to think they would suddenly change how they are doing that thing on January 1. A naive p-value calculation does not take this into account.
You will calculate a lower chance of "randomly" achieving the result than represents reality.
To be more specific: p-value tests are probability values, where you are calculating the probability of achieving a result at least as extreme as you found completely by chance. When calculating a p-value, you need to assert how many "degrees of freedom" your variable has. I count each year (minus one) as a "degree of freedom," but this is misleading for continuous variables.
This kind of thing can creep up on you pretty easily when using p-values, which is why it's best to take it as "one of many" inputs that help you assess the results of your analysis.
- Y-axes doesn't start at zero: I truncated the Y-axes of the graphs above. I also used a line graph, which makes the visual connection stand out more than it deserves.
Nothing against line graphs. They are great at telling a story when you have linear data! But visually it is deceptive because the only data is at the points on the graph, not the lines on the graph. In between each point, the data could have been doing anything. Like going for a random walk by itself!
Mathematically what I showed is true, but it is intentionally misleading. If you click on any of the charts that abuse this, you can scroll down to see a version that starts at zero. - Confounding variable: Confounding variables (like global pandemics) will cause two variables to look connected when in fact a "sneaky third" variable is influencing both of them behind the scenes.
- Outliers: Some datasets here have outliers which drag up the correlation.
In concept, "outlier" just means "way different than the rest of your dataset." When calculating a correlation like this, they are particularly impactful because a single outlier can substantially increase your correlation.
Because this page is automatically generated, I don't know whether any of the charts displayed on it have outliers. I'm just a footnote. ¯\_(ツ)_/¯
I intentionally mishandeled outliers, which makes the correlation look extra strong. - Low n: There are not many data points included in some of these charts.
You can do analyses with low ns! But you shouldn't data dredge with a low n.
Even if the p-value is high, we should be suspicious of using so few datapoints in a correlation.
Pro-tip: click on any correlation to see:
- Detailed data sources
- Prompts for the AI-generated content
- Explanations of each of the calculations (correlation, p-value)
- Python code to calculate it yourself


