spurious correlations
discover · random · spurious scholar
← previous page · next page →


View details about correlation #1,991
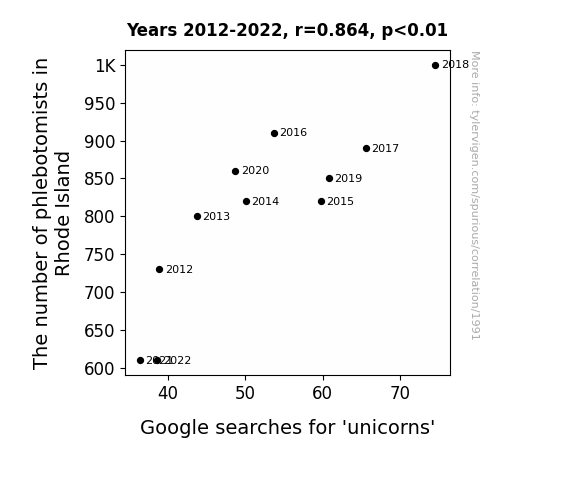
The Delightful Plight: The Flight of Phlebotomists and Unicorns in Rhode Island
As the number of phlebotomists in Rhode Island decreased, there was a corresponding decline in the availability of sparkly, unicorn-esque veins to draw blood from. This led to a shortage of unicorn-inspired art and products, ultimately dampening people's interest in searching for unicorns on Google. It's a classic case of mystical creature mojo being unwittingly linked to the noble profession of drawing blood!

What else correlates?
The number of phlebotomists in Rhode Island · all cccupations
Google searches for 'unicorns' · all google searches
The number of phlebotomists in Rhode Island · all cccupations
Google searches for 'unicorns' · all google searches


View details about correlation #2,667
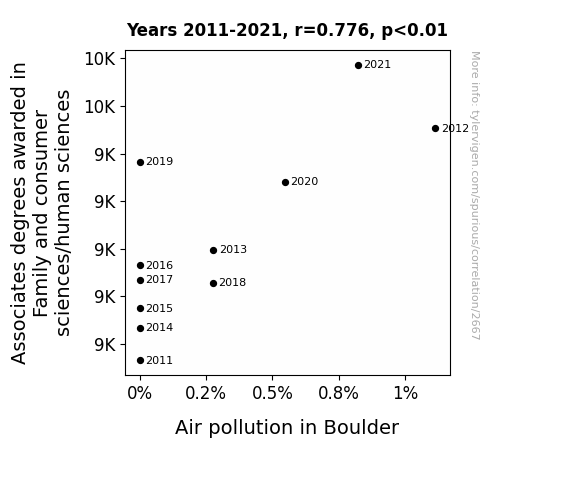
Degrees of Separation: Exploring the Link Between Family and Consumer Sciences/Human Sciences Associate Degrees and Air Pollution in Boulder
As more people became knowledgeable about efficient home management and wanted to show off their cooking skills, there was a sudden spike in the use of kitchen gadgets and appliances in Boulder. This led to a peculiar phenomenon where the once pristine Boulder air was now filled with the aromatic mists of sizzling stir-fries and baking experiments gone awry. It was a classic case of too many chefs (with Associates degrees in Family and consumer sciences/human sciences) spoiling the air in Boulder!

What else correlates?
Associates degrees awarded in consumer sciences · all education
Air pollution in Boulder · all weather
Associates degrees awarded in consumer sciences · all education
Air pollution in Boulder · all weather


View details about correlation #1,320
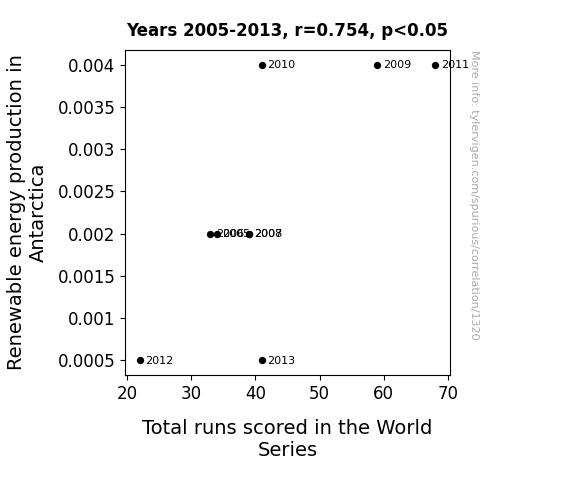
Antarctic Alternative Energy and World Series Winning Runs: A Curious Correlation
The penguins' dancing created a distracting spectacle for the baseball players, leading to fewer runs being scored.

What else correlates?
Renewable energy production in Antarctica · all energy
Total runs scored in the World Series · all sports
Renewable energy production in Antarctica · all energy
Total runs scored in the World Series · all sports
. The chart goes from 2010 to 2022, and the two variables track closely in value over that time.")

View details about correlation #2,235
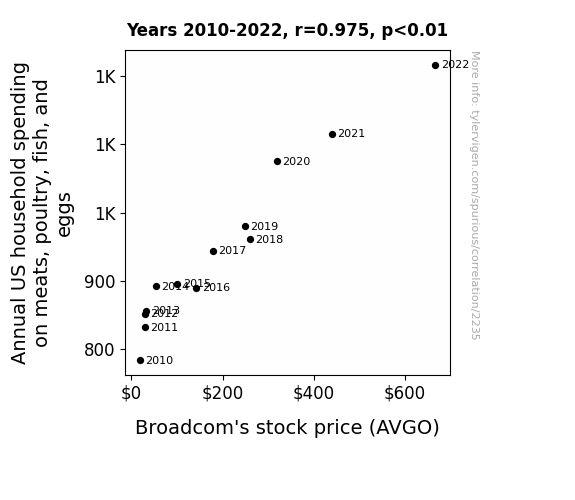
How Do Meaty Trends Affect Stock Prices? A Clucking Good Look at the Relationship Between Annual US Household Spending on Animal Products and Broadcom's Stock Price
As households invested more in protein-packed options, they unknowingly bolstered the demand for high-tech meat processing equipment. This surge in demand for efficient meat production technology directly benefited Broadcom, which just so happens to be a leading provider of advanced semiconductors used in automated food processing systems. It's a classic case of the stock market sizzling in response to the unexpected synergy between household grocery habits and the semiconductor industry!


View details about correlation #1,909
The Liana Legacy: Lighthearted Look at Liana's Impact on Phlebotomists
As the name Liana gained popularity, more parents were inspired by the idea of their children pursuing careers in the medical field. This led to a sudden surge in young phlebotomists-in-training in West Virginia, all eager to *draw* attention to their skills. It seems like the name Liana didn't just have a nice ring to it, but also a strong *bloodline* connection to the healthcare industry in the mountain state!


What else correlates?
Popularity of the first name Liana · all first names
The number of phlebotomists in West Virginia · all cccupations
Popularity of the first name Liana · all first names
The number of phlebotomists in West Virginia · all cccupations


View details about correlation #3,415
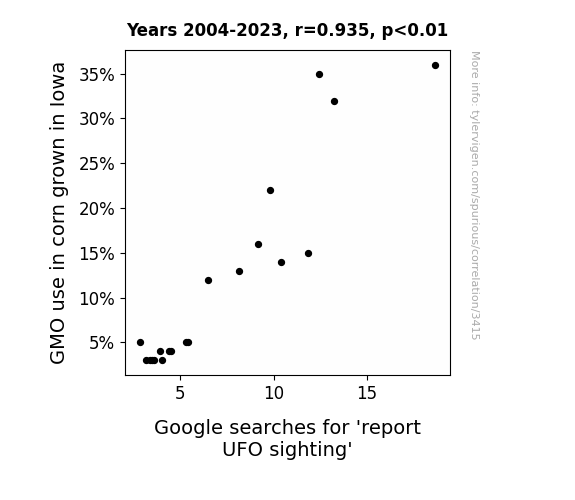
GMO or UFO: Exploring the Corny Connection Between Genetically Modified Corn and Searches for UFO Sightings in Iowa
As Iowa farmers switched to non-GMO corn, they unknowingly stopped growing crops that emitted a frequency previously used to communicate with the intergalactic corn-loving community. With the GMO corn no longer around to broadcast their invitations for a cosmic corn feast, the UFOs had to sadly bypass Iowa, leading to a nationwide dip in reported sightings. It turns out, our alien friends were just a-maize-d with GMO corn!

What else correlates?
GMO use in corn grown in Iowa · all food
Google searches for 'report UFO sighting' · all random state specific
GMO use in corn grown in Iowa · all food
Google searches for 'report UFO sighting' · all random state specific


View details about correlation #2,012
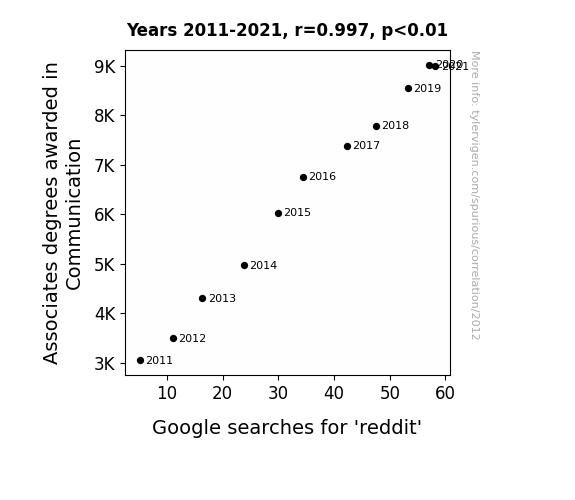
Communicative Credentials and Curious Clicks: An Analysis of Associates Degrees in Communication and Reddit Searches
As more people honed their communication skills, they realized they had a lot to say, and turned to platforms like Reddit to share their thoughts with the world. This led to a surge in Reddit activity, as the newly minted communication experts engaged in passionate discussions, pun-filled threads, and viral-worthy posts. It's like a ripple effect of verbosity - the more the merrier on Reddit!

What else correlates?
Associates degrees awarded in Communication · all education
Google searches for 'reddit' · all google searches
Associates degrees awarded in Communication · all education
Google searches for 'reddit' · all google searches


View details about correlation #1,387
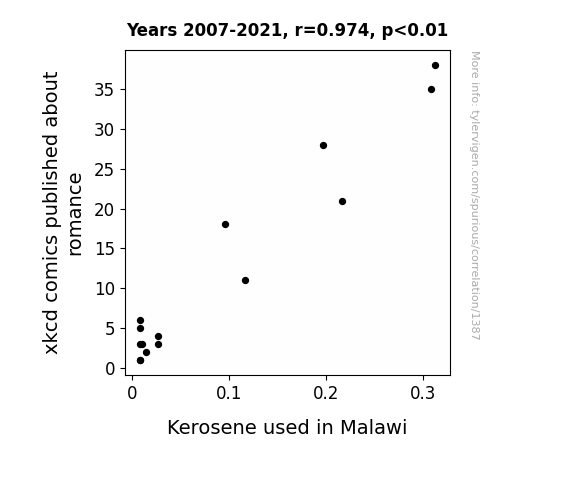
Sparks Flying: Exploring the Correlation Between xkcd Comics on Romance and Kerosene Consumption in Malawi
As xkcd romance comics decreased, fewer people were inspired to pursue grand romantic gestures. This led to a decrease in the demand for hot air balloon rides, a popular choice for wooing in Malawi. With less need for hot air balloon fuel, the kerosene usage in Malawi naturally decreased. Who knew that matters of the heart could affect fuel consumption in such an uplifting way!

What else correlates?
xkcd comics published about romance · all weird & wacky
Kerosene used in Malawi · all energy
xkcd comics published about romance · all weird & wacky
Kerosene used in Malawi · all energy
. The chart goes from 2002 to 2022, and the two variables track closely in value over that time.")

View details about correlation #2,295
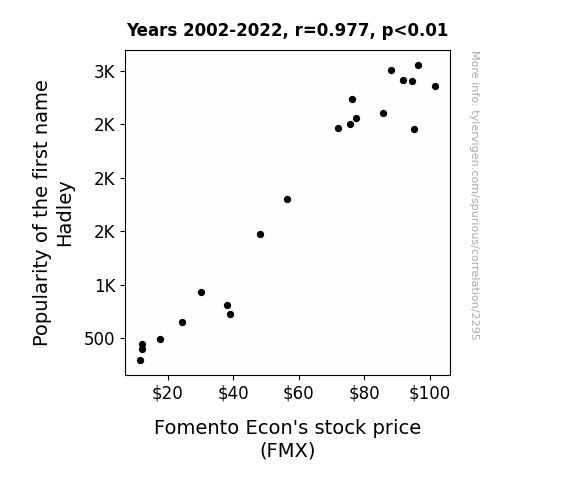
Hadley or Not, Here We Fomento Econ: Exploring the Stock Price Name-game Connection
Hadleys are known for their impeccable taste in investment opportunities, particularly in the beverage sector. This led to a surge in demand for Fomento Econ's products, boosting their overall profitability and subsequently, their stock price. It's like the Hadley name is a stamp of approval for success, one bubbly stock at a time.

What else correlates?
Popularity of the first name Hadley · all first names
Fomento Econ's stock price (FMX) · all stocks
Popularity of the first name Hadley · all first names
Fomento Econ's stock price (FMX) · all stocks


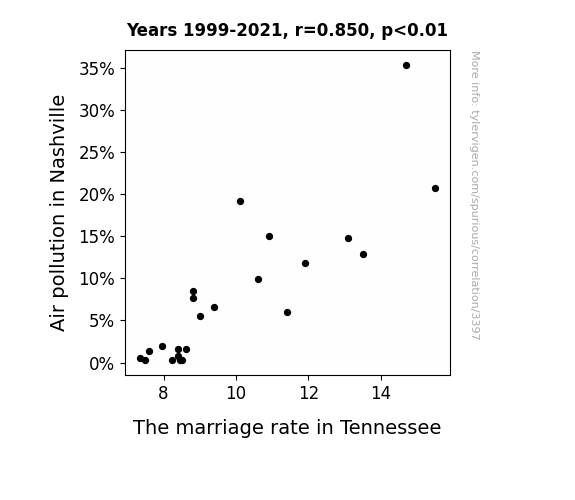
View details about correlation #3,397
Taking the Plunge: The Wheezing Unseen—Air Pollution's Impact on Marital Bliss in Tennessee
As air quality improved, people could finally see things clearly, including the faults in their relationships. The smog couldn't hide the problems anymore, leading to a breath of fresh single air. Remember, love may be blind, but clean air has 20/20 vision!

What else correlates?
Air pollution in Nashville · all weather
The marriage rate in Tennessee · all random state specific
Air pollution in Nashville · all weather
The marriage rate in Tennessee · all random state specific


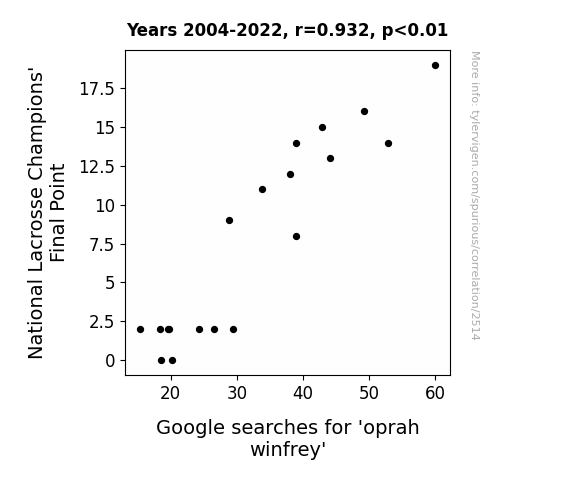
View details about correlation #2,514
Stick Tricks or TV Flicks: Exploring the Correlation Between National Lacrosse Champions' Final Point and Google Searches for 'Oprah Winfrey'
It seems that as the lacrosse teams' final points decreased, so did Oprah's interest points. It's like they say, when it comes to scoring, both on the field and in TV ratings, every point Oprah-n-t!

What else correlates?
National Lacrosse Champions' Final Point · all sports
Google searches for 'oprah winfrey' · all google searches
National Lacrosse Champions' Final Point · all sports
Google searches for 'oprah winfrey' · all google searches


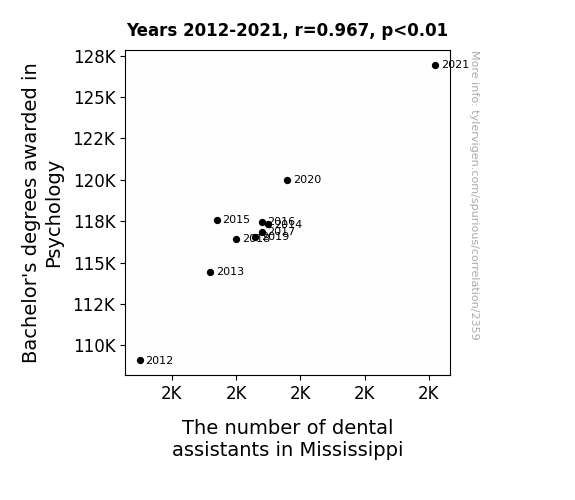
View details about correlation #2,359
The Psy-Dent Factor: An Examination of the Correlation Between Bachelor's Degrees in Psychology and the Number of Dental Assistants in Mississippi
As more people pursued psychology degrees, it created a higher demand for therapists. To cope with the stress of dealing with so many psychology graduates, people in Mississippi started grinding their teeth more, leading to a greater need for dental assistants to handle all the resulting dental issues. It's a vicious cycle of overanalyzing and over-flossing!

What else correlates?
Bachelor's degrees awarded in Psychology · all education
The number of dental assistants in Mississippi · all cccupations
Bachelor's degrees awarded in Psychology · all education
The number of dental assistants in Mississippi · all cccupations


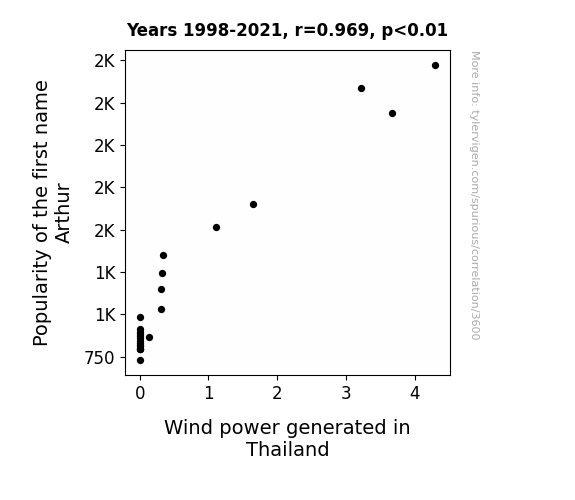
View details about correlation #3,600
Blowin' in the Arthur: A Correlational Study of the Popularity of the Name Arthur and Wind Power Generation in Thailand
As the name Arthur gained popularity, more people began referencing the legendary tale of King Arthur and the quest for the Holy Grail. This resurgence in interest led to a spike in sword production, creating a higher demand for steel. This, in turn, prompted Thailand to ramp up its wind power generation to meet the growing need for electricity in the global steel industry. After all, it's no coincidence that the legendary sword Excalibur was said to have been forged with otherworldly powers - clearly, Thailand saw the potential for a new era of renewable energy with a touch of Arthurian legend!

What else correlates?
Popularity of the first name Arthur · all first names
Wind power generated in Thailand · all energy
Popularity of the first name Arthur · all first names
Wind power generated in Thailand · all energy


View details about correlation #1,453
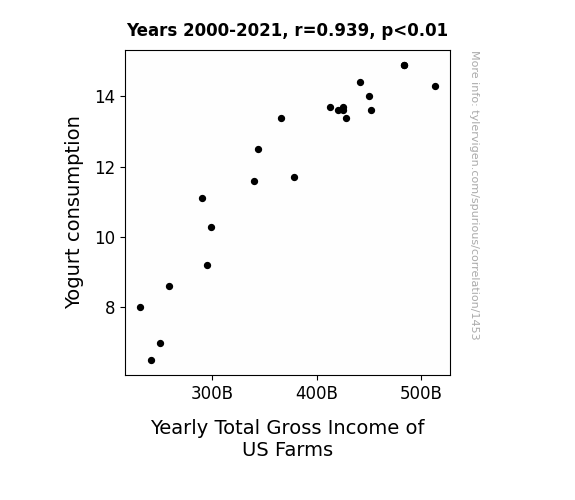
The Culture of Yogurt: Exploring the Wheyward Connection Between Yogurt Consumption and US Farm Income
The probiotic bacteria in yogurt formed a secret alliance with the crops, leading to a bumper harvest and increased farm income.

What else correlates?
Yogurt consumption · all food
Yearly Total Gross Income of US Farms · all food
Yogurt consumption · all food
Yearly Total Gross Income of US Farms · all food
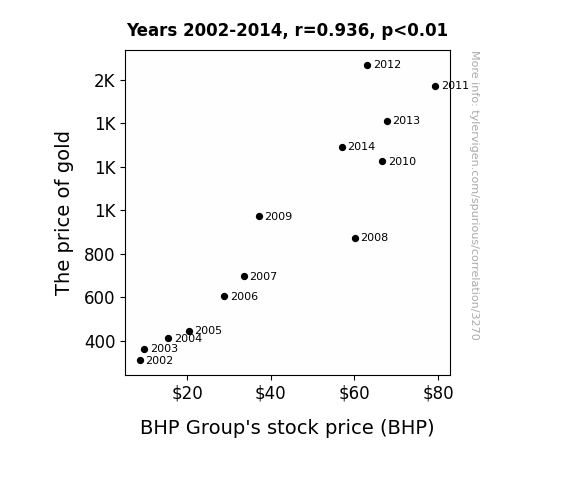
. The chart goes from 2002 to 2014, and the two variables track closely in value over that time.")

View details about correlation #3,270
Golden Gains: Gauging the Gold and BHP Group's Stock Price
As the price of gold goes up, more people turn to gold as a form of bling. It's simple really - as consumers bedazzle themselves with gold chains and grills, there is a sudden spike in demand for mirrors to admire their new look. Now, BHP just happens to be a major supplier of the raw materials needed to make high-quality mirrors. So, as the quest for gold bling continues to drive up the price of gold, BHP is reflecting on the shiny profits to be made in the mirror business, leading to an increase in their stock price. After all, it's all about that golden opportunity for BHP to mirror the success of the bling industry!

What else correlates?
The price of gold · all weird & wacky
BHP Group's stock price (BHP) · all stocks
The price of gold · all weird & wacky
BHP Group's stock price (BHP) · all stocks


View details about correlation #2,664
Build a Bridge and Get over It: The Surprising Link between Bachelor's Degrees in Transportation and Materials Moving and the Number of Building Inspectors in Nebraska
As more transportation and materials moving experts acquired their Bachelor's degrees, they gained a deeper understanding of the importance of structurally sound buildings. This led to a surge in demand for building inspectors in Nebraska, as the newly minted transportation degree holders couldn't help but assess the integrity of every building they encountered, creating a quirky domino effect in the world of infrastructure.


View details about correlation #1,429
The Thin Air Between Them: Exploring the Relationship Between Air Pollution in Somerset, Pennsylvania and Violent Crime Rates
Cleaner air led to clearer heads. As the smog lifted, so did the tension. It seems like when the air was cleaner, the residents were just too 'ozone' to commit violent crimes.


What else correlates?
Air pollution in Somerset, Pennsylvania · all weather
Violent crime rates · all random state specific
Air pollution in Somerset, Pennsylvania · all weather
Violent crime rates · all random state specific


View details about correlation #2,478
Chronic Fatigue or Hydroelectric Brute? The Link between Hydropower in Sierra Leone and Google Searches for 'I Am Tired'
The excessive splashing from all the hydropower turbines is creating a soothing white noise effect, lulling people into a state of constant drowsiness. It's like the whole country is at a relaxing water park, but without any of the fun or excitement.


What else correlates?
Hydopower energy generated in Sierra Leone · all energy
Google searches for 'i am tired' · all google searches
Hydopower energy generated in Sierra Leone · all energy
Google searches for 'i am tired' · all google searches
. The chart goes from 2002 to 2022, and the two variables track closely in value over that time.")

View details about correlation #3,092
Destiney or Destiny: The Popularity of a Name and the Fate of Nokia Oyj Stock
As the popularity of the first name Destiney waned, fewer parents were naming their children after the concept of fate or destiny. This led to a decreased interest in the mystical and inexplicable. As a result, people were no longer destined to buy Nokia phones, impacting the company's stock price. It seems Destiney's child-naming choices were not in Nok with Nokia's business fortunes after all!


What else correlates?
Popularity of the first name Destiney · all first names
Nokia Oyj's stock price (NOK) · all stocks
Popularity of the first name Destiney · all first names
Nokia Oyj's stock price (NOK) · all stocks


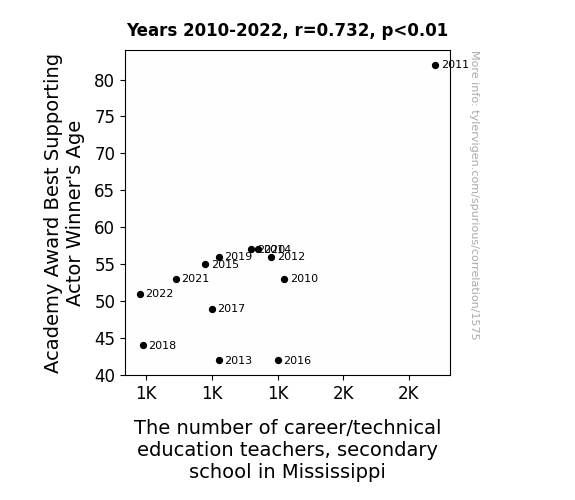
View details about correlation #1,575
Supporting Academia: An Oscar-Worthy Connection Between Best Supporting Actor Winners' Age and Career/Technical Education Teachers in Mississippi Secondary Schools
As Best Supporting Actors age, they gain a certain set of "skills" that make them perfect for transitioning into the world of career and technical education. You could say they really excel at "supporting" the next generation of skilled workers! It's as if their performances in life have prepared them for this "reel" role in shaping the future of vocational education. And let's not forget, with age comes wisdom, and who better to teach the ins and outs of a trade than someone who has mastered their craft in Hollywood? It seems like in Mississippi, the connection between Oscar-worthy experience and hands-on teaching is a real blockbuster!

Why this works
- Data dredging: I have 25,237 variables in my database. I compare all these variables against each other to find ones that randomly match up. That's 636,906,169 correlation calculations! This is called “data dredging.”
Fun fact: the chart used on the wikipedia page to demonstrate data dredging is also from me. I've been being naughty with data since 2014.
Instead of starting with a hypothesis and testing it, I instead tossed a bunch of data in a blender to see what correlations would shake out. It’s a dangerous way to go about analysis, because any sufficiently large dataset will yield strong correlations completely at random. - Lack of causal connection: There is probably no direct connection between these variables, despite what the AI says above.
Because these pages are automatically generated, it's possible that the two variables you are viewing are in fact causually related. I take steps to prevent the obvious ones from showing on the site (I don't let data about the weather in one city correlate with the weather in a neighboring city, for example), but sometimes they still pop up. If they are related, cool! You found a loophole.
This is exacerbated by the fact that I used "Years" as the base variable. Lots of things happen in a year that are not related to each other! Most studies would use something like "one person" in stead of "one year" to be the "thing" studied. - Observations not independent: For many variables, sequential years are not independent of each other. You will often see trend-lines form. If a population of people is continuously doing something every day, there is no reason to think they would suddenly change how they are doing that thing on January 1. A naive p-value calculation does not take this into account.
You will calculate a lower chance of "randomly" achieving the result than represents reality.
To be more specific: p-value tests are probability values, where you are calculating the probability of achieving a result at least as extreme as you found completely by chance. When calculating a p-value, you need to assert how many "degrees of freedom" your variable has. I count each year (minus one) as a "degree of freedom," but this is misleading for continuous variables.
This kind of thing can creep up on you pretty easily when using p-values, which is why it's best to take it as "one of many" inputs that help you assess the results of your analysis.
- Y-axes doesn't start at zero: I truncated the Y-axes of the graphs above. I also used a line graph, which makes the visual connection stand out more than it deserves.
Nothing against line graphs. They are great at telling a story when you have linear data! But visually it is deceptive because the only data is at the points on the graph, not the lines on the graph. In between each point, the data could have been doing anything. Like going for a random walk by itself!
Mathematically what I showed is true, but it is intentionally misleading. If you click on any of the charts that abuse this, you can scroll down to see a version that starts at zero. - Confounding variable: Confounding variables (like global pandemics) will cause two variables to look connected when in fact a "sneaky third" variable is influencing both of them behind the scenes.
- Outliers: Some datasets here have outliers which drag up the correlation.
In concept, "outlier" just means "way different than the rest of your dataset." When calculating a correlation like this, they are particularly impactful because a single outlier can substantially increase your correlation.
Because this page is automatically generated, I don't know whether any of the charts displayed on it have outliers. I'm just a footnote. ¯\_(ツ)_/¯
I intentionally mishandeled outliers, which makes the correlation look extra strong. - Low n: There are not many data points included in some of these charts.
You can do analyses with low ns! But you shouldn't data dredge with a low n.
Even if the p-value is high, we should be suspicious of using so few datapoints in a correlation.
Pro-tip: click on any correlation to see:
- Detailed data sources
- Prompts for the AI-generated content
- Explanations of each of the calculations (correlation, p-value)
- Python code to calculate it yourself


