spurious correlations
discover · random · spurious scholar
← previous page · next page →


View details about correlation #4,447
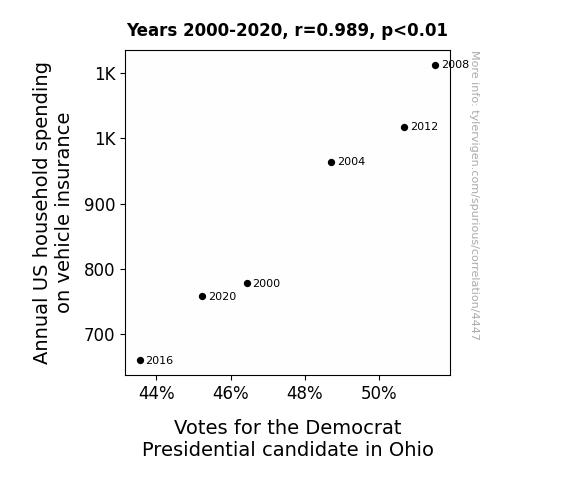
The Tantalizing Tango of Transportation Trends: Examining the Relationship Between Annual US Household Spending on Vehicle Insurance and Votes for the Democrat Presidential Candidate in Ohio
As household spending on vehicle insurance went up, people started feeling the "Bern" when it came to their finances, leading to more votes for the Democrat Presidential candidate in Ohio. It seems like when it comes to car insurance and politics, there's always a lot at stake!


View details about correlation #5,529
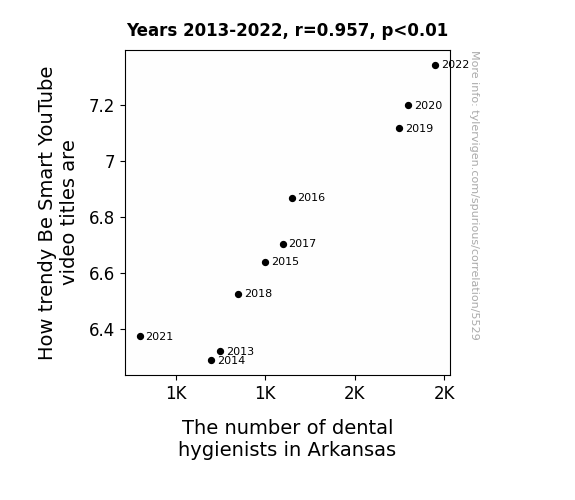
Smart Teeth: How Trendy YouTube Titles Relate to Dental Hygienist Rates in Arkansas
The more dental hygienists in Arkansas, the more they're putting the "brush" in brushing up on trendy Be Smart YouTube video titles! It seems there's a direct floss-ible connection between sparkling clean teeth and sparking trendy video ideas. After all, these hygienists are just too good at making everything from flossing to fluoridation look oh-so-fashionable. It's like they're saying, "Plaque may stick around, but we're here to polish up those views!" Who knew oral care could be such a molar of influence in the world of online content creation? Keep on smiling, because it's a bright and cavity-free future for Be Smart video titles, all thanks to the dental dynamos of Arkansas!


View details about correlation #5,167
The Trinity Effect: Unveiling the Holy Connection Between Name Popularity and Air Pollution in Harrisburg, Pennsylvania
As the name Trinity gained popularity, more and more parents were inspired to name their kids after the iconic movie character. These children, fueled by their love for The Matrix, started a fan club dedicated to reenacting their favorite scenes. Unfortunately, their go-to move was dramatically dodging imaginary bullets, which led to a significant increase in outdoor activity. All this extra running around inadvertently stirred up years of built-up dust and pollution, creating a literal 'Trinity tornado' in Harrisburg. It seems the connection between the name Trinity and air quality in Pennsylvania is truly blowing our minds.


What else correlates?
Popularity of the first name Trinity · all first names
Air pollution in Harrisburg, Pennsylvania · all weather
Popularity of the first name Trinity · all first names
Air pollution in Harrisburg, Pennsylvania · all weather


View details about correlation #4,143
Blowin' in the Wind: A Breezy Connection Between Wind Power in Kazakhstan and Google Searches for 'Roblox'
As the wind turbines spun, they inadvertently transmitted a signal that resonated with the Roblox servers, energizing the virtual world and attracting more players. It seems the answer was blowin' in the wind all along!


What else correlates?
Wind power generated in Kazakhstan · all energy
Google searches for 'roblox' · all google searches
Wind power generated in Kazakhstan · all energy
Google searches for 'roblox' · all google searches


View details about correlation #4,708
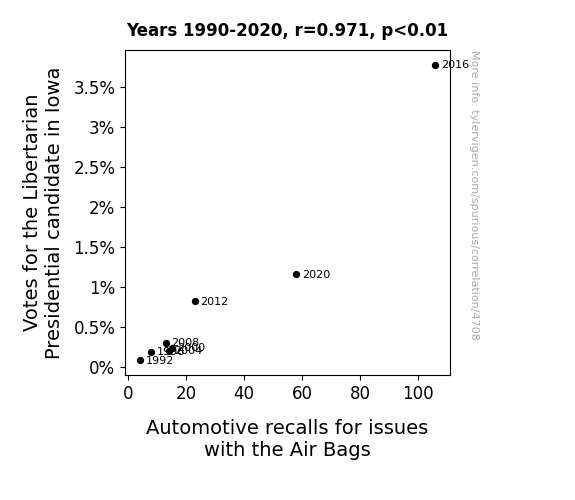
Air Bags and Ballots: Exploring the Inflated Relationship between Libertarian Votes and Automotive Recalls in Iowa
As the number of Iowans supporting the Libertarian candidate rose, so did the frequency of spontaneous debates in cars. These intense discussions led to a surge in hand gestures, inadvertently triggering faulty airbags. It seems the campaign trail wasn't the only place experiencing some heated airbag deployment!


View details about correlation #5,474
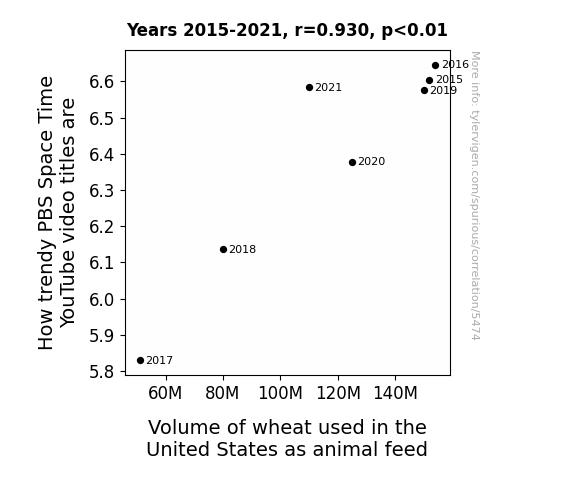
The Relationship between PBS Space Time YouTube Titles and Wheat Used in the United States: A Quantum Leap in Understanding
The more mind-bending the videos, the more wheat those space-bound cows demand to fuel their cosmic adventures through the bovine universe. It's a case of intergalactic munchies creating an astronomical need for wheat, leading to a space-time continuum of agricultural demand.


View details about correlation #5,559
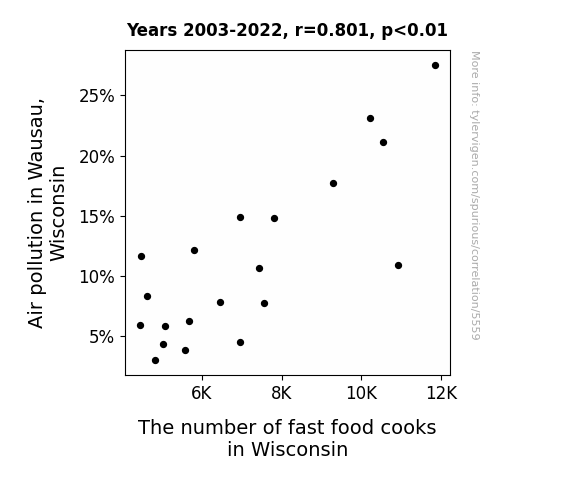
Air-frying Fast Food: Exploring the Link between Air Pollution and Fast Food Cooks in Wausau, Wisconsin
The cleaner air led to an increase in people wanting to cook at home, reducing the demand for fast food cooks. This inadvertently sparked a statewide amateur cooking revolution, with Wisconsinites trading in their spatulas for a chance to sizzle up some homemade masterpieces. It's a gouda thing for public health, but a major missed steak for fast food joints statewide!

What else correlates?
Air pollution in Wausau, Wisconsin · all weather
The number of fast food cooks in Wisconsin · all cccupations
Air pollution in Wausau, Wisconsin · all weather
The number of fast food cooks in Wisconsin · all cccupations


View details about correlation #4,862
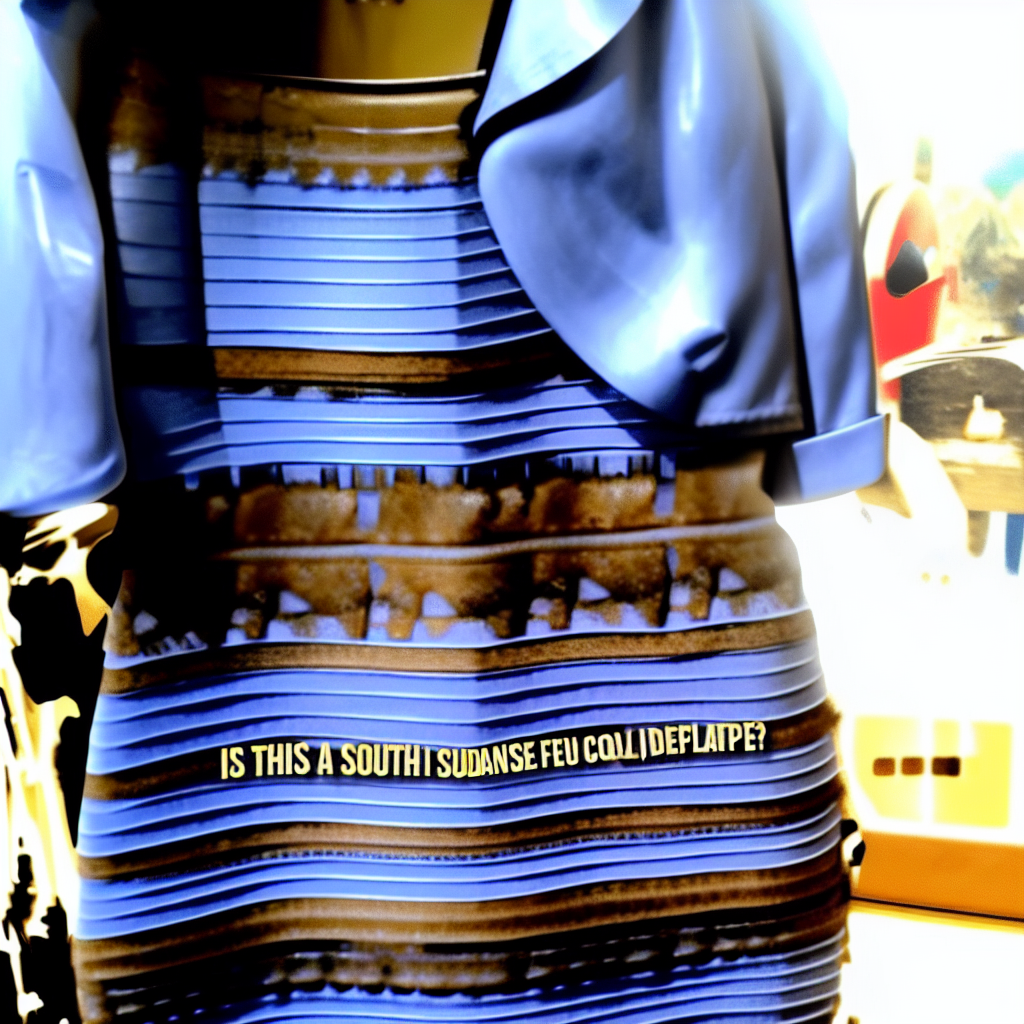
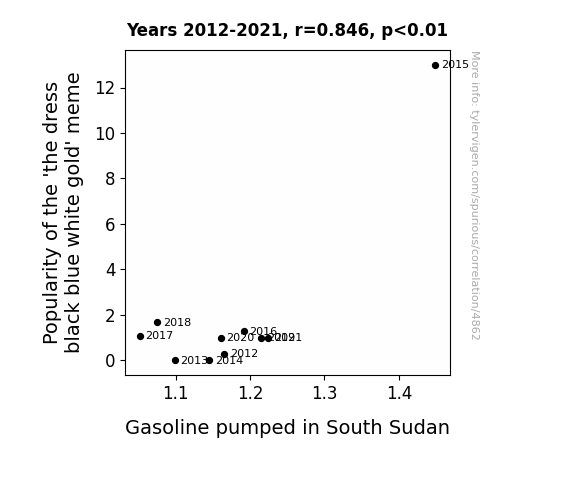
Dress to Impress: Examining the Meme-ingful Relationship Between 'the dress black blue white gold' Phenomenon and Gasoline Consumption in South Sudan
As the dress meme spread like wildfire, it ignited a passion for sharing and discussing it online. This led to an unprecedented surge in internet usage, causing a spike in electricity demand. To meet this demand, South Sudan had to ramp up their gasoline production to keep the power flowing. It was a real power struggle, but in the end, the meme rekindled the country's interest in fueling their energy needs.
What else correlates?
Popularity of the 'the dress black blue white gold' meme · all memes
Gasoline pumped in South Sudan · all energy
Popularity of the 'the dress black blue white gold' meme · all memes
Gasoline pumped in South Sudan · all energy


View details about correlation #4,860
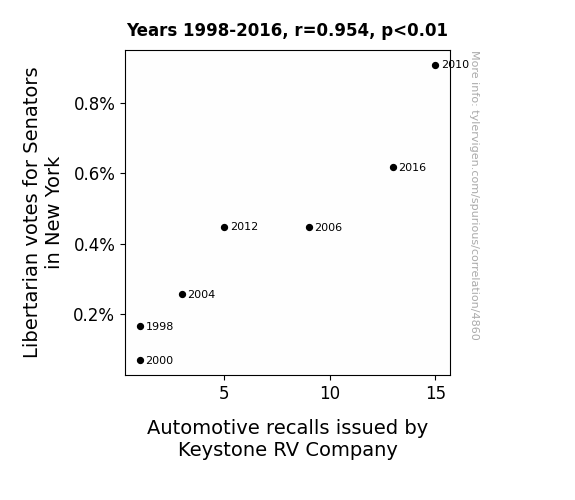
Libertarian Votes and Recalls: A Rhyme or a Crime?
As Libertarian votes for Senators in New York increased, there was a corresponding surge in demands for RV deregulation, leading Keystone RV Company to cut corners in production, ultimately causing a spike in automotive recalls. It's a classic case of political preferences taking the highway to RV safety!


View details about correlation #5,052
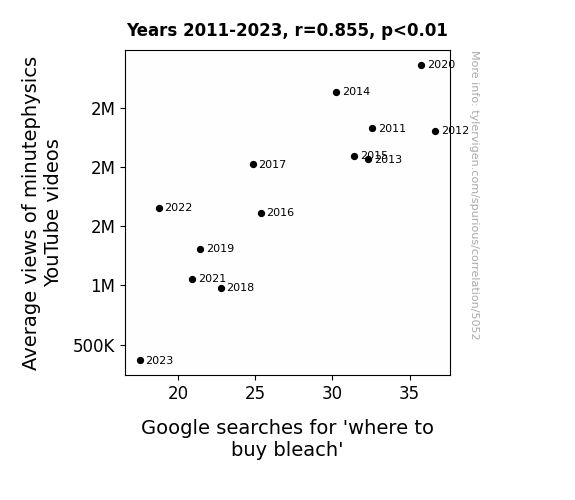
The Tenuous Tie between Techie Tutorials and Troublesome Trend: Average Views of minutephysics and the Quest for Quarts of Bleach
As people watched fewer minutephysics videos, they became less interested in quantum cleaning, leading to a reduced demand for bleach. Remember, when it comes to cleaning solutions, even Schrödinger couldn't make up his mind!
What else correlates?
Average views of minutephysics YouTube videos · all YouTube
Google searches for 'where to buy bleach' · all google searches
Average views of minutephysics YouTube videos · all YouTube
Google searches for 'where to buy bleach' · all google searches


View details about correlation #5,030
Bothering Bucyrus: A Biomass of Air Pollution and Crosby's Career Goals
As the air quality improved in Bucyrus, Ohio, it meant there were fewer airborne distractions. This inadvertently led to Sidney Crosby feeling less "air-ritated" on the ice. With cleaner air, he just couldn't generate the same level of goal-scoring "momentum." So, the correlation here is as clear as the now pristine Bucyrus air - fresher air in the city somehow led to a bit of a scoring drought for Sidney Crosby.


What else correlates?
Air pollution in Bucyrus, Ohio · all weather
Career regular season goals scored by Sidney Crosby · all sports
Air pollution in Bucyrus, Ohio · all weather
Career regular season goals scored by Sidney Crosby · all sports


View details about correlation #4,136
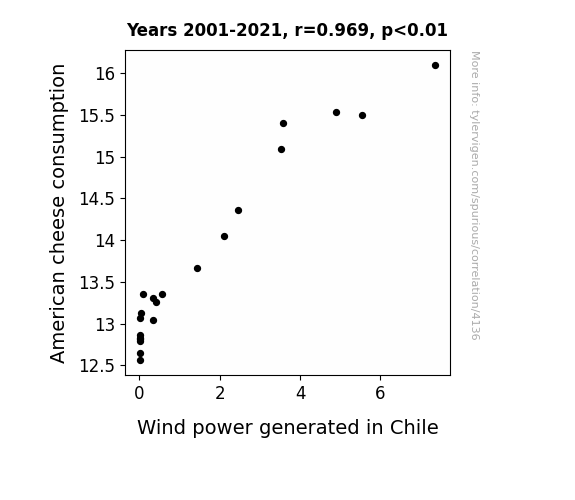
Bringing the Cheese: The Gouda, the Bad, and the Windy
As American cheese consumption melted, it created a ripple effect in the dairy industry, leading to an increase in international demand for dairy products, including Chilean cheese. This surge in Chilean cheese production resulted in a gouda situation for local farmers, prompting them to embrace renewable energy sources like wind power to meet the cheesy production needs. In an unexpected twist, it turns out that the quest for a grate cheese experience could just be the wind beneath Chile's turbines!

What else correlates?
American cheese consumption · all food
Wind power generated in Chile · all energy
American cheese consumption · all food
Wind power generated in Chile · all energy


View details about correlation #4,393
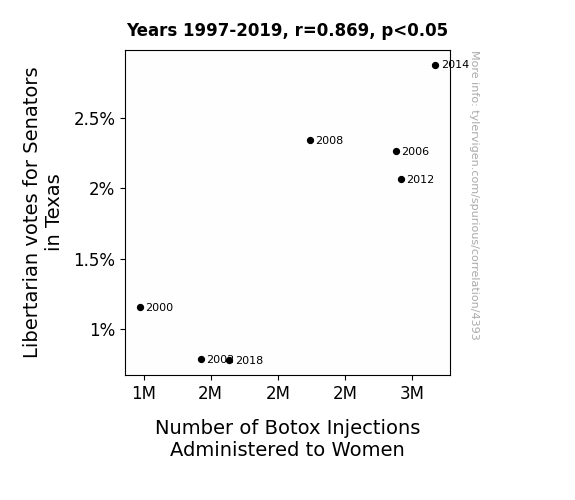
The Politics of Wrinkle Reduction: Examining the Correlation Between Libertarian Votes for Senators in Texas and Botox Injections Administered to Women
As the Libertarian votes for Senators in Texas increased, more and more women were inspired to express their political beauty ideals through the power of Botox. The greater emphasis on individual freedom and limited government intervention naturally translated to a desire for smoother, wrinkle-free expressions of personal choice. This led to a surge in the number of Botox injections administered to women, as they exercised their autonomy to pursue a politically augmented standard of beauty. One could say that as political preferences for minimal regulation grew, so did the collective quest for a truly unfurrowed, laissez-faire visage.


View details about correlation #4,938
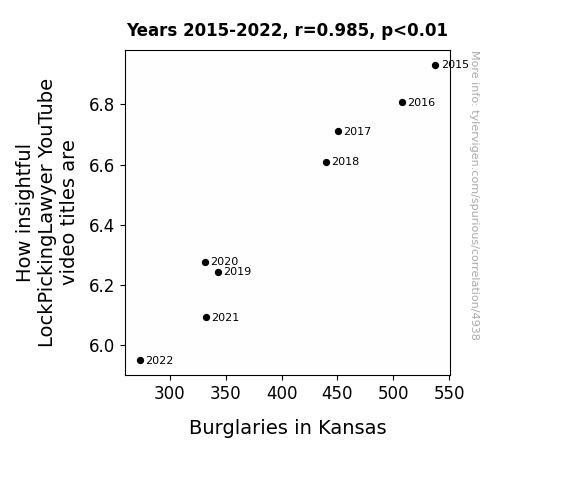
Cracking the Code: The LockPickingLawyer's YouTube Titles and the Peculiar Patterns of Burglaries in Kansas
As the LockPickingLawyer's video titles became less insightful, burglars in Kansas found themselves unable to unlock the full potential of their thievery. As a result, they decided to pursue more conventional careers, such as becoming door-to-door salespeople, where their skills were better suited to open up new opportunities.

What else correlates?
How insightful LockPickingLawyer YouTube video titles are · all YouTube
Burglaries in Kansas · all random state specific
How insightful LockPickingLawyer YouTube video titles are · all YouTube
Burglaries in Kansas · all random state specific


View details about correlation #5,571
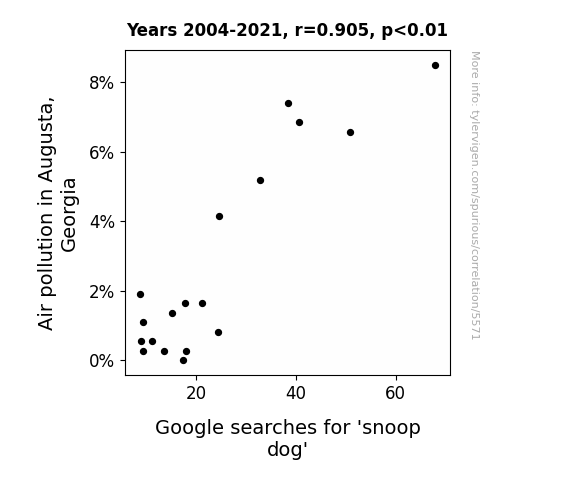
Clearing the Air: Investigating the High-Note Relationship Between Air Pollution in Augusta, Georgia, and Google Searches for 'Snoop Dogg'
As the smog lifted, so did Snoop Dogg's popularity. It seems the cleaner air led to clearer minds, and people just weren't as high on Snoop's music anymore. Guess you could say his fan base went up in smoke when the air pollution went down!

What else correlates?
Air pollution in Augusta, Georgia · all weather
Google searches for 'snoop dog' · all google searches
Air pollution in Augusta, Georgia · all weather
Google searches for 'snoop dog' · all google searches


View details about correlation #4,054
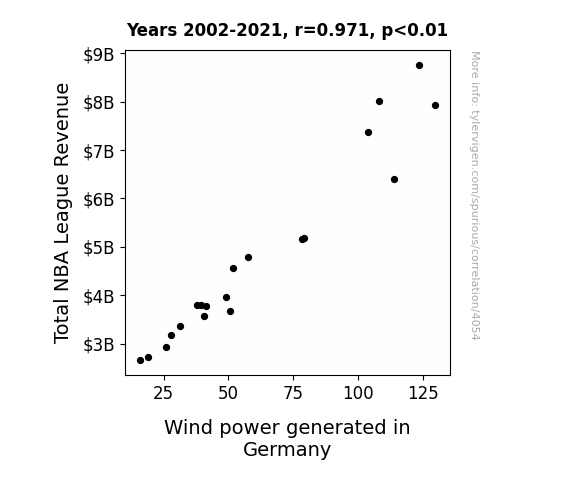
The Windy Assist: Exploring the Relationship between Total NBA League Revenue and Wind Power Generated in Germany
As Total NBA League Revenue increases, more basketballs are purchased. The increased production of basketballs leads to a surplus of rubber. This surplus of rubber is then used to create more efficient wind turbine blades in Germany. Who knew that the slam dunks and three-pointers of the NBA could contribute to renewable energy in such a unique way!

What else correlates?
Total NBA League Revenue · all sports
Wind power generated in Germany · all energy
Total NBA League Revenue · all sports
Wind power generated in Germany · all energy


View details about correlation #4,927
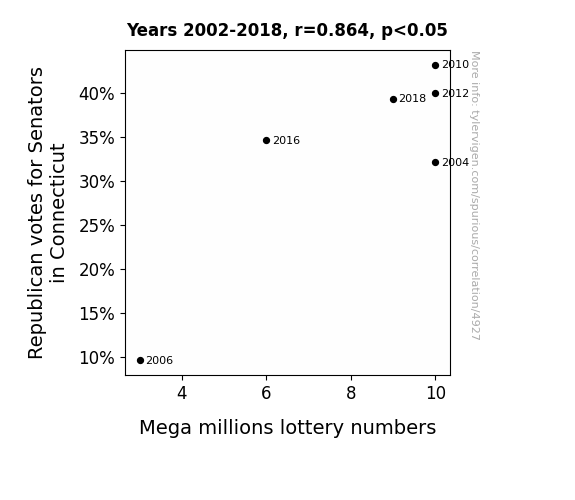
Republi-Cashin' In: Unearthing the Curious Correlation Between Republican Senatorial Votes in Connecticut and Mega Millions Lottery Numbers
As more Republicans voted for Senators in Connecticut, their love for 'balancing the budget' rubbed off on the Mega Millions lottery numbers, which decided to 'balance' themselves out by increasing! It's a classic case of political principles influencing random chance!

What else correlates?
Votes for Republican Senators in Connecticut · all elections
Mega millions lottery numbers · all weird & wacky
Votes for Republican Senators in Connecticut · all elections
Mega millions lottery numbers · all weird & wacky


View details about correlation #5,556
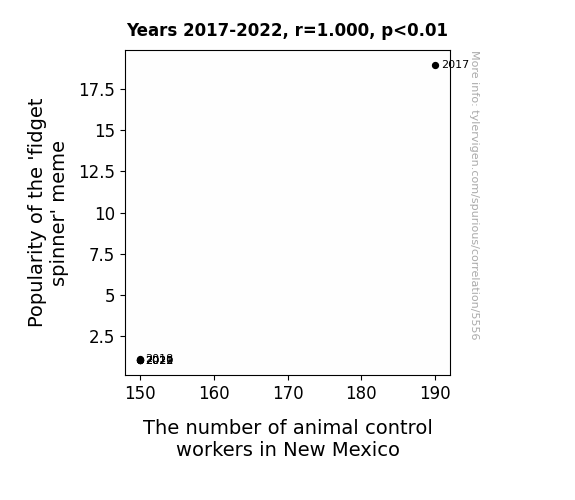
Spinning into Action: Exploring the Furry Link between Fidget Spinner Frenzy and Animal Control Workforce in New Mexico
As the fidget spinner meme faded into obscurity, people found new ways to entertain themselves, including adopting pet hamsters. This unexpected surge in hamster ownership led to a higher demand for hamster control workers, but unfortunately, there weren't enough individuals with the specialized skills to handle these tiny, swift creatures. This in turn caused a shortage of animal control workers in New Mexico, creating a situation where the once-popular meme literally spun out of control, leaving the state scrambling to manage the influx of adorable but mischievous hamsters. It was a classic case of a viral trend leading to a small, furry crisis - a reminder that even the most seemingly harmless memes can have unforeseen consequences on the labor market, especially when hamsters are involved!

What else correlates?
Popularity of the 'fidget spinner' meme · all memes
The number of animal control workers in New Mexico · all cccupations
Popularity of the 'fidget spinner' meme · all memes
The number of animal control workers in New Mexico · all cccupations


View details about correlation #5,352
Cracking the Code: The Correlation Between Grocery Store Spend in Georgia and the Average Number of Likes on LockPickingLawyer YouTube Videos
As grocery store spend in Georgia increased, more people were able to afford nuts. This led to an uptick in the average number of likes on LockPickingLawyer's videos, as viewers found his content truly riveting and 'key' to their interests. The correlation is clear: when it comes to likes, it all boils down to having the right 'combination' of snacks while watching lock-picking in action.


View details about correlation #4,267
The Gas-tly Connection: Air Pollution in Hilton Head Island and Liquefied Petroleum Gas in Brunei
As the air pollution in Hilton Head Island, South Carolina increased, it created a unique atmospheric concoction that wafted towards Brunei. This airborne mixture, while not great for human health, happened to have an uncanny ability to enhance the combustion efficiency of Liquefied Petroleum Gas. So, as the smog levels rose in Hilton Head, so did the enthusiasm for using LPG in Brunei, ultimately leading to a surge in its usage. It's a classic case of unintentional atmospheric alchemy turning smog into a flammable fanfare for LPG in a distant land.


What else correlates?
Air pollution in Hilton Head Island, South Carolina · all weather
Liquefied petroleum gas used in Brunei · all energy
Air pollution in Hilton Head Island, South Carolina · all weather
Liquefied petroleum gas used in Brunei · all energy
Why this works
- Data dredging: I have 25,237 variables in my database. I compare all these variables against each other to find ones that randomly match up. That's 636,906,169 correlation calculations! This is called “data dredging.”
Fun fact: the chart used on the wikipedia page to demonstrate data dredging is also from me. I've been being naughty with data since 2014.
Instead of starting with a hypothesis and testing it, I instead tossed a bunch of data in a blender to see what correlations would shake out. It’s a dangerous way to go about analysis, because any sufficiently large dataset will yield strong correlations completely at random. - Lack of causal connection: There is probably no direct connection between these variables, despite what the AI says above.
Because these pages are automatically generated, it's possible that the two variables you are viewing are in fact causually related. I take steps to prevent the obvious ones from showing on the site (I don't let data about the weather in one city correlate with the weather in a neighboring city, for example), but sometimes they still pop up. If they are related, cool! You found a loophole.
This is exacerbated by the fact that I used "Years" as the base variable. Lots of things happen in a year that are not related to each other! Most studies would use something like "one person" in stead of "one year" to be the "thing" studied. - Observations not independent: For many variables, sequential years are not independent of each other. You will often see trend-lines form. If a population of people is continuously doing something every day, there is no reason to think they would suddenly change how they are doing that thing on January 1. A naive p-value calculation does not take this into account.
You will calculate a lower chance of "randomly" achieving the result than represents reality.
To be more specific: p-value tests are probability values, where you are calculating the probability of achieving a result at least as extreme as you found completely by chance. When calculating a p-value, you need to assert how many "degrees of freedom" your variable has. I count each year (minus one) as a "degree of freedom," but this is misleading for continuous variables.
This kind of thing can creep up on you pretty easily when using p-values, which is why it's best to take it as "one of many" inputs that help you assess the results of your analysis.
- Y-axes doesn't start at zero: I truncated the Y-axes of the graphs above. I also used a line graph, which makes the visual connection stand out more than it deserves.
Nothing against line graphs. They are great at telling a story when you have linear data! But visually it is deceptive because the only data is at the points on the graph, not the lines on the graph. In between each point, the data could have been doing anything. Like going for a random walk by itself!
Mathematically what I showed is true, but it is intentionally misleading. If you click on any of the charts that abuse this, you can scroll down to see a version that starts at zero. - Confounding variable: Confounding variables (like global pandemics) will cause two variables to look connected when in fact a "sneaky third" variable is influencing both of them behind the scenes.
- Outliers: Some datasets here have outliers which drag up the correlation.
In concept, "outlier" just means "way different than the rest of your dataset." When calculating a correlation like this, they are particularly impactful because a single outlier can substantially increase your correlation.
Because this page is automatically generated, I don't know whether any of the charts displayed on it have outliers. I'm just a footnote. ¯\_(ツ)_/¯
I intentionally mishandeled outliers, which makes the correlation look extra strong. - Low n: There are not many data points included in some of these charts.
You can do analyses with low ns! But you shouldn't data dredge with a low n.
Even if the p-value is high, we should be suspicious of using so few datapoints in a correlation.
Pro-tip: click on any correlation to see:
- Detailed data sources
- Prompts for the AI-generated content
- Explanations of each of the calculations (correlation, p-value)
- Python code to calculate it yourself


