spurious correlations
discover · random · spurious scholar
← previous page · next page →


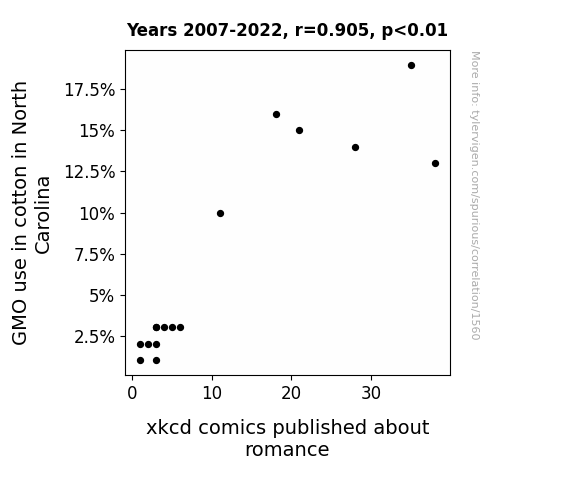
View details about correlation #1,560
Genetically Modified Romance: Uncovering the Cotton Connection Between GMO Use in North Carolina and xkcd Comics
Cotton fields were a hot spot for romantic escapades among genetically modified organisms, leading to inspiration for xkcd comics. With fewer GMOs in the area, the romantic entanglements dwindled, leaving Randall Munroe with less material for his love-themed xkcd creations.

What else correlates?
GMO use in cotton in North Carolina · all food
xkcd comics published about romance · all weird & wacky
GMO use in cotton in North Carolina · all food
xkcd comics published about romance · all weird & wacky


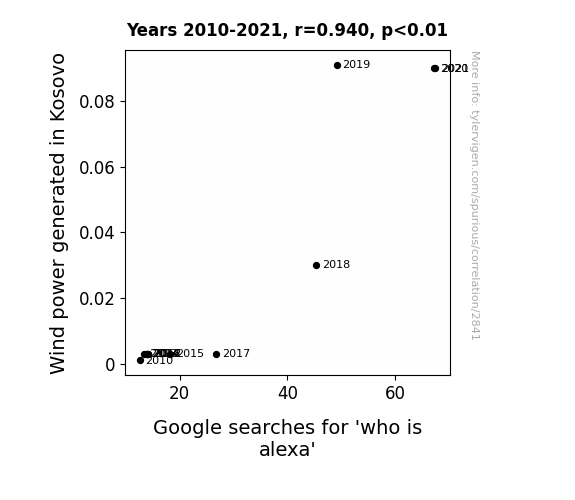
View details about correlation #2,841
Blowing in the Wind: Unveiling the Relationship Between Wind Power Generation in Kosovo and the Curious Searches for 'Who is Alexa' on Google
The answer, my friend, is blowin' in the wind...of change. As the turbines turned, they sparked a newfound curiosity. Maybe people just wanted to know if Alexa had a 'renewable' energy about her. It seems like Kosovo's gust for clean energy really 'blew away' the competition in the search for Alexa's identity!

What else correlates?
Wind power generated in Kosovo · all energy
Google searches for 'who is alexa' · all google searches
Wind power generated in Kosovo · all energy
Google searches for 'who is alexa' · all google searches


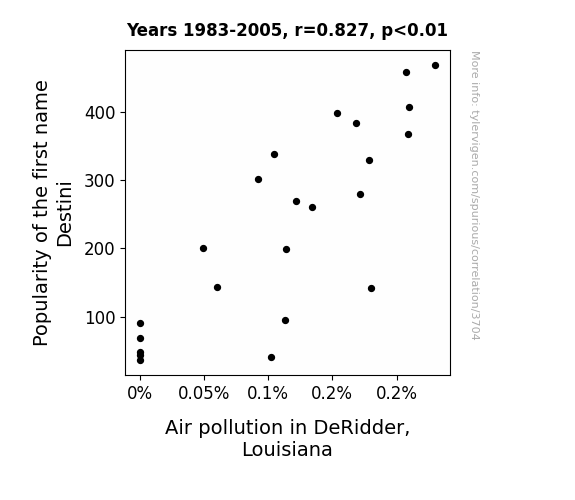
View details about correlation #3,704
Destini Calling: The Correlation Between Popularity of the First Name Destini and Air Pollution in DeRidder, Louisiana
As more and more parents named their children Destini, the demand for personalized car license plates with the name "DesTINI" skyrocketed. This led to a sudden spike in car ownership in DeRidder, Louisiana, congesting the roads and increasing harmful emissions. Remember, when it comes to baby names, choose wisely and eco-consciously!

What else correlates?
Popularity of the first name Destini · all first names
Air pollution in DeRidder, Louisiana · all weather
Popularity of the first name Destini · all first names
Air pollution in DeRidder, Louisiana · all weather


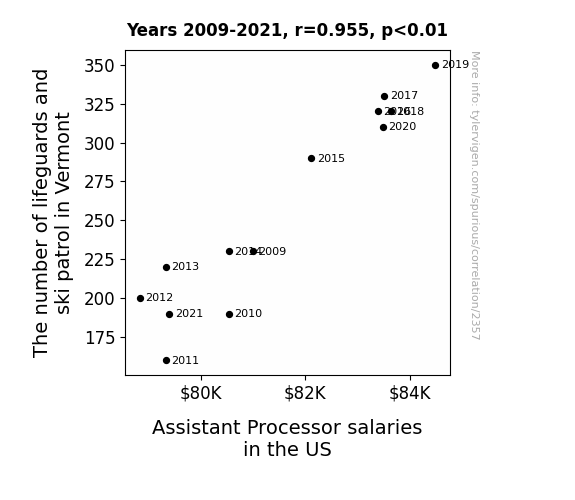
View details about correlation #2,357
Ski Patrols and Salaries: A Study of Surprising Statistics
As the number of lifeguards and ski patrol in Vermont decreased, there was a rise in snow-related accidents. This led to an unexpected surge in demand for medical assistance, hence driving up the need for medical professionals like Assistant Processors. With more people in need of treatment, the healthcare industry had to allocate additional funds to cover these snowy incidents, leaving less budget for salaries. It seems like the slippery slopes of Vermont had a downhill effect on Assistant Processor salaries nationwide!
What else correlates?
The number of lifeguards and ski patrol in Vermont · all cccupations
Assistant Processor salaries in the US · all education
The number of lifeguards and ski patrol in Vermont · all cccupations
Assistant Processor salaries in the US · all education
. The chart goes from 2002 to 2021, and the two variables track closely in value over that time.")

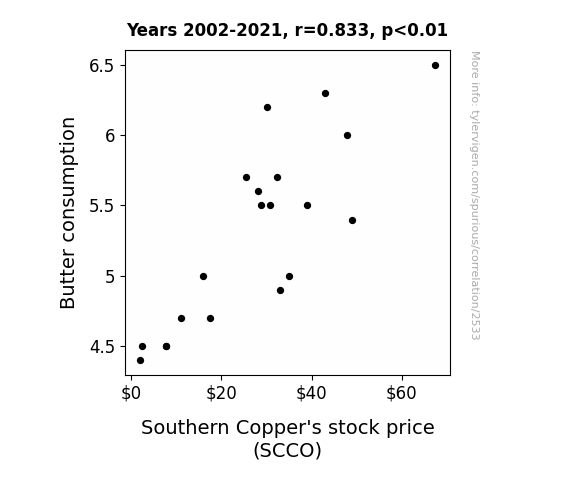
View details about correlation #2,533
Spreading the Butter: An Unlikely Link Between Butter Consumption and the Stock Price of Southern Copper (SCCO)
As people buttered up their cornbread and biscuits, they were in a better mood, leading to an increase in Southern hospitality. This in turn attracted more tourists to the South, boosting the demand for copper to build quirky roadside attractions like the world's largest garden gnome made entirely of copper. This increased demand for copper drove up Southern Copper's stock price. So, remember, spread a little butter, and watch those stocks sizzle!
What else correlates?
Butter consumption · all food
Southern Copper's stock price (SCCO) · all stocks
Butter consumption · all food
Southern Copper's stock price (SCCO) · all stocks


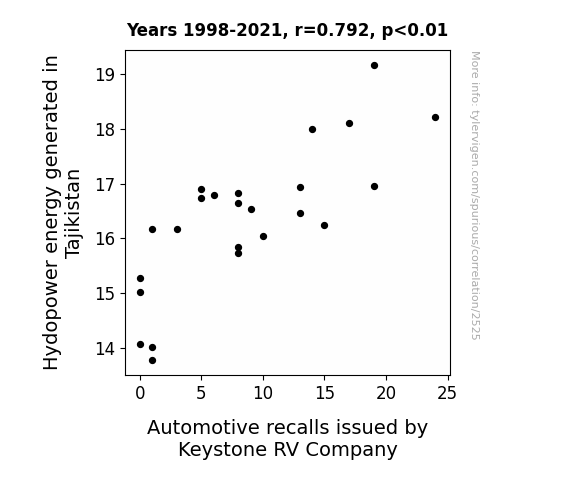
View details about correlation #2,525
Pulling the Plug: Exploring the Shocking Connection between Hydropower Energy in Tajikistan and Automotive Recalls by Keystone RV Company
The excessive hydro energy was inadvertently being transmitted through the earth's electromagnetic field, causing a flux in the RV control systems. This led to unexpected malfunctions and prompted the Keystone recalls. Remember folks, with great power comes great RV responsibility!

What else correlates?
Hydopower energy generated in Tajikistan · all energy
Automotive recalls issued by Keystone RV Company · all weird & wacky
Hydopower energy generated in Tajikistan · all energy
Automotive recalls issued by Keystone RV Company · all weird & wacky


View details about correlation #4,286
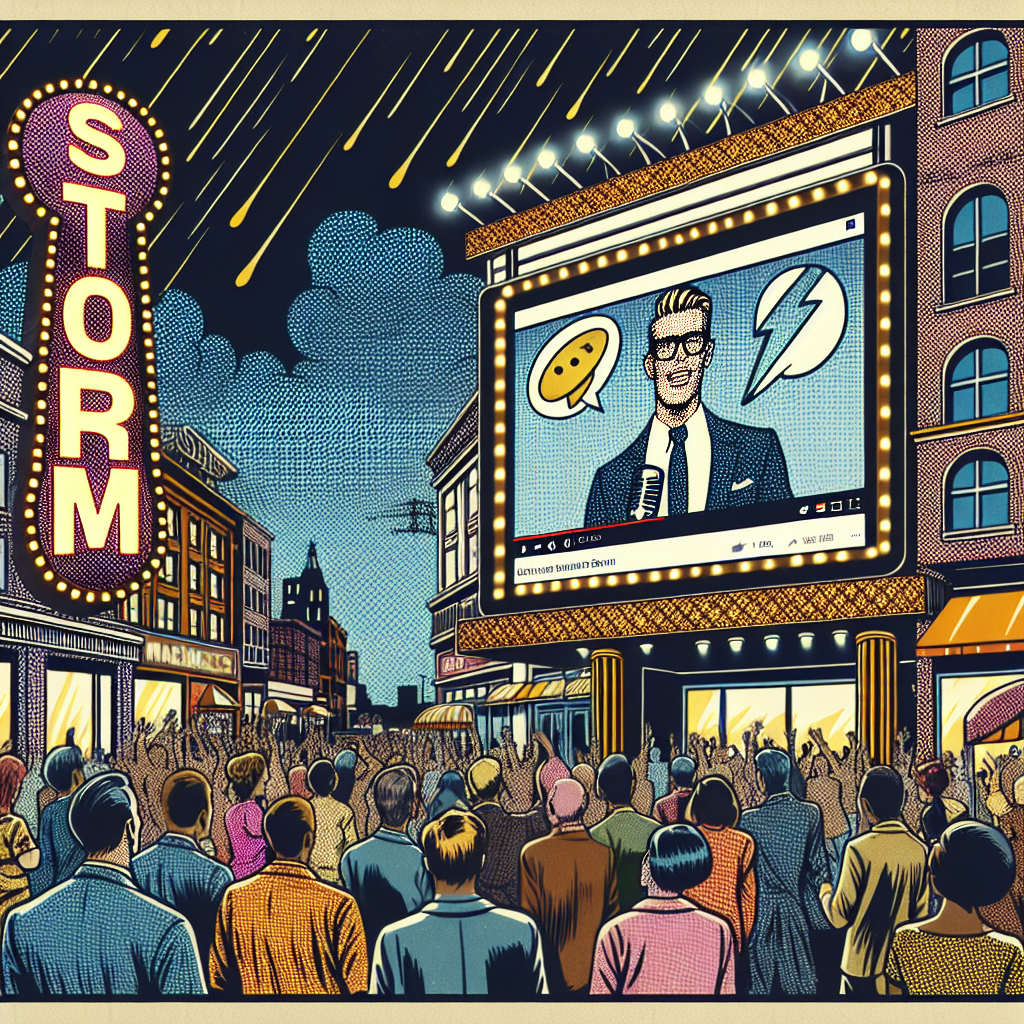
The Stormy Stand-Up: A Statistical Analysis of the Name Storm and Its Influence on the Popularity of Stand-Up Maths YouTube Videos
Maybe the energy and wit associated with the name Storm inadvertently inspired people to seek out more intellectually stimulating content. After all, it's a perfect storm of entertainment and education!

What else correlates?
Popularity of the first name Storm · all first names
Total likes of Matt Parker's YouTube videos · all YouTube
Popularity of the first name Storm · all first names
Total likes of Matt Parker's YouTube videos · all YouTube


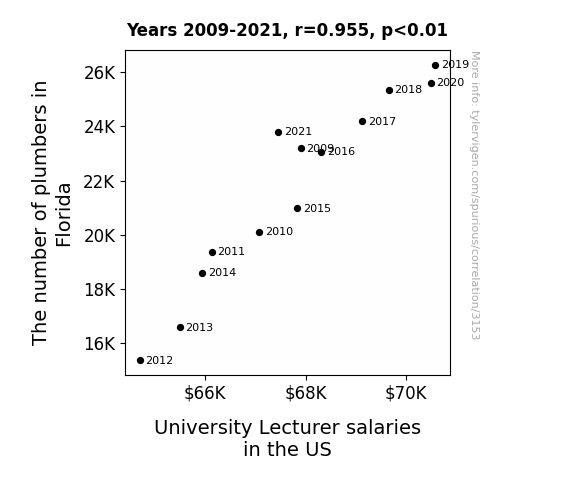
View details about correlation #3,153
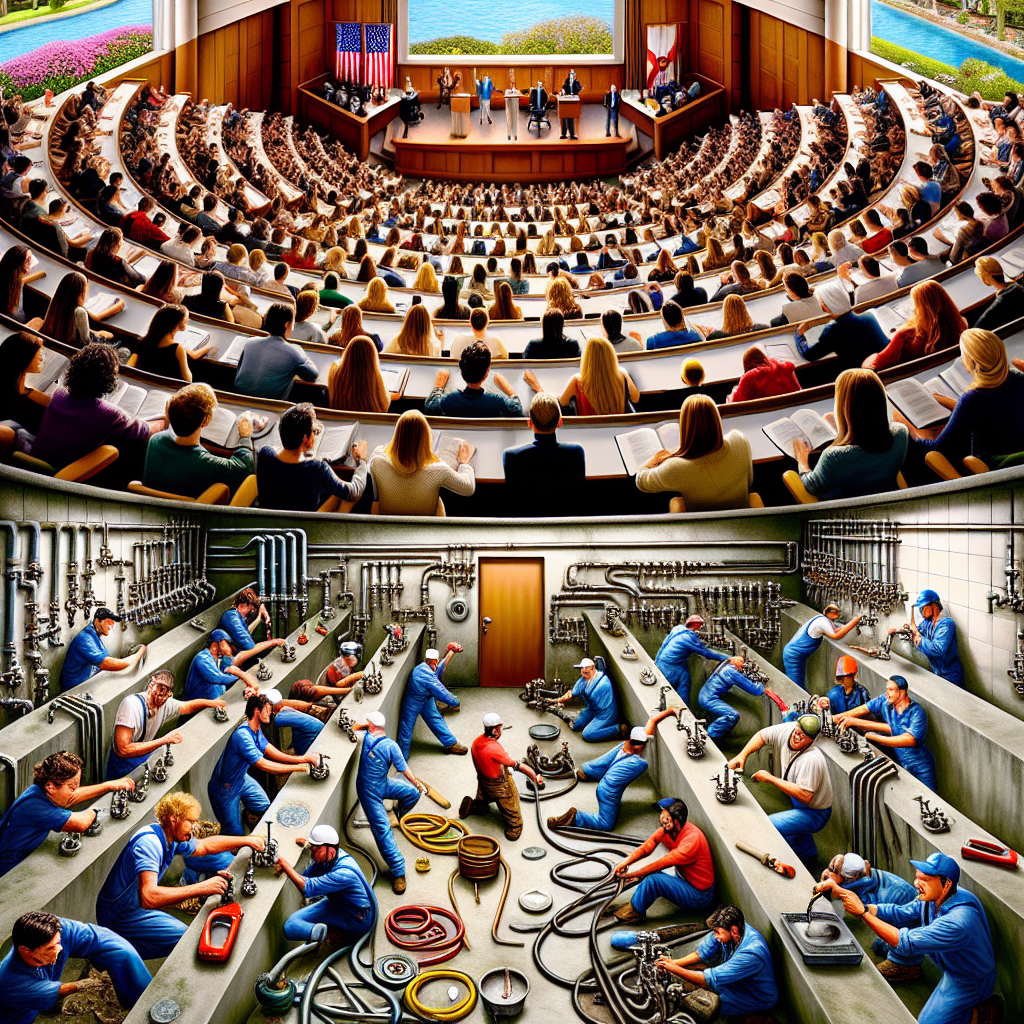
The Pipe Dreams of Academia: A Correlational Study of Plumbers and Professors
As the number of plumbers in Florida rose, so did their expertise in pipe systems. This inadvertently led to a surge in knowledge flow, creating a pressure for universities to keep up. Hence, they had to shell out more money to attract top lecturer talent, causing a rise in lecturer salaries nationwide. It seems like the plumbers were not just great at fixing leaks, but also at creating a pipeline of success for educators.
What else correlates?
The number of plumbers in Florida · all cccupations
University Lecturer salaries in the US · all education
The number of plumbers in Florida · all cccupations
University Lecturer salaries in the US · all education


View details about correlation #2,251
Genetically Modified Soybeans in Wisconsin and the Goofy Google Search for 'I Can't Even': A Gleeful Glimpse into Correlation
As GMO soybeans in Wisconsin grew larger and more bountiful, they started emitting vibes of overachievement. People were left in awe of these soybeans that could 'even' so hard, leading to a wave of existential crisis and internet searches for coping strategies. It's like the soybeans were saying, "You think you can't even? Look at us, we can odd, prime, and Fibonacci sequence all at once!" This left everyone feeling soy inadequate and soy incapable, hence the surge in 'i cant even' Google searches. Those soybeans just couldn't leaf well enough alone!


What else correlates?
GMO use in soybeans in Wisconsin · all food
Google searches for 'i cant even' · all google searches
GMO use in soybeans in Wisconsin · all food
Google searches for 'i cant even' · all google searches


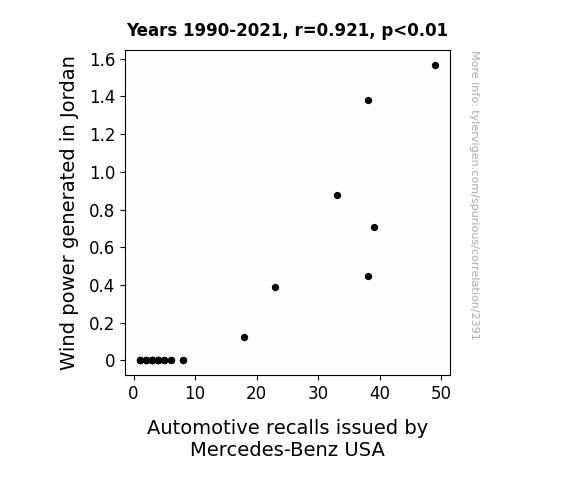
View details about correlation #2,391
Zephyr Zephyr, Quite Contrary: Exploring the Wind Power-Windshield Woes Nexus
The surplus wind power was inadvertently being harnessed by Mercedes-Benz, causing their cars to develop a case of the "windy squeals" in the automated systems.

What else correlates?
Wind power generated in Jordan · all energy
Automotive recalls issued by Mercedes-Benz USA · all weird & wacky
Wind power generated in Jordan · all energy
Automotive recalls issued by Mercedes-Benz USA · all weird & wacky


View details about correlation #4,614
Thaddeus or Not Thaddeus: The Libertarian Leaning of a Name
Thaddeus was spreading the word about individual liber-THAD-dee and personal free-WILL! This sparked a THAD-dash of support for the Libertarian candidate, proving that when it comes to politics, Thaddeus not be ignored!

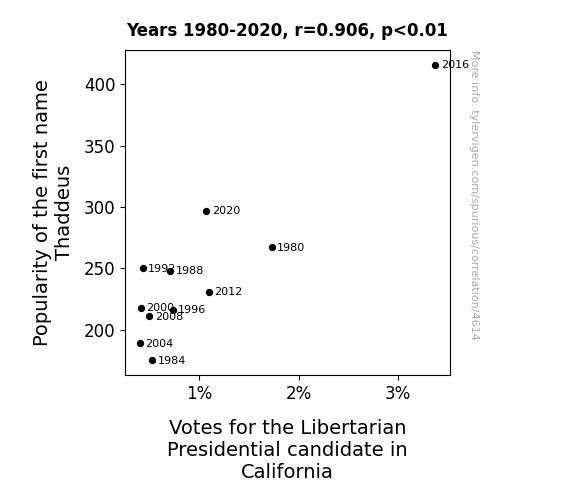
. The chart goes from 2003 to 2022, and the two variables track closely in value over that time.")

View details about correlation #2,281
Digging into the Connection: The Impact of Environmental Engineers in Texas on Suncor Energy Stock Price
The influx of environmentally conscious engineers "fueled" a wave of renewable energy innovations, leading to a "solar" surge in Suncor's stock price. As these engineers "Texas"-fied their approach to sustainability, it created a domino effect, propelling Suncor to shine brighter on the stock market. This just goes to show, when it comes to stocks, sometimes the best returns are rooted in "green" practices!


What else correlates?
The number of environmental engineers in Texas · all cccupations
Suncor Energy's stock price (SU) · all stocks
The number of environmental engineers in Texas · all cccupations
Suncor Energy's stock price (SU) · all stocks


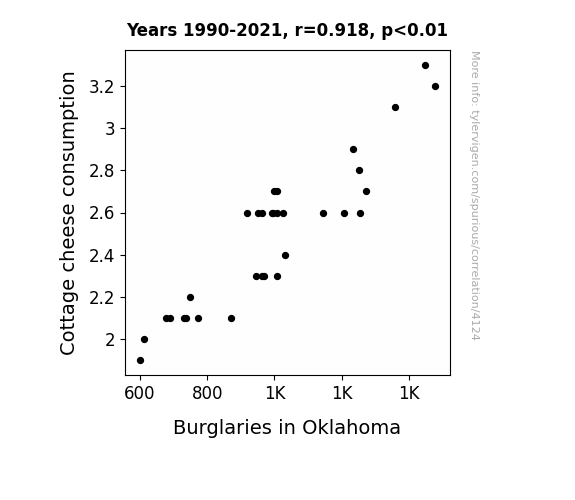
View details about correlation #4,124
Curds and Crime: Investigating the Link Between Cottage Cheese Consumption and Burglaries in Oklahoma
As people consumed less cottage cheese, they became more constipated. The discomfort of constipation led to an increase in home security purchases, ultimately deterring burglars. More locked doors and windows meant fewer opportunities for theft. Remember, a regular bathroom routine can really protect your assets!

What else correlates?
Cottage cheese consumption · all food
Burglaries in Oklahoma · all random state specific
Cottage cheese consumption · all food
Burglaries in Oklahoma · all random state specific


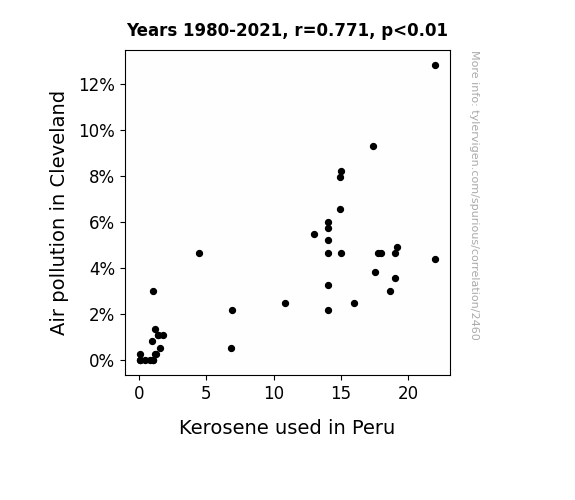
View details about correlation #2,460
The Gasping Connection: Investigating the Relationship Between Air Pollution in Cleveland and Kerosene Consumption in Peru
As air quality improved in Cleveland, the city became less reliant on burning fossil fuels, leading to a lower demand for kerosene. This shift created a 'clean air cascade effect' that wafted all the way to Peru, reducing the need for kerosene there too. It's like Cleveland said, "Kero-see ya later, air pollution!"

What else correlates?
Air pollution in Cleveland · all weather
Kerosene used in Peru · all energy
Air pollution in Cleveland · all weather
Kerosene used in Peru · all energy
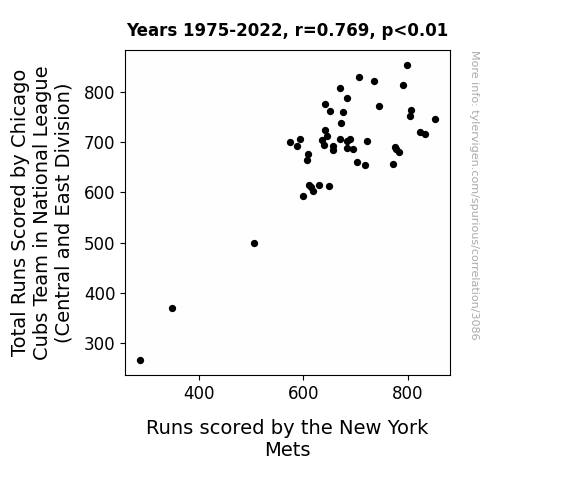
 and the second variable is Runs scored by the New York Mets. The chart goes from 1975 to 2022, and the two variables track closely in value over that time.")

View details about correlation #3,086
Batting Around the Numbers: A Statistical Analysis of the Relationship Between Chicago Cubs' Total Runs Scored and New York Mets' Runs Scored
Well, you see, as the Chicago Cubs score more runs, they unknowingly send out powerful cosmic vibes of offensive prowess. These vibes, traveling at the speed of light, reach the New York Mets, energizing their batters and inspiring base running heroics. It's like the Cubs are the conductors of a high-scoring, inter-MLB orchestra, and the Mets are the first violins, harmonizing perfectly with every RBI. It’s a little-known phenomenon called the Run-symptotic Effect, and it's a home run in the field of sports pseudoscience. Who knew that the Cubs' domination on the diamond could have such far-reaching, Mets-merizing consequences?


View details about correlation #3,219
Joys and Traffic Cohorts: Exploring the Jolly Connection
As the name Joy became more popular, it led to an overall increase in happiness. This surge in happiness levels somehow sparked an interest in the highly underrated field of traffic technology, prompting more people to pursue careers in managing and optimizing traffic flow. After all, who wouldn't want to spread a little extra Joy on the roads of Massachusetts?

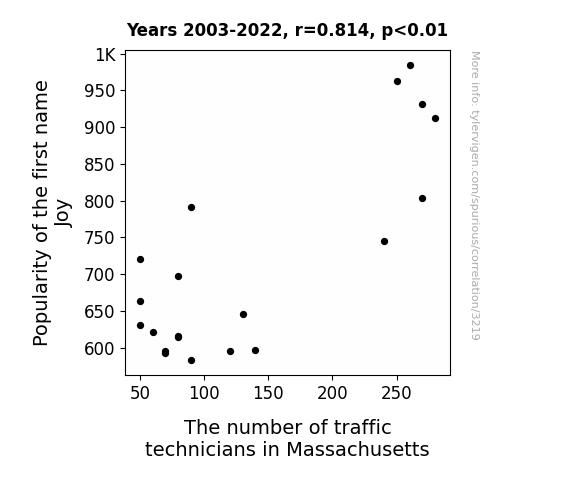
What else correlates?
Popularity of the first name Joy · all first names
The number of traffic technicians in Massachusetts · all cccupations
Popularity of the first name Joy · all first names
The number of traffic technicians in Massachusetts · all cccupations
. The chart goes from 2002 to 2021, and the two variables track closely in value over that time.")

View details about correlation #3,282
Feta or Cheddar, TT Gets Better: The Whey to Wealth Connection Between American Cheese Consumption and Trane Technologies' Stock Price
As Americans consumed more American cheese, their desire for the classic comfort of grilled cheese sandwiches grew. This led to an uptick in the use of kitchen appliances, including refrigerators. With an increase in the demand for refrigerators, Trane Technologies, a company that also manufactures cooling systems, saw a parallel rise in interest. As a result, investors flocked to TT, driving up the stock price. So, in a bizarrely cheesy twist, it seems that the path to higher stock prices truly is paved with slices of American cheese!

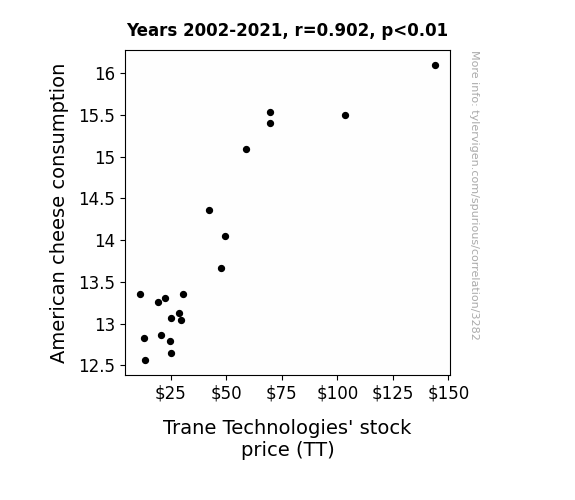
What else correlates?
American cheese consumption · all food
Trane Technologies' stock price (TT) · all stocks
American cheese consumption · all food
Trane Technologies' stock price (TT) · all stocks


View details about correlation #1,430
The Wind Beneath Our Degrees: Exploring the Relationship Between Agriculture and Natural Resources Master's Degrees and Wind Power Generated in Lithuania
As more individuals obtained advanced agricultural knowledge, there was a simultaneous surge in superior farming techniques. This led to the cultivation of supercharged crops that, when swaying in the breeze, inadvertently created stronger and steadier winds across Lithuania, effectively boosting the production of wind power. Who knew that a little extra education could agricul-turally impact the air currents in such a powerful way?


View details about correlation #1,942
A Breath of Fresh Air: The Pair Between Phoenix Air and Amazon Green
As air quality in Phoenix decreased, more people decided to ditch the desert for the lush greenery of the Amazon. This led to an unexpected influx of Phoenix residents partaking in urban Amazon adventuring. And as they say, where there's smog, there's a rainforest romp - talk about a breath of fresh Amazonian air!

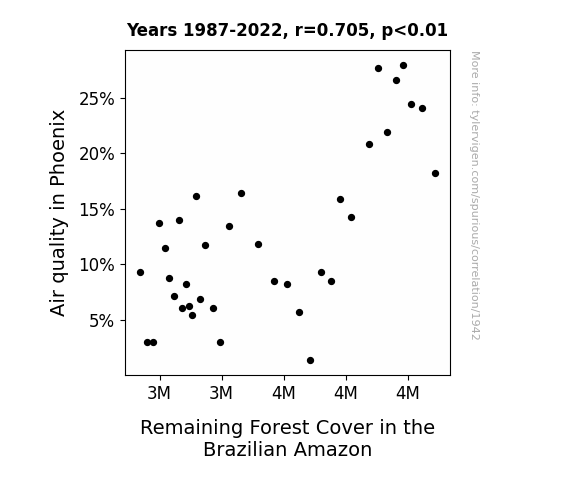
What else correlates?
Air quality in Phoenix · all weather
Remaining Forest Cover in the Brazilian Amazon · all weird & wacky
Air quality in Phoenix · all weather
Remaining Forest Cover in the Brazilian Amazon · all weird & wacky


View details about correlation #1,108
The Royally Googled Connection: Unveiling the Correlation Between Google Searches for Who is Prince William and the Number of Human Resources Specialists in Hawaii
As more people became curious about Prince William, they realized the importance of succession planning and proper leadership development. This led to a spike in demand for HR specialists in Hawaii, who were now tasked with finding the best candidates to rule their own little kingdoms within the workplace. After all, every company needs a royal succession plan, right?


Why this works
- Data dredging: I have 25,237 variables in my database. I compare all these variables against each other to find ones that randomly match up. That's 636,906,169 correlation calculations! This is called “data dredging.”
Fun fact: the chart used on the wikipedia page to demonstrate data dredging is also from me. I've been being naughty with data since 2014.
Instead of starting with a hypothesis and testing it, I instead tossed a bunch of data in a blender to see what correlations would shake out. It’s a dangerous way to go about analysis, because any sufficiently large dataset will yield strong correlations completely at random. - Lack of causal connection: There is probably no direct connection between these variables, despite what the AI says above.
Because these pages are automatically generated, it's possible that the two variables you are viewing are in fact causually related. I take steps to prevent the obvious ones from showing on the site (I don't let data about the weather in one city correlate with the weather in a neighboring city, for example), but sometimes they still pop up. If they are related, cool! You found a loophole.
This is exacerbated by the fact that I used "Years" as the base variable. Lots of things happen in a year that are not related to each other! Most studies would use something like "one person" in stead of "one year" to be the "thing" studied. - Observations not independent: For many variables, sequential years are not independent of each other. You will often see trend-lines form. If a population of people is continuously doing something every day, there is no reason to think they would suddenly change how they are doing that thing on January 1. A naive p-value calculation does not take this into account.
You will calculate a lower chance of "randomly" achieving the result than represents reality.
To be more specific: p-value tests are probability values, where you are calculating the probability of achieving a result at least as extreme as you found completely by chance. When calculating a p-value, you need to assert how many "degrees of freedom" your variable has. I count each year (minus one) as a "degree of freedom," but this is misleading for continuous variables.
This kind of thing can creep up on you pretty easily when using p-values, which is why it's best to take it as "one of many" inputs that help you assess the results of your analysis.
- Y-axes doesn't start at zero: I truncated the Y-axes of the graphs above. I also used a line graph, which makes the visual connection stand out more than it deserves.
Nothing against line graphs. They are great at telling a story when you have linear data! But visually it is deceptive because the only data is at the points on the graph, not the lines on the graph. In between each point, the data could have been doing anything. Like going for a random walk by itself!
Mathematically what I showed is true, but it is intentionally misleading. If you click on any of the charts that abuse this, you can scroll down to see a version that starts at zero. - Confounding variable: Confounding variables (like global pandemics) will cause two variables to look connected when in fact a "sneaky third" variable is influencing both of them behind the scenes.
- Outliers: Some datasets here have outliers which drag up the correlation.
In concept, "outlier" just means "way different than the rest of your dataset." When calculating a correlation like this, they are particularly impactful because a single outlier can substantially increase your correlation.
Because this page is automatically generated, I don't know whether any of the charts displayed on it have outliers. I'm just a footnote. ¯\_(ツ)_/¯
I intentionally mishandeled outliers, which makes the correlation look extra strong. - Low n: There are not many data points included in some of these charts.
You can do analyses with low ns! But you shouldn't data dredge with a low n.
Even if the p-value is high, we should be suspicious of using so few datapoints in a correlation.
Pro-tip: click on any correlation to see:
- Detailed data sources
- Prompts for the AI-generated content
- Explanations of each of the calculations (correlation, p-value)
- Python code to calculate it yourself


