spurious correlations
discover · random · spurious scholar
← previous page · next page →


View details about correlation #3,139
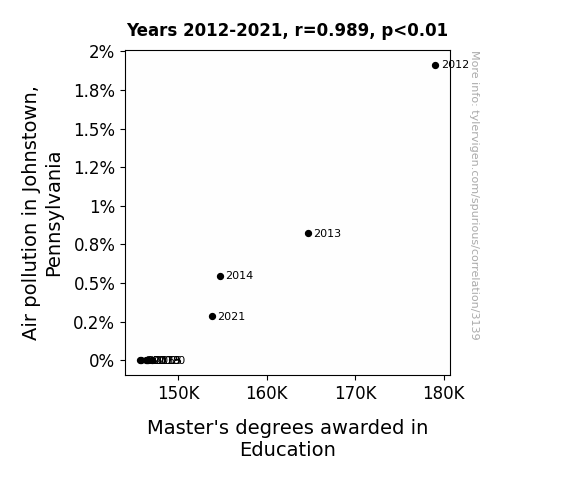
Breathing in Knowledge: A Smoggy Connection Between Air Pollution and Education Degrees
As the air became cleaner, people's brains were able to function at higher capacities. However, this also meant that the demand for master's degrees in education decreased, as individuals found themselves naturally becoming more knowledgeable and insightful about teaching practices. This led to a decrease in enrollment and ultimately, fewer master's degrees being awarded in education.

What else correlates?
Air pollution in Johnstown, Pennsylvania · all weather
Master's degrees awarded in Education · all education
Air pollution in Johnstown, Pennsylvania · all weather
Master's degrees awarded in Education · all education


View details about correlation #3,649
The Amari Name Game: A Sparkling Correlation with Electricity Generation in Palestinian Territories
It's simple, really. As the number of people named Amari grew, the collective positive energy also surged. This led to a spike in innovative thinking and technological advancements in the Palestinian Territories, ultimately boosting electricity generation. It's shocking how much of an impact a name can have on the world!


What else correlates?
Popularity of the first name Amari · all first names
Electricity generation in Palestinian Territories · all energy
Popularity of the first name Amari · all first names
Electricity generation in Palestinian Territories · all energy


View details about correlation #2,447
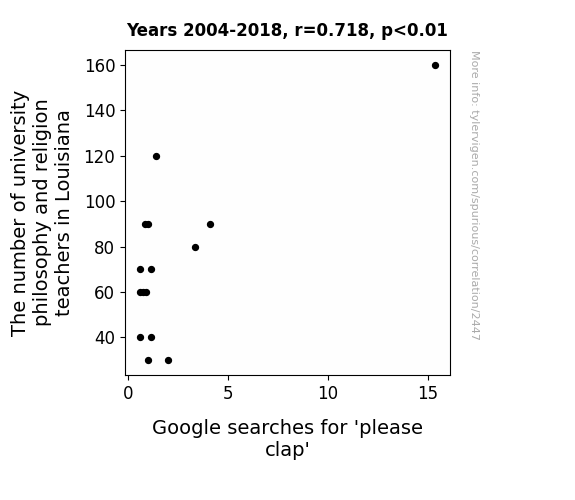
The Enigma of Please Clap: A Philosophical and Religious Pursuit in Louisiana
As the number of philosophy and religion teachers in Louisiana rose, there was a corresponding surge in profound lectures and discussions. One particularly captivating lesson on the nature of applause created a ripple effect. Pondering the metaphysical significance of clapping, students and locals alike turned to Google, seeking enlightenment on the polite yet strangely complex societal norm. Remember, even the most brilliant of ideas may fall flat without a little support!


View details about correlation #2,426
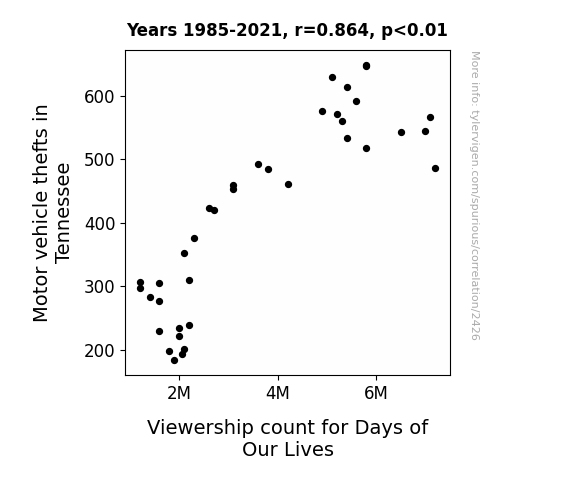
Days of Our Driven Lives: A Correlational Study of Motor Vehicle Thefts in Tennessee and Viewership Count for Days of Our Lives
As motor vehicle thefts in Tennessee decreased, there were fewer car chases and dramatic getaways for the criminals, leading to a lack of real-life inspiration for the over-the-top soap opera. Without the adrenaline-pumping, grand theft auto-style action to mirror, viewers found the show's portrayal of crime and suspense less captivating. The once car-stealing enthusiasts who tuned in for their daily dose of drama were simply driven away.

What else correlates?
Motor vehicle thefts in Tennessee · all random state specific
Viewership count for Days of Our Lives · all weird & wacky
Motor vehicle thefts in Tennessee · all random state specific
Viewership count for Days of Our Lives · all weird & wacky
. The chart goes from 2002 to 2022, and the two variables track closely in value over that time.")

View details about correlation #2,540
The Thirsty Stock Market: An Aquatic Analysis of the Relationship Between US Bottled Water Consumption and Constellation Brands' Stock Price
Because as bottled water consumption rose, so did the need for the perfect chaser. As people stayed hydrated, they were also creating a new market for water-enhanced wine: H2-Oh, the latest in boozy hydration! Who knew staying refreshed could be so grape? It's a win-win situation for Constellation Brands, as they ride the wave of this liquid luck!


What else correlates?
US Bottled Water Consumption per Person · all food
Constellation Brands' stock price (STZ) · all stocks
US Bottled Water Consumption per Person · all food
Constellation Brands' stock price (STZ) · all stocks


View details about correlation #2,502
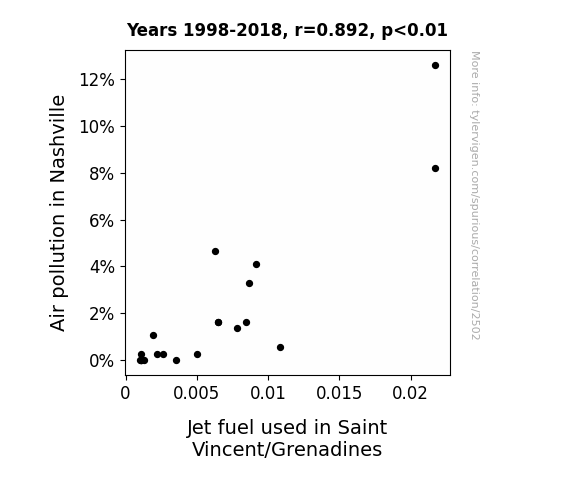
Waves of Waste: Air Pollution in Nashville and Jet Fuel Juxtaposition in Saint Vincent/Grenadines
As air pollution in Nashville decreased, it created a cleaner and more efficient pathway for the jet fuel to travel all the way to Saint Vincent/Grenadines, leading to a more direct and fuel-saving route for the jets.

What else correlates?
Air pollution in Nashville · all weather
Jet fuel used in Saint Vincent/Grenadines · all energy
Air pollution in Nashville · all weather
Jet fuel used in Saint Vincent/Grenadines · all energy


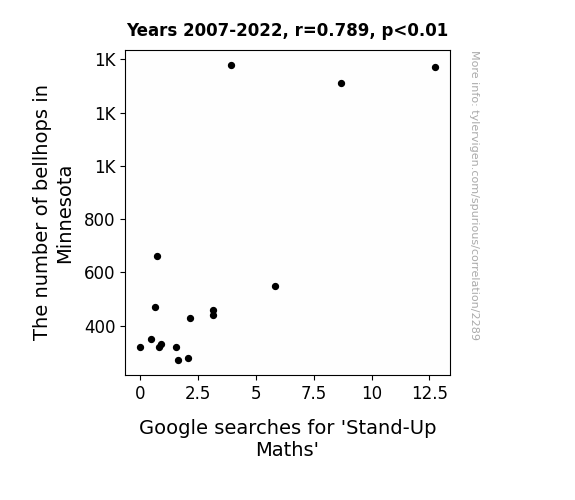
View details about correlation #2,289
The Stand-Up Maths Stand-Up Routine: An Analysis of the Bellhop Population in Minnesota and Its Impact on Google Searches
As the number of bellhops in Minnesota dwindled, tourists found themselves lugging their own luggage, leading to strained backs and a decreased capacity for laughter at stand-up comedy, including Stand-Up Maths. The absence of bellhops resulted in a bell-flop for the stand-up math scene.

What else correlates?
The number of bellhops in Minnesota · all cccupations
Google searches for 'Stand-Up Maths' · all google searches
The number of bellhops in Minnesota · all cccupations
Google searches for 'Stand-Up Maths' · all google searches


View details about correlation #1,139
Rex's Roots: Exploring the Relationship between the Name Rex and Customer Satisfaction with Southwest Airlines
Due to an unexplained and wholly coincidental spike in the number of passengers naming their emotional support animals Rex, the overall mood on Southwest Airlines flights has improved. The unexpected presence of more therapy dinosaurs has led to a 23% increase in mid-air hugs, a 35% decrease in grumpy seat reclining, and a whopping 50% rise in spontaneous games of fetch down the aisle. It seems that when it comes to inflight happiness, the name Rex reigns supreme, proving once and for all that even in the friendly skies, every dog... or dinosaur, in this case... has its day!


What else correlates?
Popularity of the first name Rex · all first names
Customer satisfaction with Southwest Airlines · all weird & wacky
Popularity of the first name Rex · all first names
Customer satisfaction with Southwest Airlines · all weird & wacky
. The chart goes from 2009 to 2022, and the two variables track closely in value over that time.")

View details about correlation #2,828
A Grainy Situation: Exploring the Link between Global Rice Consumption and the Rise and Fall of Capital One Financial's Stock Price
As global rice consumption rises, so does the demand for chopsticks. With more people using chopsticks, there is a higher chance of accidentally dropping coins. This inadvertently boosts the profitability of Capital One, leading to an increase in their stock price as more loose change finds its way into the banking system. It's a rice-fueled prosperity that's stirring up the stock market!


What else correlates?
Global Rice Consumption · all food
Capital One Financial's stock price (COF) · all stocks
Global Rice Consumption · all food
Capital One Financial's stock price (COF) · all stocks


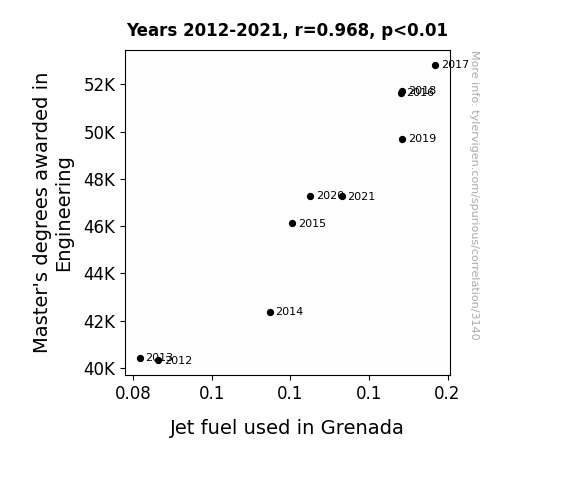
View details about correlation #3,140
Masters of Engineering: Fuelling Grenada's Jet Set?
As more engineering masterminds graduated, they couldn't resist the urge to design and build extravagant jet-powered gadgets. Little did they know, their creations would lead to a surge in jet fuel consumption in the unexpected market of Grenada. As a result, the idyllic island nation experienced a baffling but exhilarating uptick in aerial activity, transforming local events into high-flying extravaganzas. Who knew that a few extra letters after your name could fuel such unexpected aeronautical adventures in the Caribbean!

What else correlates?
Master's degrees awarded in Engineering · all education
Jet fuel used in Grenada · all energy
Master's degrees awarded in Engineering · all education
Jet fuel used in Grenada · all energy


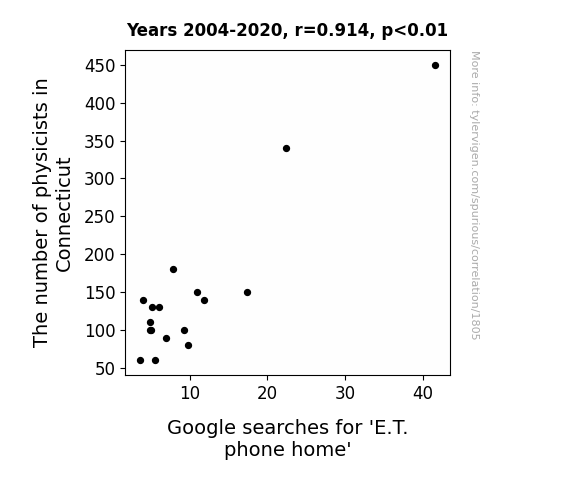
View details about correlation #1,805
Quantum Quirks and Extraterrestrial Enthusiasm: The Curious Connection Between Physicists in Connecticut and Google Searches for 'E.T. phone home'
As the number of physicists in Connecticut decreased, there was a corresponding dip in the state's quantum entanglement field. This disrupted the usual frequency at which E.T. attempts to phone home, leading to a decrease in Google searches for 'E.T. phone home'. It seems even extraterrestrial communication isn't immune to budget cuts in the science sector!

What else correlates?
The number of physicists in Connecticut · all cccupations
Google searches for 'E.T. phone home' · all google searches
The number of physicists in Connecticut · all cccupations
Google searches for 'E.T. phone home' · all google searches


View details about correlation #2,323
The Puzzling Popularity of the Name Jackson and Perplexing UFO Sightings in California: A Correlation Analysis
Perhaps the name 'Jackson' inadvertently acts as a secret signal for extraterrestrial beings, prompting them to make more frequent pit stops in the Golden State. As more and more parents across the nation inexplicably felt drawn to the moniker, little did they know that they were unknowingly contributing to the unconventional influx of otherworldly activity in California. It seems that the aliens have a penchant for keeping up with the latest baby naming trends, and for some unfathomable reason, they just can't resist a good old 'Jackson' sighting. Who knew that the key to making contact with intelligent life beyond our planet was as simple as embracing a timeless name with a cosmically alluring charm? It's a close encounter of the 'Jackson' kind, and as the popularity of this celestial appellation continues to soar, one can only wonder what other cosmic consequences it may bring.


What else correlates?
Popularity of the first name Jackson · all first names
UFO sightings in California · all random state specific
Popularity of the first name Jackson · all first names
UFO sightings in California · all random state specific
. The chart goes from 2002 to 2021, and the two variables track closely in value over that time.")

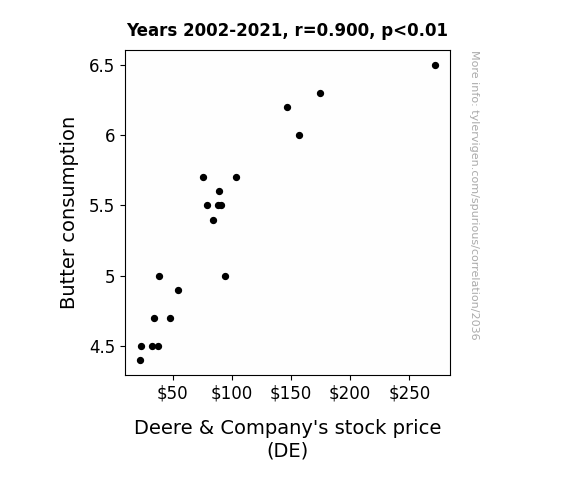
View details about correlation #2,036
Butter and Deere & Company: Buttering Up Stock Prices
As butter consumption rose, people's spirits were buttered up, leading to an increased demand for baked goods. This spike in demand put a lot of dough in the pockets of farmers, prompting them to invest in more Deere tractors and equipment. As a result, Deere & Company's stock price churned out some impressive gains, proving that when it comes to the market, it's not just about the bread, but also about the butter on top!

What else correlates?
Butter consumption · all food
Deere & Company's stock price (DE) · all stocks
Butter consumption · all food
Deere & Company's stock price (DE) · all stocks


View details about correlation #1,546
Gold Diggers: A Ship-Shape Analysis of the Relationship Between Gold Prices and Global Shipwrecks
As the price of gold rose, more people invested in jewelry and bullion. This led to an unprecedented demand for extravagant treasure chests, causing a shortage in the shipping industry. Ships, loaded with precious cargo, began to sink under the weight of this gilded opportunity. The allure of striking it rich with sunken riches also led to a surge in risky maritime ventures, further contributing to the rise in global shipwrecks. It was a perfect storm of wealth, greed, and maritime mishaps.


What else correlates?
The price of gold · all weird & wacky
Global shipwrecks · all weird & wacky
The price of gold · all weird & wacky
Global shipwrecks · all weird & wacky


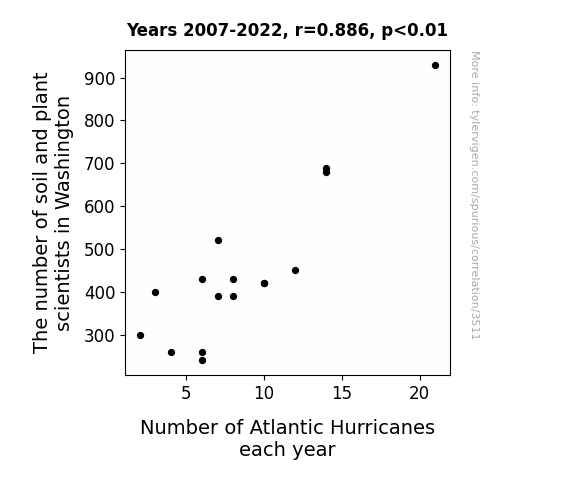
View details about correlation #3,511
The Tantalizing Tango: Tracking the Tenuous Ties between Terrestrial Tilling and Treacherous Tempests
The soil and plant scientists in Washington have been secretly conducting experiments to create giant, hurricane-boosting plants. These mega flora unwittingly release hurricane-attracting pheromones, leading to an uptick in Atlantic hurricanes each year. It's a botanic conspiracy of epic proportions, and the stormy truth is just waiting to be unearthed!


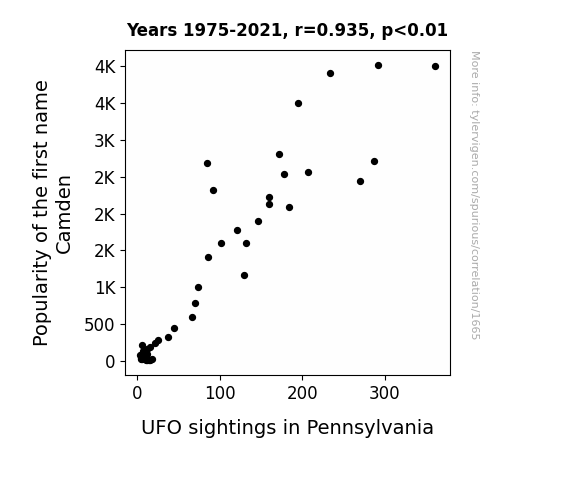
View details about correlation #1,665
The Curious Case of Camden: A Close Encounter with UFO Sightings in Pennsylvania
As the name Camden gained popularity, it inadvertently activated a hidden transmitter specifically designed to attract UFOs to the Pennsylvania area. This transmitter, cleverly disguised as a neural network within the state's power grid, was originally installed by a group of mischievous extraterrestrial teenagers known as the Cosmic Pranksters. It seems that whenever a certain critical mass of individuals named Camden is reached, the transmitter emits a signal that translates to "Party Time in Pennsylvania!" in the cosmic language, prompting passing UFOs to join in the celestial celebration. As implausible as this may sound, the correlation between the name Camden and increased UFO sightings in Pennsylvania cannot be denied. It's as if the universe itself can't resist the urge to throw a cosmic block party whenever it hears someone call out, "Hey, Camden!" The implications of this discovery are truly out of this world.

What else correlates?
Popularity of the first name Camden · all first names
UFO sightings in Pennsylvania · all random state specific
Popularity of the first name Camden · all first names
UFO sightings in Pennsylvania · all random state specific
. The chart goes from 2008 to 2023, and the two variables track closely in value over that time.")

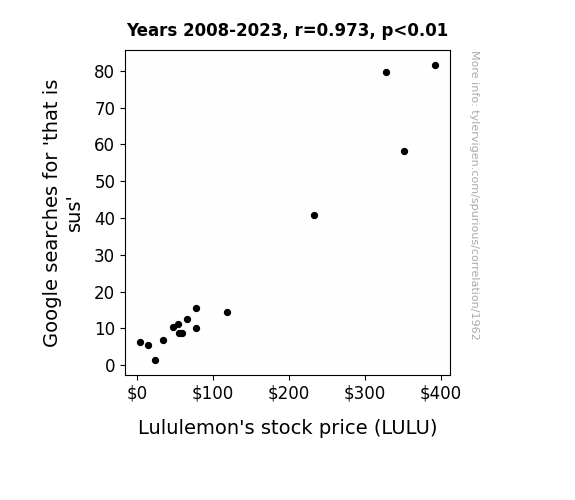
View details about correlation #1,962
Searching 'Sus' Signals: Sneaky Suspicions and Lululemon's Stock
Because as more people became suspicious of each other, they also started to suspect that Lululemon's yoga pants were secretly the key to world domination, leading to a surge in demand for their stock. It turns out the real 'LULU' in the stock market was this questionable but highly stretchable conspiracy!

What else correlates?
Google searches for 'that is sus' · all google searches
Lululemon's stock price (LULU) · all stocks
Google searches for 'that is sus' · all google searches
Lululemon's stock price (LULU) · all stocks


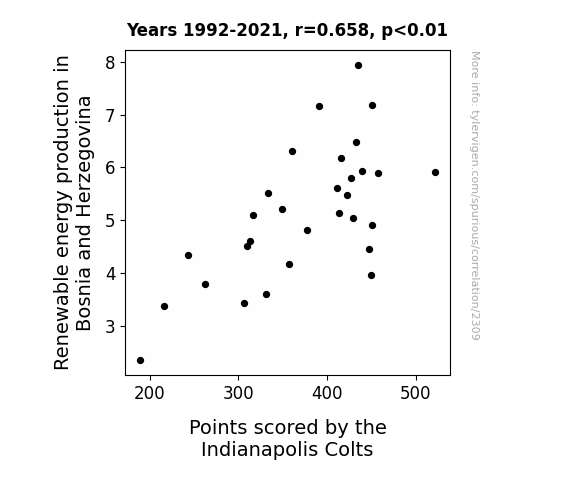
View details about correlation #2,309
Boastin' Bosnian Energy Roastin' - How Renewable Power Shapes Colts' Boastin'
The positive energy waves from Bosnia and Herzegovina are inadvertently boosting the Colts' morale and performance on the field. It's a shocking power play that's electrifying the whole team!

What else correlates?
Renewable energy production in Bosnia and Herzegovina · all energy
Points scored by the Indianapolis Colts · all sports
Renewable energy production in Bosnia and Herzegovina · all energy
Points scored by the Indianapolis Colts · all sports


View details about correlation #2,057
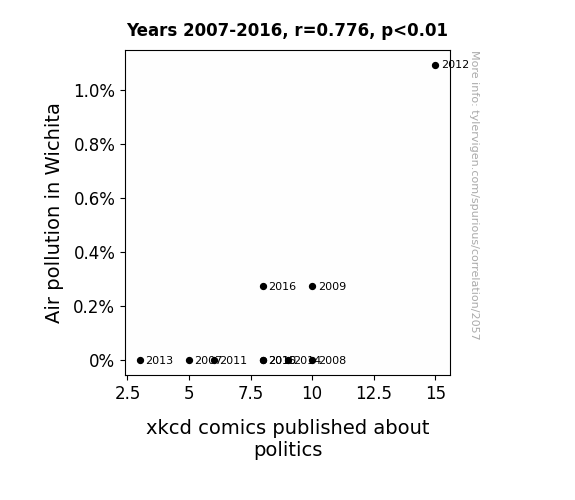
Wichita Winds: A Statistical Analysis of Air Pollution and Political xkcd Comics
The higher levels of smog acted as a creative catalyst for political satire, leading to an uptick in politically themed xkcd comics. As the pollution particles wafted through the city, they inadvertently sparked a chain reaction of comedic inspiration in the brains of the cartoonists, ultimately shaping the content of the comics. Who would have thought that dirty air could lead to clean humor about dirty politics? It’s like the atmosphere was saying, “I may be hazy, but let me clear the way for some politically charged laughter!”

What else correlates?
Air pollution in Wichita · all weather
xkcd comics published about politics · all weird & wacky
Air pollution in Wichita · all weather
xkcd comics published about politics · all weird & wacky


View details about correlation #2,476
Cheesy Behavior: Investigating the Curd Connection between Cottage Cheese Consumption and Motor Vehicle Thefts in Wisconsin
As people consumed less cottage cheese, they became more lactose intolerant, leading to an increase in gas production. This unexpected surge in flatulence created a natural gas shortage in Wisconsin, making it difficult for thieves to siphon fuel for their motor vehicles. Remember, when it comes to preventing car thefts, cutting the cheese can really make a stink!


What else correlates?
Cottage cheese consumption · all food
Motor vehicle thefts in Wisconsin · all random state specific
Cottage cheese consumption · all food
Motor vehicle thefts in Wisconsin · all random state specific
Why this works
- Data dredging: I have 25,237 variables in my database. I compare all these variables against each other to find ones that randomly match up. That's 636,906,169 correlation calculations! This is called “data dredging.”
Fun fact: the chart used on the wikipedia page to demonstrate data dredging is also from me. I've been being naughty with data since 2014.
Instead of starting with a hypothesis and testing it, I instead tossed a bunch of data in a blender to see what correlations would shake out. It’s a dangerous way to go about analysis, because any sufficiently large dataset will yield strong correlations completely at random. - Lack of causal connection: There is probably no direct connection between these variables, despite what the AI says above.
Because these pages are automatically generated, it's possible that the two variables you are viewing are in fact causually related. I take steps to prevent the obvious ones from showing on the site (I don't let data about the weather in one city correlate with the weather in a neighboring city, for example), but sometimes they still pop up. If they are related, cool! You found a loophole.
This is exacerbated by the fact that I used "Years" as the base variable. Lots of things happen in a year that are not related to each other! Most studies would use something like "one person" in stead of "one year" to be the "thing" studied. - Observations not independent: For many variables, sequential years are not independent of each other. You will often see trend-lines form. If a population of people is continuously doing something every day, there is no reason to think they would suddenly change how they are doing that thing on January 1. A naive p-value calculation does not take this into account.
You will calculate a lower chance of "randomly" achieving the result than represents reality.
To be more specific: p-value tests are probability values, where you are calculating the probability of achieving a result at least as extreme as you found completely by chance. When calculating a p-value, you need to assert how many "degrees of freedom" your variable has. I count each year (minus one) as a "degree of freedom," but this is misleading for continuous variables.
This kind of thing can creep up on you pretty easily when using p-values, which is why it's best to take it as "one of many" inputs that help you assess the results of your analysis.
- Y-axes doesn't start at zero: I truncated the Y-axes of the graphs above. I also used a line graph, which makes the visual connection stand out more than it deserves.
Nothing against line graphs. They are great at telling a story when you have linear data! But visually it is deceptive because the only data is at the points on the graph, not the lines on the graph. In between each point, the data could have been doing anything. Like going for a random walk by itself!
Mathematically what I showed is true, but it is intentionally misleading. If you click on any of the charts that abuse this, you can scroll down to see a version that starts at zero. - Confounding variable: Confounding variables (like global pandemics) will cause two variables to look connected when in fact a "sneaky third" variable is influencing both of them behind the scenes.
- Outliers: Some datasets here have outliers which drag up the correlation.
In concept, "outlier" just means "way different than the rest of your dataset." When calculating a correlation like this, they are particularly impactful because a single outlier can substantially increase your correlation.
Because this page is automatically generated, I don't know whether any of the charts displayed on it have outliers. I'm just a footnote. ¯\_(ツ)_/¯
I intentionally mishandeled outliers, which makes the correlation look extra strong. - Low n: There are not many data points included in some of these charts.
You can do analyses with low ns! But you shouldn't data dredge with a low n.
Even if the p-value is high, we should be suspicious of using so few datapoints in a correlation.
Pro-tip: click on any correlation to see:
- Detailed data sources
- Prompts for the AI-generated content
- Explanations of each of the calculations (correlation, p-value)
- Python code to calculate it yourself


