spurious correlations
discover · random · spurious scholar
← previous page · next page →


View details about correlation #5,587
The Meme's the Limit: A Kermitment to Likes on Casually Explained YouTube Videos
People just couldn't handle the lack of "kermitment" anymore. The green wave of laughter and relatable content was missing, leaving fans feeling a tad "unhoppy." It seems the meme world croaked, taking the popular vote with it.


What else correlates?
Popularity of the 'kermit' meme · all memes
Total likes of Casually Explained YouTube videos · all YouTube
Popularity of the 'kermit' meme · all memes
Total likes of Casually Explained YouTube videos · all YouTube


View details about correlation #5,451
The Odds are in their Favor: 2 Good 2 Be True - A Correlational Study of Libertarian Votes and the Winning Mega Millions Numbers in Colorado
As the Libertarian philosophy of individual freedom and minimal government intervention gained traction in Colorado, it inadvertently led to a surge in 2-related positivity. This subtle yet influential mindset shift created a metaphysical connection to the Mega Millions drawing, causing the number 2 to exude an inexplicable charm. Perhaps it's the idea of doubling down on personal choices or the symbolic representation of peace, but one thing's for sure - in the cosmic lottery of life, the Libertarian 2 phenomenon was a sure bet for amusement!


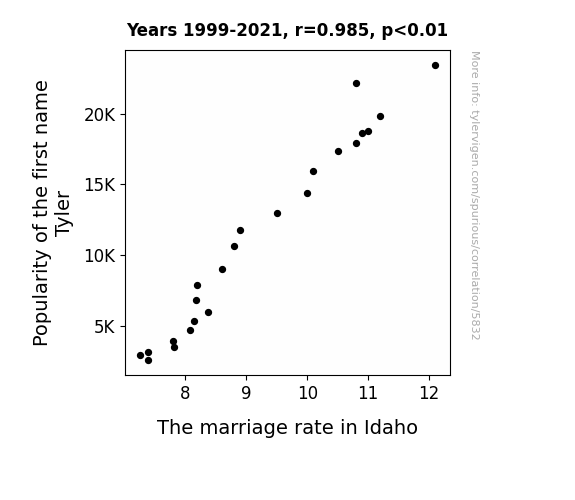
View details about correlation #5,832
What else correlates?
Popularity of the first name Tyler · all first names
The marriage rate in Idaho · all random state specific
Popularity of the first name Tyler · all first names
The marriage rate in Idaho · all random state specific


View details about correlation #5,358
Air Quality in Bakersfield: Does Samoa's Jet Fuel Cause a Yield?
The improved air quality in Bakersfield led to clearer skies, creating the perfect conditions for skywriters to showcase their aerial skills, causing a surge in demand for jet fuel in Samoa. Looks like Bakersfield's clean air is giving the phrase "sky's the limit" a whole new meaning!


What else correlates?
Air quality in Bakersfield, California · all weather
Jet fuel used in Samoa · all energy
Air quality in Bakersfield, California · all weather
Jet fuel used in Samoa · all energy


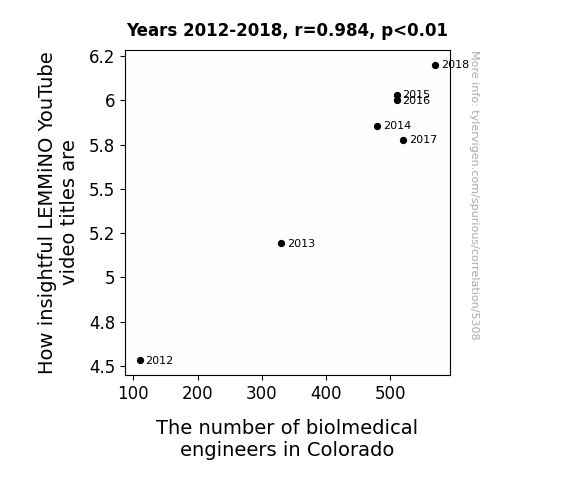
View details about correlation #5,308
Unraveling the Tightly Wound: LEMMiNO YouTube Video Titles and the Biomedical Engineering Boom in Colorado
The biolmedical engineers in Colorado are just really good at bringing clarity to complex topics. They're experts at shedding light on intricate systems, so it's no wonder they're influencing those LEMMiNO titles to be so insightful. It's like they're bio-miracle workers of video enlightenment!


View details about correlation #5,439
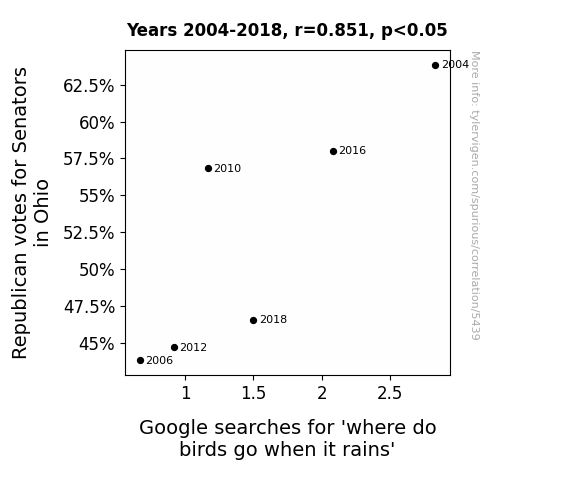
The Flock and the Ballot Box: A Correlational Study of Republican Votes for Senators in Ohio and Google Searches for 'Where Do Birds Go When it Rains'
The decrease in Republican votes for Senators in Ohio caused a shift in the political climate, leading to a bird-brained policy change. This in turn prompted our fine feathered friends to seek new habitats in a game of poli-seed-ings instead of just winging it when it rained. It seems like even the birds couldn't resist getting involved in some elec-tweet-toral behavior!


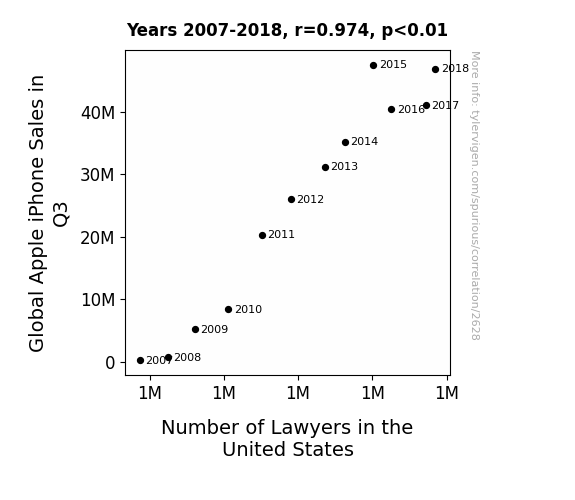
View details about correlation #2,628
What else correlates?
Global Apple iPhone Sales in Q3 · all weird & wacky
Number of Lawyers in the United States · all weird & wacky
Global Apple iPhone Sales in Q3 · all weird & wacky
Number of Lawyers in the United States · all weird & wacky


View details about correlation #5,003
Gasping for Air: The Correlation Between Air Quality in Tucson, Arizona, and Liquefied Petroleum Gas Usage in France
As the air quality in Tucson improved, it created a domino effect of positivity that resonated across the globe. The cleaner air somehow led to a surge in productivity in the LPG industry in France, as if the molecules of fresh Tucson air were whispering motivational quotes to the LPG producers in France, inspiring them to ramp up their production. It's almost as if Mother Nature said, "Hey, Tucson's air is top-notch now, let's spread the love to the LPG industry in France and keep those grills and stoves running smoothly!" It's an unexpected, whimsical connection that no one saw coming, but hey, maybe cleaner air really does have the power to fuel the LPG industry in the most delightful, inexplicable way!


What else correlates?
Air quality in Tucson, Arizona · all weather
Liquefied petroleum gas used in France · all energy
Air quality in Tucson, Arizona · all weather
Liquefied petroleum gas used in France · all energy


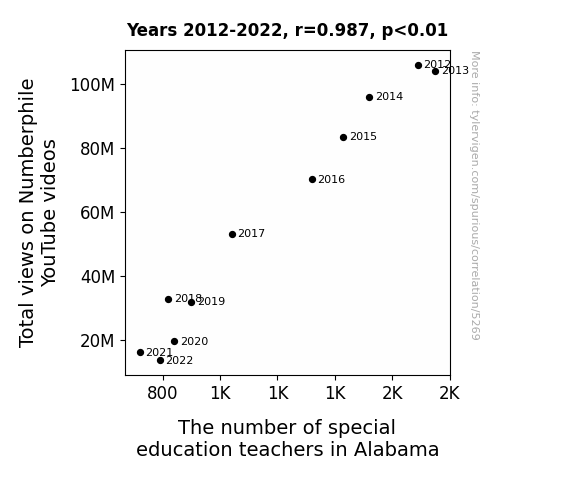
View details about correlation #5,269
Total Views on Trippy Numberphile and The Tricky Tally of Special Education Teachers in Alabama: A Ten-Year Tale
As Total views on Numberphile YouTube videos decreased, fewer people were exposed to the beauty of numbers and mathematics. This led to a decline in the number of individuals pursuing careers in math-related fields, including special education. As a result, Alabama saw a decrease in the number of special education teachers, creating a numerical conundrum for the state.


View details about correlation #5,229
Ain't Nobody Got Time for That: A Meme-tastic Analysis of the Relationship between Pop Culture and Political Preferences
As the 'aint nobody got time for that' meme gained traction, it led to an unexpected ripple effect in Massachusetts. This internet sensation sparked a subconscious association with efficiency and time management. Unwittingly, voters began to align the meme's dismissive attitude with their perceptions of certain political candidates. This led to an increase in Republican votes for Senators in Massachusetts as voters subconsciously gravitated towards candidates they perceived as no-nonsense and focused on getting things done.


View details about correlation #5,902

What else correlates?
Blue cheese consumption · all food
Google searches for 'i cant even' · all google searches
Blue cheese consumption · all food
Google searches for 'i cant even' · all google searches


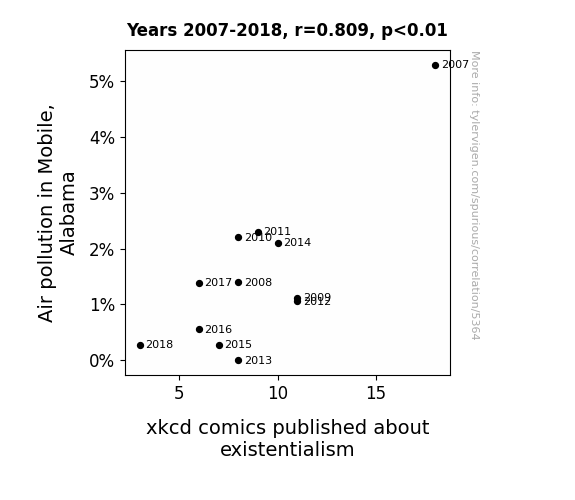
View details about correlation #5,364
The Thin Air Thin Line: Examining the Correlation Between Air Pollution in Mobile, Alabama and xkcd Comics on Existentialism
As the air quality improved, the local population found themselves less existential, leading to a decreased demand for xkcd comics on the topic. Alternatively, the existential angst in the xkcd creator was mysteriously tied to the pollution levels in Mobile, prompting a shift in comic themes.

What else correlates?
Air pollution in Mobile, Alabama · all weather
xkcd comics published about existentialism · all weird & wacky
Air pollution in Mobile, Alabama · all weather
xkcd comics published about existentialism · all weird & wacky


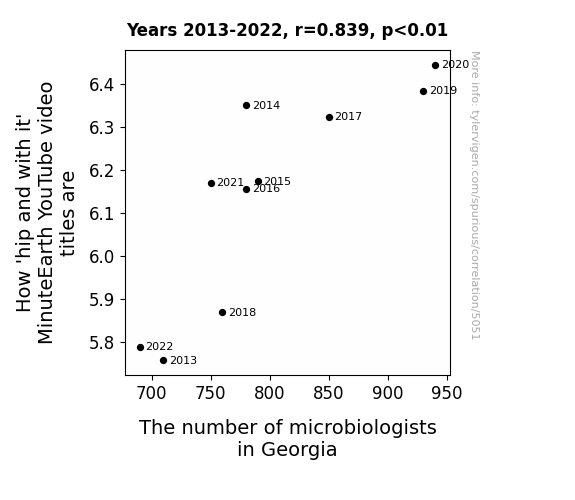
View details about correlation #5,051
The Rhyme and Reason Behind MinuteEarth’s Title: A Microscopic Analysis of Microbiologists in Georgia
As MinuteEarth videos get hipper and wither, more people in Georgia start to pursue careers in microbiology to impress their friends with their knowledge of tiny, trendy topics. It's a real competition to see who's the coolest microbe enthusiast in the Peach State! Remember, it's not the size of the microscope, it's how you use it to stay micro-fabulous!


View details about correlation #4,323
Wind and Libertarians: A Tandem Too Tempting to Ignore
As the saying goes, everything's bigger in Texas - including the support for Libertarian ideals. This surge in Libertarian votes somehow created a butterfly effect that reached all the way to the serene mountains of Bhutan, inspiring their commitment to renewable energy. Who knew that Lone Star liberty could lead to a thunder dragon's passion for green power? It's a political paradox with a renewable twist!

What else correlates?
Votes for Libertarian Senators in Texas · all elections
Renewable energy production in Bhutan · all energy
Votes for Libertarian Senators in Texas · all elections
Renewable energy production in Bhutan · all energy


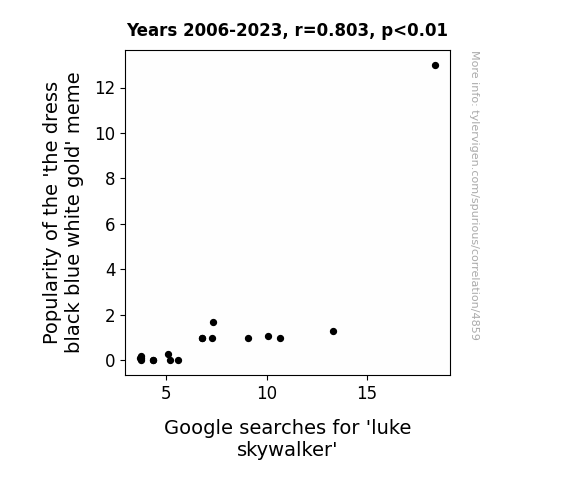
View details about correlation #4,859


View details about correlation #4,981
Breath of Fresh Air: Examining the Relationship Between Air Pollution in Columbia, South Carolina and U.S. Triplet Birth Rates
The cleaner air led to fewer airborne fertility-enhancing particles, causing a decline in the occurrence of naturally conceived triplets or more in the area. As a result, there was a noticeable decrease in the birth rates of these rare, but remarkable, multiples.


What else correlates?
Air pollution in Columbia, South Carolina · all weather
US birth rates of triplets or more · all weird & wacky
Air pollution in Columbia, South Carolina · all weather
US birth rates of triplets or more · all weird & wacky


View details about correlation #5,719
The Texas Tango: Tracing the Ties between Anthropology and Archeology Teachers and Total comments on Be Smart YouTube videos
The influx of anthropologists and archeologists in Texas led to a sudden spike in ancient communication techniques being employed by the locals, sparking a newfound interest in leaving comments on educational videos. It's a real case of hieroglyphic hype and prehistoric puns that's unearthing a buried passion for engaging with Be Smart content! It seems like everything is bigger in Texas, including the enthusiasm for discussing our shared human history. Digging up the past has never been so comment-worthy!


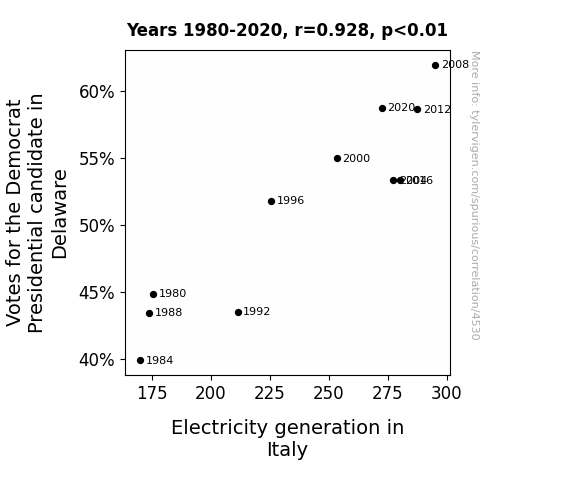
View details about correlation #4,530
Delaware's Blue Gales and Italy's WATT-A Connection: A Shocking Correlation Between Votes for the Democrat Presidential Candidate and Electricity Generation
It's a shocking revelation, but as the support for the Democrat candidate in Delaware surges, so does the power! It seems like the Italian electricity grid just can't resist conducting the energy of political change across the Atlantic. Who knew that the spark of democracy in one place could light up homes in another? It's a real power play, proving that when it comes to politics and electricity, the currents of influence know no bounds!

What else correlates?
Votes for the Democratic Presidential candidate in Delaware · all elections
Electricity generation in Italy · all energy
Votes for the Democratic Presidential candidate in Delaware · all elections
Electricity generation in Italy · all energy


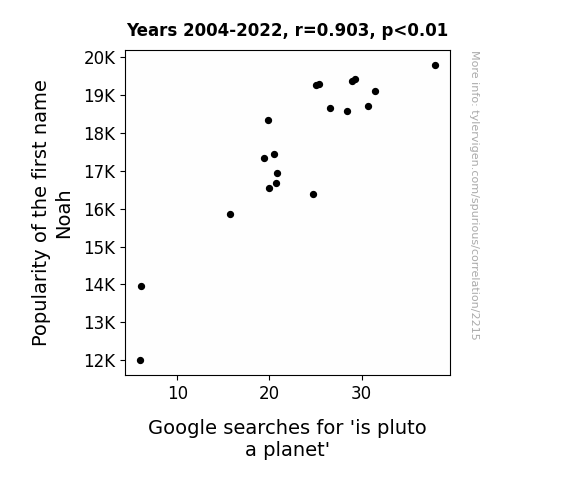
View details about correlation #2,215
What else correlates?
Popularity of the first name Noah · all first names
Google searches for 'is pluto a planet' · all google searches
Popularity of the first name Noah · all first names
Google searches for 'is pluto a planet' · all google searches


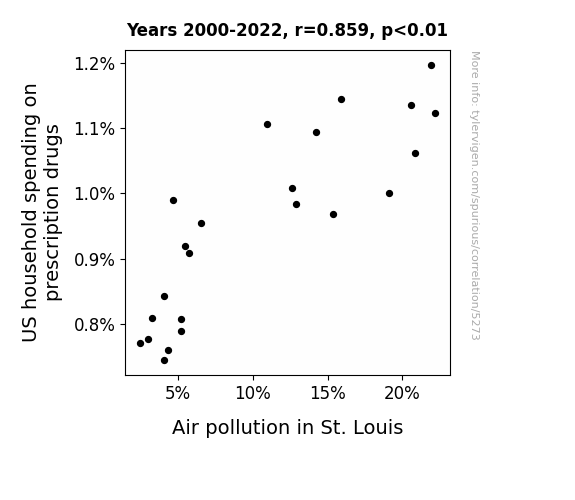
View details about correlation #5,273
The Wheezy Connection: A Breath of Fresh Air on US Household Spending and Air Pollution in St. Louis
With fewer prescription drugs being purchased, there were fewer unused pill bottles to be thrown away. This led to a decreased demand for manufacturing plastic pill bottles, which in turn lowered the industrial emissions in St. Louis.

What else correlates?
US household spending on prescription drugs · all weird & wacky
Air pollution in St. Louis · all weather
US household spending on prescription drugs · all weird & wacky
Air pollution in St. Louis · all weather
Why this works
- Data dredging: I have 25,237 variables in my database. I compare all these variables against each other to find ones that randomly match up. That's 636,906,169 correlation calculations! This is called “data dredging.”
Fun fact: the chart used on the wikipedia page to demonstrate data dredging is also from me. I've been being naughty with data since 2014.
Instead of starting with a hypothesis and testing it, I instead tossed a bunch of data in a blender to see what correlations would shake out. It’s a dangerous way to go about analysis, because any sufficiently large dataset will yield strong correlations completely at random. - Lack of causal connection: There is probably no direct connection between these variables, despite what the AI says above.
Because these pages are automatically generated, it's possible that the two variables you are viewing are in fact causually related. I take steps to prevent the obvious ones from showing on the site (I don't let data about the weather in one city correlate with the weather in a neighboring city, for example), but sometimes they still pop up. If they are related, cool! You found a loophole.
This is exacerbated by the fact that I used "Years" as the base variable. Lots of things happen in a year that are not related to each other! Most studies would use something like "one person" in stead of "one year" to be the "thing" studied. - Observations not independent: For many variables, sequential years are not independent of each other. You will often see trend-lines form. If a population of people is continuously doing something every day, there is no reason to think they would suddenly change how they are doing that thing on January 1. A naive p-value calculation does not take this into account.
You will calculate a lower chance of "randomly" achieving the result than represents reality.
To be more specific: p-value tests are probability values, where you are calculating the probability of achieving a result at least as extreme as you found completely by chance. When calculating a p-value, you need to assert how many "degrees of freedom" your variable has. I count each year (minus one) as a "degree of freedom," but this is misleading for continuous variables.
This kind of thing can creep up on you pretty easily when using p-values, which is why it's best to take it as "one of many" inputs that help you assess the results of your analysis.
- Y-axes doesn't start at zero: I truncated the Y-axes of the graphs above. I also used a line graph, which makes the visual connection stand out more than it deserves.
Nothing against line graphs. They are great at telling a story when you have linear data! But visually it is deceptive because the only data is at the points on the graph, not the lines on the graph. In between each point, the data could have been doing anything. Like going for a random walk by itself!
Mathematically what I showed is true, but it is intentionally misleading. If you click on any of the charts that abuse this, you can scroll down to see a version that starts at zero. - Confounding variable: Confounding variables (like global pandemics) will cause two variables to look connected when in fact a "sneaky third" variable is influencing both of them behind the scenes.
- Outliers: Some datasets here have outliers which drag up the correlation.
In concept, "outlier" just means "way different than the rest of your dataset." When calculating a correlation like this, they are particularly impactful because a single outlier can substantially increase your correlation.
Because this page is automatically generated, I don't know whether any of the charts displayed on it have outliers. I'm just a footnote. ¯\_(ツ)_/¯
I intentionally mishandeled outliers, which makes the correlation look extra strong. - Low n: There are not many data points included in some of these charts.
You can do analyses with low ns! But you shouldn't data dredge with a low n.
Even if the p-value is high, we should be suspicious of using so few datapoints in a correlation.
Pro-tip: click on any correlation to see:
- Detailed data sources
- Prompts for the AI-generated content
- Explanations of each of the calculations (correlation, p-value)
- Python code to calculate it yourself


