spurious correlations
discover · random · spurious scholar
← previous page · next page →


View details about correlation #2,764
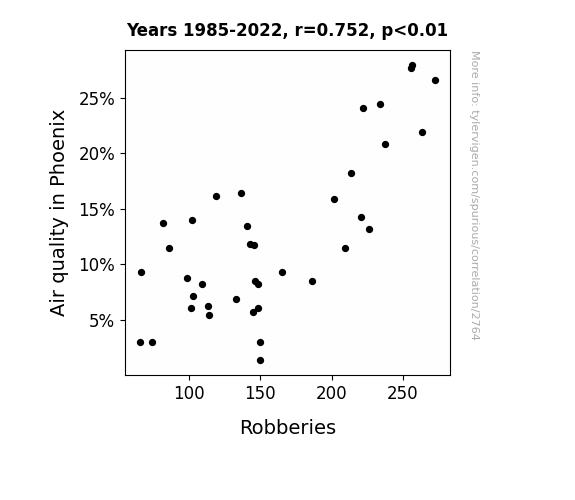
Pulverized Particles Propel Pilfering: The Peculiar Connection between Phoenix Air Quality and Robberies
The fresher air put everyone in a better mood, making them less likely to resort to crime. Plus, the robbers had so much more energy from breathing in that clean desert air, allowing them to pull off heists with newfound vigor. They were practically doing cardio while committing larceny! Who knew clean air could lead to such a crime wave of positivity!

What else correlates?
Air quality in Phoenix · all weather
Robberies in the US · all random state specific
Air quality in Phoenix · all weather
Robberies in the US · all random state specific


View details about correlation #1,196
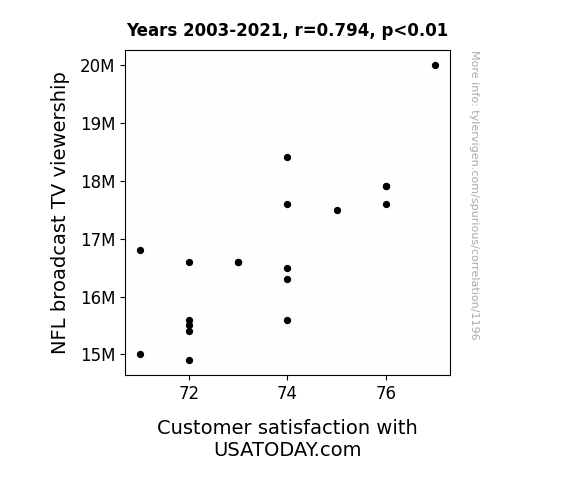
Tackling the Touchdowns: The Gridiron Grin of NFL Broadcast TV Viewership and USATODAY.com Customer Satisfaction
The more football people watched, the happier they were, leading to a general sense of positivity and contentment when visiting USATODAY.com, where even the news seemed just a little bit better after a big game. Remember, happiness is just a touchdown away!

What else correlates?
NFL broadcast TV viewership · all weird & wacky
Customer satisfaction with USATODAY.com · all weird & wacky
NFL broadcast TV viewership · all weird & wacky
Customer satisfaction with USATODAY.com · all weird & wacky


View details about correlation #3,218
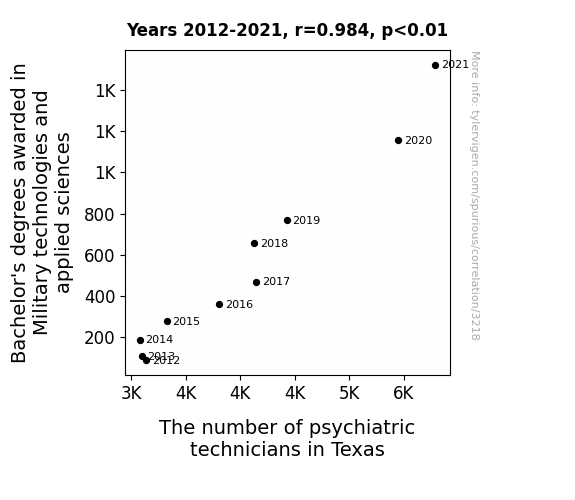
Ammunition of the Mind: Exploring the Relationship Between Bachelor's Degrees in Military Technologies and Applied Sciences and the Employment of Psychiatric Technicians in Texas
As more military technology and applied sciences graduates entered the workforce, there was a surge in innovative and out-of-the-box thinking in the field of psychiatric care. These new technicians were just better at defusing tense situations.


View details about correlation #2,756
The Cotton Connection: Mollie Madness and GMO Galore in Alabama
As the name Mollie fell out of favor, fewer people were willing to m-ollie-coddle the genetically modified cotton industry in Alabama. It seems that Mollie's were no longer ginning up the same level of support for GMO cotton, leading to a bale-ful situation for the industry. It's a real name game, but it looks like Mollie's unpopularity may have been the fabric holding back GMO use in Alabama.


What else correlates?
Popularity of the first name Mollie · all first names
GMO use in cotton in Alabama · all food
Popularity of the first name Mollie · all first names
GMO use in cotton in Alabama · all food


View details about correlation #3,256
Rolling in the Sun: A Fishy Connection Between Solar Power in Morocco and Google Searches for Sushi
The sea-themed solar panels are clearly sending out some strong sashimi vibes, attracting more people to crave a raw fish fix. It's like the sun is telling everyone, "Don't worry, be happy, and just keep sashimi-ling". Who knew that renewable energy could also power up people's appetite for sushi! Just goes to show, when it comes to raw fish and renewable power, the connection is un-bAYE-sash! After all, nothing is fishy about the fact that solar power in Morocco is reely making a splash in the sushi scene near you!


What else correlates?
Solar power generated in Morocco · all energy
Google searches for 'sushi near me' · all google searches
Solar power generated in Morocco · all energy
Google searches for 'sushi near me' · all google searches
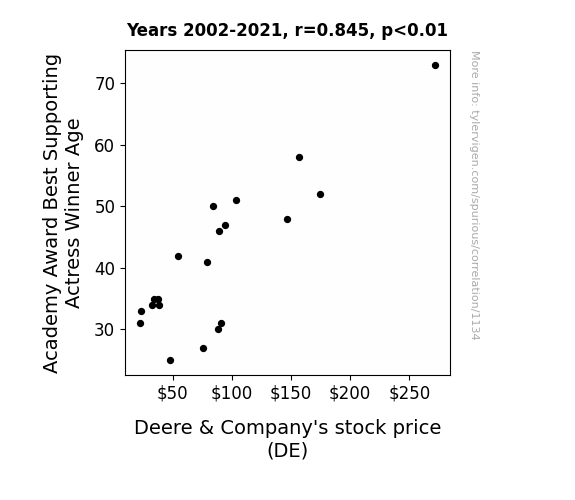
. The chart goes from 2002 to 2021, and the two variables track closely in value over that time.")

View details about correlation #1,134
Supporting Actuarial Age: An Unconventional Correlation Between Academy Award Best Supporting Actress Winner Age and Deere & Company's Stock Price
As Best Supporting Actress winners get older, they develop a greater appreciation for life's wisdom and strength, reflecting the growth and stability of Deere & Company. Their maturity brings a sense of groundedness that resonates with the company's long-standing values, ultimately boosting investor confidence in DE. This results in a seasoned effect on the stock price, as if each award-winning actress is plowing the fields of success for Deere & Company, sowing the seeds of prosperity with their seasoned skill set. The golden touch of experience from these esteemed actresses seems to cultivate a bullish market for DE, proving that in the world of finance, age is more than just a number – it's a tractor of change.

What else correlates?
Academy Award Best Supporting Actress Winner Age · all weird & wacky
Deere & Company's stock price (DE) · all stocks
Academy Award Best Supporting Actress Winner Age · all weird & wacky
Deere & Company's stock price (DE) · all stocks


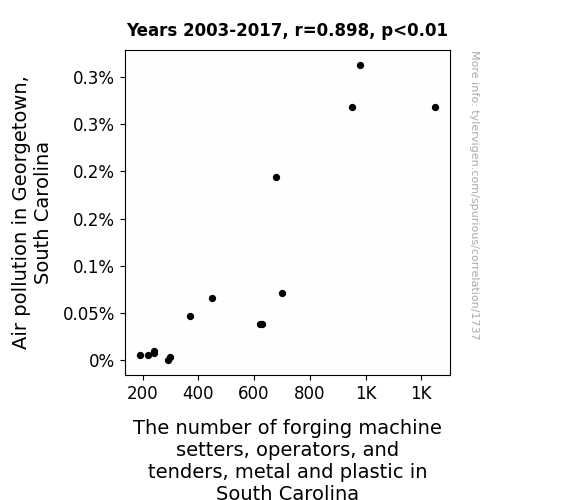
View details about correlation #1,737
The CorROSive Connection: Air Pollution and the Impact on Forging Machine Setters, Operators, and Tenders, Metal and Plastic in South Carolina
As the air became cleaner, the metal and plastic forgery industry began to struggle. The once smog-enhanced superheated metal pieces now lacked that extra pizzazz, leading to a decrease in quality. Additionally, the forging machine operators, so used to the adrenaline rush of working in a pollution-filled environment, found themselves oddly unmotivated in the newly pristine air. It seems like clean air not only clears the lungs but also clears out the forging business!


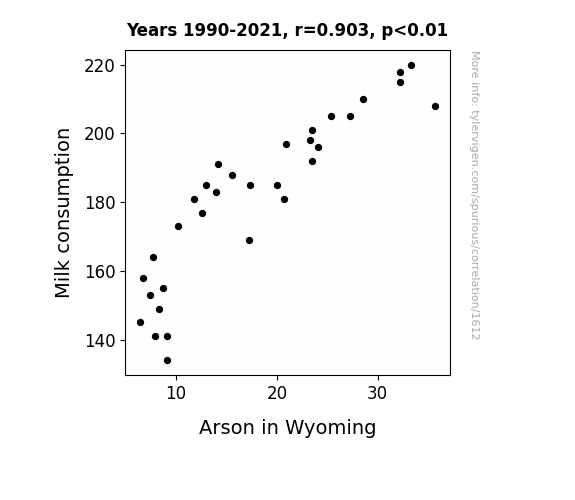
View details about correlation #1,612
Got Milk? Exploring the Udderly Bizarre Relationship Between Milk Consumption and Arson in Wyoming
As milk consumption decreased, there was a subsequent decrease in the production of lactose, which is a sugar. With less lactose in people's systems, there were fewer flammable fart incidents, ultimately leading to a decrease in accidental fires and therefore a decrease in arson in Wyoming.

What else correlates?
Milk consumption · all food
Arson in Wyoming · all random state specific
Milk consumption · all food
Arson in Wyoming · all random state specific


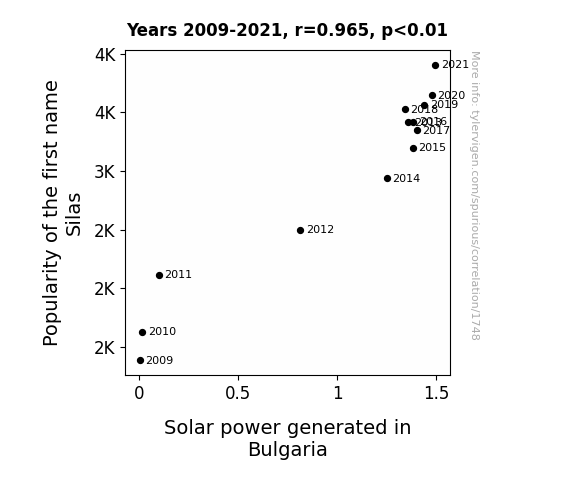
View details about correlation #1,748
Shining Silas: Illuminating the Correlation between the Name Popularity of Silas and Solar Power Generation in Bulgaria
Because every time someone named Silas waved, it looked like they were signaling for solar power, and the strong Bulgarian sun took it as a cue to shine even brighter.

What else correlates?
Popularity of the first name Silas · all first names
Solar power generated in Bulgaria · all energy
Popularity of the first name Silas · all first names
Solar power generated in Bulgaria · all energy


View details about correlation #1,180
Smoke and Mirrors: The Relationship Between US Tobacco Production and Number of Slot Machines in Nevada
As US tobacco production decreased, there was less secondhand smoke to create that authentic smoky casino atmosphere. With fewer people smoking, there was a reduced demand for slot machines as smoking and gambling went hand in hand. The realization dawned that slot machines can't function on secondhand smoke alone, and so the number of slot machines in Nevada stubbed out along with the decline in tobacco production.


What else correlates?
US Tobacco Production · all weird & wacky
Number of Slot Machines in Nevada · all weird & wacky
US Tobacco Production · all weird & wacky
Number of Slot Machines in Nevada · all weird & wacky


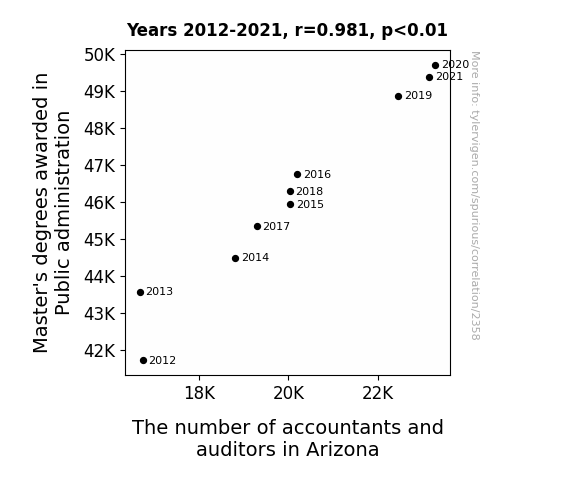
View details about correlation #2,358
Degrees of Accounting: Exploring the Auditing Effects of Public Administration Master's Degrees in Arizona
As more public administration masterminds emerged, they realized the COUNTless opportunities in Arizona for number-crunching and AUDITing. The MASTERY of financial management and budgeting made them the TOP CREDITors in the state's workforce. It's as if a degree in public administration unlocked the VAULT to a whole new world of accounting opportunities in the Grand Canyon State!


View details about correlation #2,580
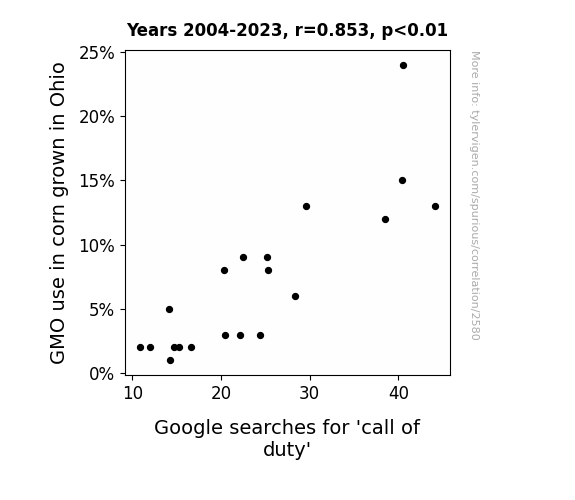
Stalk and Shoot: The Kernel of Connection Between GMO Corn and Gaming Searches
As the GMO corn took a stand against being genetically modified, it inadvertently triggered a domino effect within the digital world. The corn's decision sent shockwaves through the gaming community, leading to a kernel of truth causing a-maize-ing disbelief. Gamers everywhere were just ear-resistibly drawn to the idea of non-GMO corn, and it husked their interest away from Call of Duty. It seems the corn was really good at shelling out a new kind of entertainment, and for gamers, it was game over for Call of Duty as they popped off to ponder the cobsequences of GMOs. It was a-maize-ing, but in this husk, the truth kernel-y found a way to cob-fuse and plant a-maize-ing thoughts in the minds of gamers. The non-GMO corn, with its ear-resistible influence, really ear-ned its status as a game changer in the digital world. Who knew that a-maize-ing corn in Ohio could husk the entire gaming industry and corn-er the market on entertainment?

What else correlates?
GMO use in corn grown in Ohio · all food
Google searches for 'call of duty' · all google searches
GMO use in corn grown in Ohio · all food
Google searches for 'call of duty' · all google searches


View details about correlation #1,361
A Breath of Fresh Air? The Unlikely Link Between Pollution in Morgan City and Gasoline in Poland
As the air over Morgan City cleared up, it formed a high-pressure system that migrated eastward. This led to a domino effect of atmospheric changes, ultimately creating a localized anti-gasoline-pumping vortex over Poland. It's like the world's weirdest car fuel conspiracy, straight out of a wacky sci-fi movie! Who knew that the air we breathe and the fuel we pump could be interconnected in such a fantastically ridiculous way?


What else correlates?
Air pollution in Morgan City, Louisiana · all weather
Gasoline pumped in Poland · all energy
Air pollution in Morgan City, Louisiana · all weather
Gasoline pumped in Poland · all energy
. The chart goes from 2008 to 2022, and the two variables track closely in value over that time.")

View details about correlation #3,277
Vinyl Revival Survival: An Analysis of the Correlation Between LP Sales and MSCI Inc.'s Stock Price
As more people grooved to the nostalgic vibes of vinyl, it created a positive spin in the economy. This led to a surge in demand for audio equipment, boosting the companies in the MSCI index. It's like the stock market said, "You spin me right round, baby, right round, like a record, baby, right round round round!"


What else correlates?
Sales of LP/Vinyl Albums · all weird & wacky
MSCI Inc.'s stock price (MSCI) · all stocks
Sales of LP/Vinyl Albums · all weird & wacky
MSCI Inc.'s stock price (MSCI) · all stocks


View details about correlation #2,760
Roasting, Toasting, and Ball Games: The Correlation Between the Number of Food and Tobacco Roasting, Baking, and Drying Machine Operators and Tenders in South Dakota and Total Runs Scored in the World Series
As more South Dakotans entered the sizzling world of food and tobacco roasting, baking, and drying, they inadvertently sparked a rise in the World Series total runs scored. It seems their proficiency in operating "smoking hot" machines led to a matching surge in batting performance. One could say they truly put the "bake" in baseball, as their newfound presence resulted in a more "toasty" competition on the field.


View details about correlation #3,192
Spreading the Link: Exploring the Margarine of Butter Consumption and the Marginality of Robberies in North Dakota
As butter consumption increased, people's desire for a "spreadable" lifestyle also increased. This led to a rise in the underground butter black market in North Dakota, eventually causing a buttery surge in robberies as individuals attempted to "butter up" their own situations. The thieves were willing to take big risks for a chance to "butter" their lives with ill-gotten gains, turning previously peaceful neighborhoods into hotbeds of dairy heists. It was a slippery slope from creamy indulgence to criminal behavior, leaving law enforcement struggling to "margarine" a response.

What else correlates?
Butter consumption · all food
Robberies in North Dakota · all random state specific
Butter consumption · all food
Robberies in North Dakota · all random state specific


View details about correlation #2,056
Bay City Air and Norway Kero: A Quirky Co-Relato in Tales of Fate
The cleaner air in Bay City, Michigan somehow led to a reduced demand for kerosene in Norway, possibly because Norwegian trolls who usually thrived on air pollution emissions found a new passion for yoga and clean living, leading to a nationwide decrease in kerosene use as they switched to eco-friendly alternatives like fairy dust for their midnight lamps.


What else correlates?
Air pollution in Bay City, Michigan · all weather
Kerosene used in Norway · all energy
Air pollution in Bay City, Michigan · all weather
Kerosene used in Norway · all energy


View details about correlation #1,564
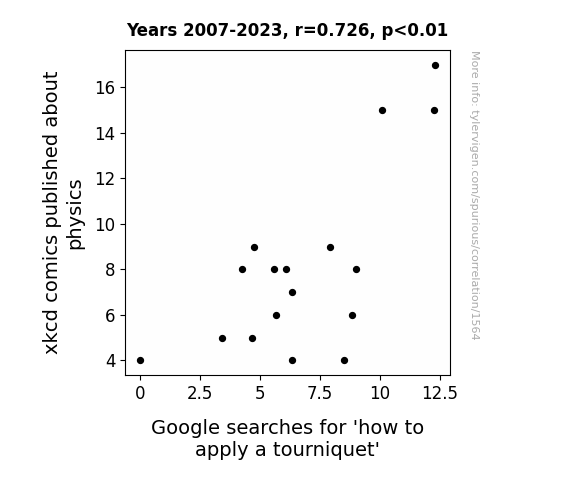
The Physics of Funny: Exploring the Correlation Between xkcd Comics and Queries for 'How to Apply a Tourniquet'
As the XKCD physics comics multiplied, so did people's understanding of blood flow, leading to a surge in interest in tourniquet application. Remember, when in doubt, just remember the comic where the physicist says, "I can't stop the bleeding, but I can make it your problem!"


View details about correlation #1,654
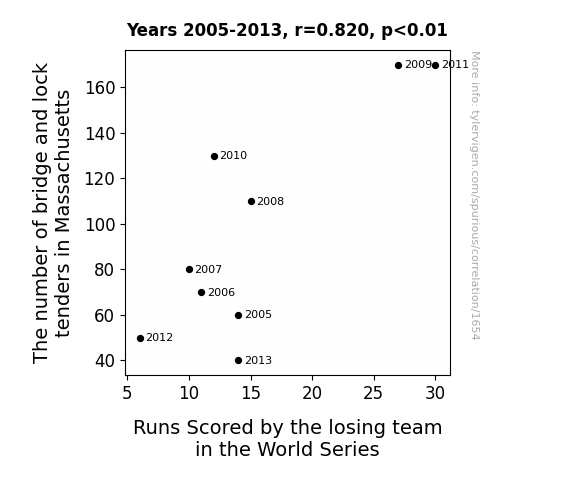
Bridge the Gap: An Unlikely Correlation between Bridge and Lock Tenders in Massachusetts and Runs Scored by the Losing Team in the World Series
As the number of bridge and lock tenders in Massachusetts increases, there is a corresponding increase in the ease of transportation for the losing team in the World Series. This leads to a reduced level of travel stress and improved overall team morale, resulting in a higher performance on the field and ultimately more runs scored. After all, a smooth sailing team is a scoring team!

. The chart goes from 2002 to 2022, and the two variables track closely in value over that time.")

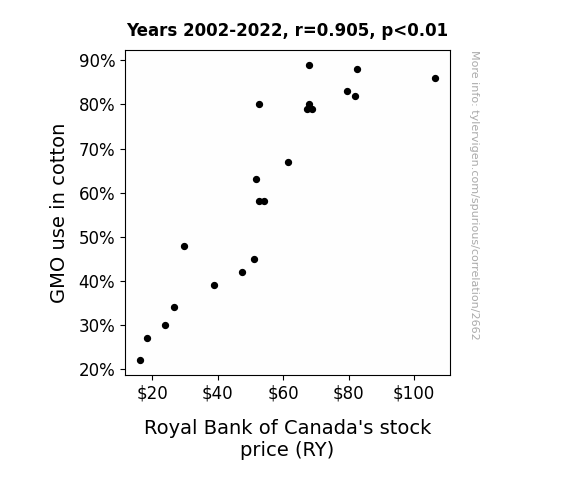
View details about correlation #2,662
The Cotton Connection: Genetically Modified Seeds and RY Stock Price Growth
As the cotton plants grew larger due to their GMO enhancements, they provided more shade. This led to a decrease in the demand for umbrellas. One of the major umbrella manufacturers happened to invest heavily in the Royal Bank of Canada, and as their umbrella sales dwindled, they funneled more money into the bank to compensate for their losses. So, in a roundabout way, GMO cotton indirectly boosted the bank's stock price.

What else correlates?
GMO use in cotton · all food
Royal Bank of Canada's stock price (RY) · all stocks
GMO use in cotton · all food
Royal Bank of Canada's stock price (RY) · all stocks
Why this works
- Data dredging: I have 25,237 variables in my database. I compare all these variables against each other to find ones that randomly match up. That's 636,906,169 correlation calculations! This is called “data dredging.”
Fun fact: the chart used on the wikipedia page to demonstrate data dredging is also from me. I've been being naughty with data since 2014.
Instead of starting with a hypothesis and testing it, I instead tossed a bunch of data in a blender to see what correlations would shake out. It’s a dangerous way to go about analysis, because any sufficiently large dataset will yield strong correlations completely at random. - Lack of causal connection: There is probably no direct connection between these variables, despite what the AI says above.
Because these pages are automatically generated, it's possible that the two variables you are viewing are in fact causually related. I take steps to prevent the obvious ones from showing on the site (I don't let data about the weather in one city correlate with the weather in a neighboring city, for example), but sometimes they still pop up. If they are related, cool! You found a loophole.
This is exacerbated by the fact that I used "Years" as the base variable. Lots of things happen in a year that are not related to each other! Most studies would use something like "one person" in stead of "one year" to be the "thing" studied. - Observations not independent: For many variables, sequential years are not independent of each other. You will often see trend-lines form. If a population of people is continuously doing something every day, there is no reason to think they would suddenly change how they are doing that thing on January 1. A naive p-value calculation does not take this into account.
You will calculate a lower chance of "randomly" achieving the result than represents reality.
To be more specific: p-value tests are probability values, where you are calculating the probability of achieving a result at least as extreme as you found completely by chance. When calculating a p-value, you need to assert how many "degrees of freedom" your variable has. I count each year (minus one) as a "degree of freedom," but this is misleading for continuous variables.
This kind of thing can creep up on you pretty easily when using p-values, which is why it's best to take it as "one of many" inputs that help you assess the results of your analysis.
- Y-axes doesn't start at zero: I truncated the Y-axes of the graphs above. I also used a line graph, which makes the visual connection stand out more than it deserves.
Nothing against line graphs. They are great at telling a story when you have linear data! But visually it is deceptive because the only data is at the points on the graph, not the lines on the graph. In between each point, the data could have been doing anything. Like going for a random walk by itself!
Mathematically what I showed is true, but it is intentionally misleading. If you click on any of the charts that abuse this, you can scroll down to see a version that starts at zero. - Confounding variable: Confounding variables (like global pandemics) will cause two variables to look connected when in fact a "sneaky third" variable is influencing both of them behind the scenes.
- Outliers: Some datasets here have outliers which drag up the correlation.
In concept, "outlier" just means "way different than the rest of your dataset." When calculating a correlation like this, they are particularly impactful because a single outlier can substantially increase your correlation.
Because this page is automatically generated, I don't know whether any of the charts displayed on it have outliers. I'm just a footnote. ¯\_(ツ)_/¯
I intentionally mishandeled outliers, which makes the correlation look extra strong. - Low n: There are not many data points included in some of these charts.
You can do analyses with low ns! But you shouldn't data dredge with a low n.
Even if the p-value is high, we should be suspicious of using so few datapoints in a correlation.
Pro-tip: click on any correlation to see:
- Detailed data sources
- Prompts for the AI-generated content
- Explanations of each of the calculations (correlation, p-value)
- Python code to calculate it yourself


