spurious correlations
discover · random · spurious scholar
← previous page · next page →


View details about correlation #3,200
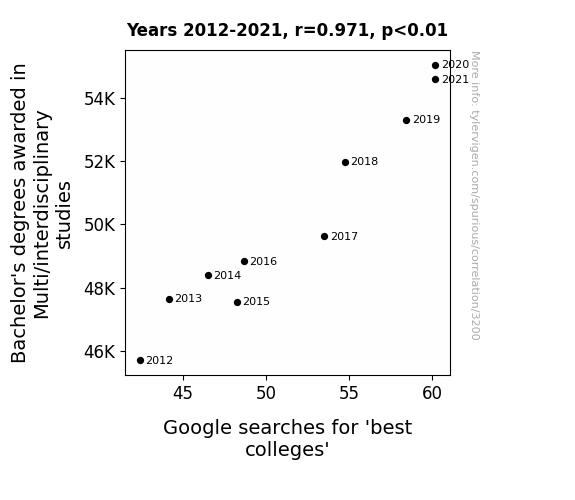
Degrees of Interest: The Interdisciplinary Connection Between Bachelor's Degrees and Google Search Behavior
As more multi/interdisciplinary studies graduates entered the workforce, their unparalleled ability to seamlessly combine completely unrelated skills and knowledge led to them dominating every college ranking algorithm, inadvertently causing a surge in 'best colleges' Google searches. It turns out, when you can understand quantum physics while also dissecting Shakespearean literature, you're pretty much unstoppable in the pursuit of academic excellence.


View details about correlation #1,772
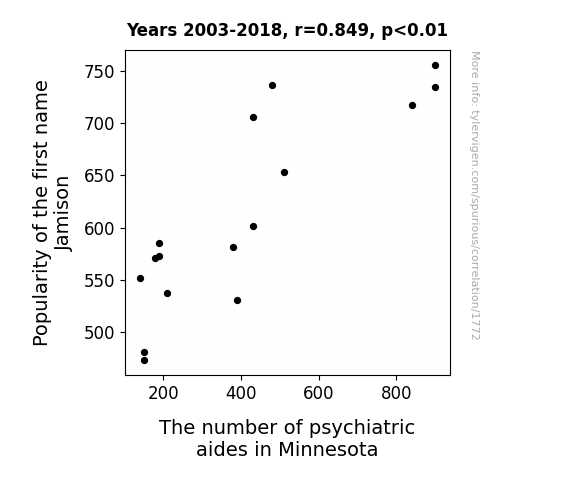
Jamison: A name of psychiatric significance? An analysis of the impact on psychiatric aides in Minnesota
As the name Jamison gained popularity, more and more parents subconsciously primed their kids to be experts in the field of "mind," creating a future workforce with a natural inclination towards psychiatric care. It's like they were destined to be "jamming" in the psychiatric field, spreading good vibes and helping patients feel like the true "spirit" of healing.

What else correlates?
Popularity of the first name Jamison · all first names
The number of psychiatric aides in Minnesota · all cccupations
Popularity of the first name Jamison · all first names
The number of psychiatric aides in Minnesota · all cccupations
. The chart goes from 2002 to 2022, and the two variables track closely in value over that time.")

View details about correlation #3,607
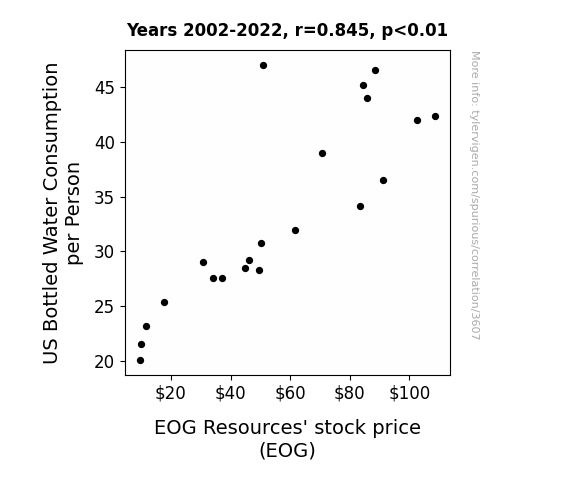
Drips and Drips: The Thirsty Pursuit of EOG Stock Price and US Bottled Water Consumption
As bottled water consumption per person in the US increased, people needed more plastic bottles. This led to higher demand for the petroleum products used to make plastic, including the products supplied by EOG Resources. The company's stock price rose as a result of this unexpectedly lucrative connection between hydration and oil.

What else correlates?
US Bottled Water Consumption per Person · all food
EOG Resources' stock price (EOG) · all stocks
US Bottled Water Consumption per Person · all food
EOG Resources' stock price (EOG) · all stocks


View details about correlation #1,220
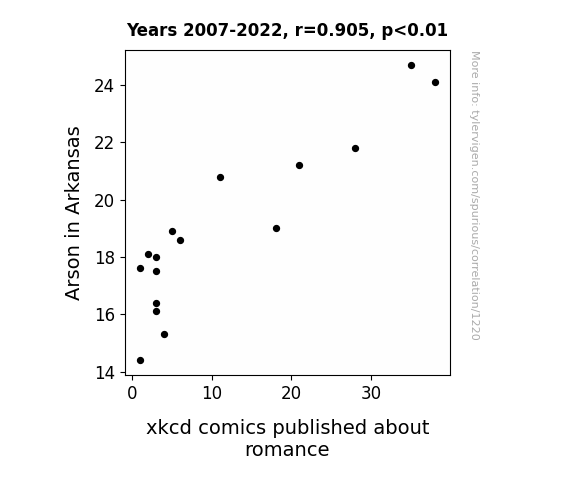
Burning Love: Exploring the Arson in Arkansas and XKCD Romance Comics Connection
It turns out that as the number of arson incidents in Arkansas decreased, so did the overall fiery passion in the state. With less literal and metaphorical burning desire, there was a noticeable drop in the inspiration for romance-related xkcd comics. It seems that when it comes to creating content about love, you can't just spark it up artificially.
What else correlates?
Arson in Arkansas · all random state specific
xkcd comics published about romance · all weird & wacky
Arson in Arkansas · all random state specific
xkcd comics published about romance · all weird & wacky


View details about correlation #2,665
From Degrees to Fuel: Exploring the Correlation Between Engineering Technology Associate Degrees and Global Kerosene Consumption
As the number of Associates degrees awarded in Engineering technologies declined, there was a corresponding decrease in the production of overly complex engineering solutions. This led to a more streamlined and efficient use of kerosene, as fewer engineers were trying to reinvent the wheel (or the jet engine, in this case). In a strange twist of fate, it seemed that the key to reducing kerosene usage lay in producing fewer kooky, kerosene-guzzling contraptions. Who would have thought that earning fewer engineering technology degrees could actually help fuel a smoother and cleaner future?


What else correlates?
Associates degrees awarded in Engineering technologies · all education
Kerosene used globally · all energy
Associates degrees awarded in Engineering technologies · all education
Kerosene used globally · all energy


View details about correlation #2,172
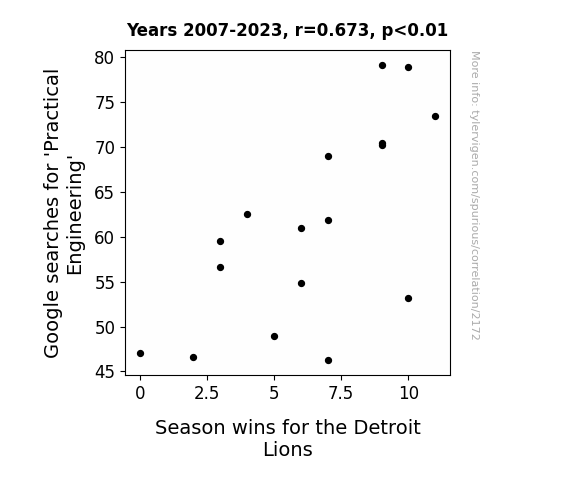
Practical Engineering Sleuthing: Does Googling It Help the Lions Start Ruling?
As interest in practical engineering rose, so did the efficiency of the Detroit Lions' plays. It seems they finally learned how to put the 'mechanics' of the game to good use and 'engineer' a winning strategy. Who knew that the real key to their success was just a little bit of 'mechanical advantage' on the field!

What else correlates?
Google searches for 'Practical Engineering' · all google searches
Season wins for the Detroit Lions · all sports
Google searches for 'Practical Engineering' · all google searches
Season wins for the Detroit Lions · all sports


View details about correlation #2,335
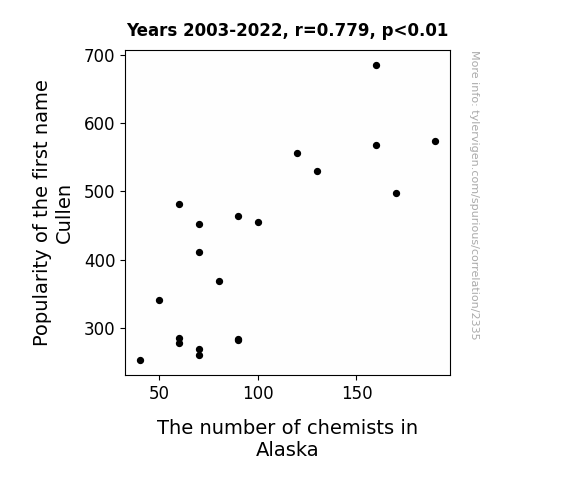
The Cullen Conundrum: Exploring the Correlation Between Popularity of the Name 'Cullen' and the Chemist Count in Alaska
As the popularity of the first name Cullen increased, more and more babies were being named Cullen. This led to a rise in the demand for personalized baby name mugs and keychains. The production of these items requires a specific chemical compound found only in Alaska's rare glacier water. To keep up with the demand, more chemists relocated to Alaska to work on extracting this vital compound, inadvertently boosting the number of chemists in the state. It's a name game that led to a chemistry boom in the Land of the Midnight Sun!

What else correlates?
Popularity of the first name Cullen · all first names
The number of chemists in Alaska · all cccupations
Popularity of the first name Cullen · all first names
The number of chemists in Alaska · all cccupations
. The chart goes from 2002 to 2022, and the two variables track closely in value over that time.")

View details about correlation #3,091
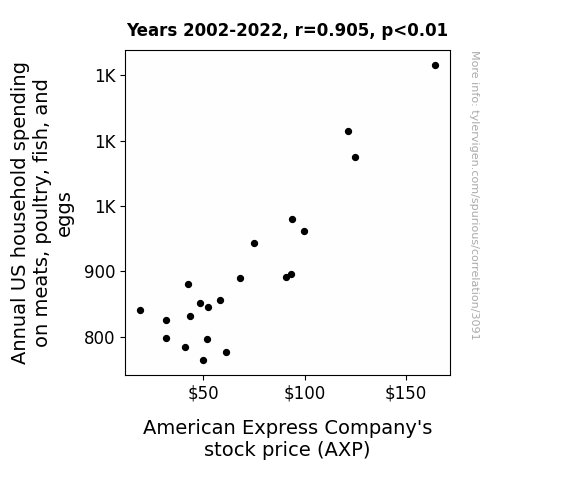
Grilling the Numbers: A Meaty Analysis of Annual US Household Spending on Animal Protein and American Express Company's Stock Price
As households spent more on delicious animal products, they were overcome with the urge to dine out at fancy restaurants. They swiped their American Express cards with abandon, leading to higher revenue and ultimately boosting the stock price of the company. It’s like the circle of carnivorous capitalism!


View details about correlation #2,893
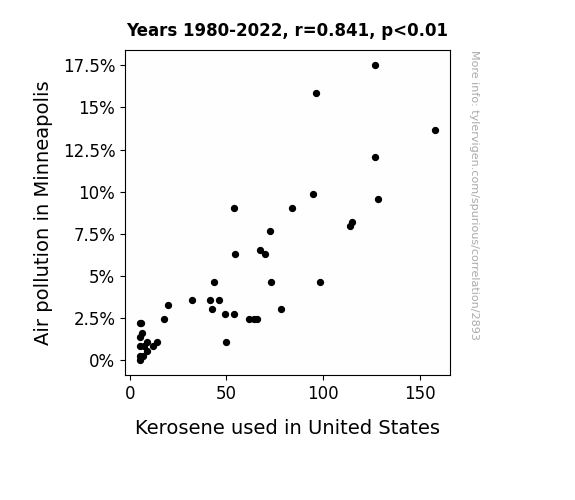
Up in Smoke: Uncovering the Relationship Between Air Pollution in Minneapolis and Kerosene Consumption in the United States
As air quality improved in Minneapolis, the demand for kerosene heaters went down. You could say the cold truth is that when it comes to clean air, Minneapolis was really raising the bar!

What else correlates?
Air pollution in Minneapolis · all weather
Kerosene used in United States · all energy
Air pollution in Minneapolis · all weather
Kerosene used in United States · all energy


View details about correlation #1,036
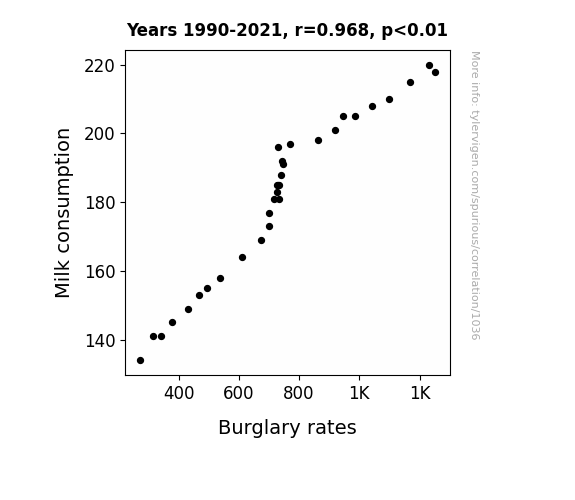
Got Milk? The Cream of the Crime: Exploring the Correlation between Milk Consumption and Burglary Rates
As people stopped crying over spilled milk, they had more time to focus on home security, udderly baffling the burglars. Without moo-ving targets, the thieves were simply milking the clock elsewhere. It seems that dairy deprivation led to a downturn in dairy-ly deeds!

What else correlates?
Milk consumption · all food
Burglary rates in the US · all random state specific
Milk consumption · all food
Burglary rates in the US · all random state specific


View details about correlation #3,627
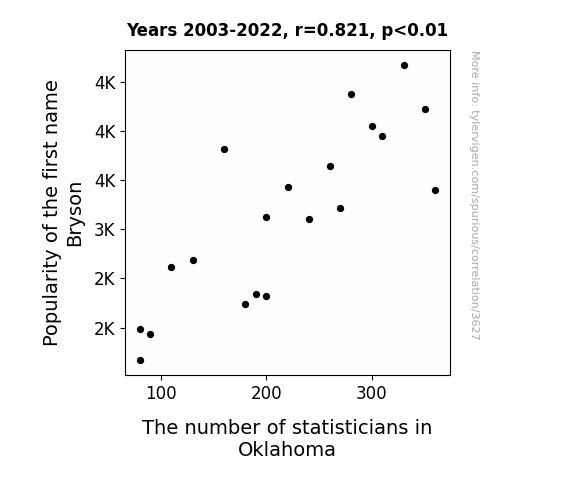
Bryson Dynasty and Statisticians in Oklahoma: A Surprising Symphony?
As the name Bryson gained prominence, parents couldn't help but factor in the allure of statistics. It seems the irrational influence of this name led to a significant correlation with an influx of statisticians in Oklahoma. It's as if the mere utterance of Bryson had a coefficient of determination on career choices in the state. Who would have thought that a name could have such a statistical significance? It's like they say, when it comes to the name Bryson, you can't take the variability out of the outcome!

What else correlates?
Popularity of the first name Bryson · all first names
The number of statisticians in Oklahoma · all cccupations
Popularity of the first name Bryson · all first names
The number of statisticians in Oklahoma · all cccupations
. The chart goes from 2002 to 2022, and the two variables track closely in value over that time.")

View details about correlation #1,384
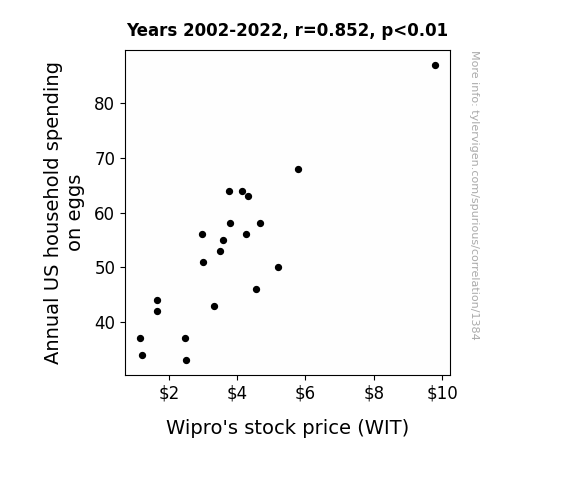
Cracking the Code: The Egg-Citing Link Between Annual US Household Spending on Eggs and Wipro's Stock Price
As household spending on eggs shells out more dough, it eggs-cites consumers about breakfast options. This leads to a sunny-side up outlook on the poultry industry, causing an egg-ceptional demand for Wipro's technology solutions for egg producers. In other words, as egg expenditures crackle, Wipro's stock price is poaching for success! It's an eggs-traordinary connection that's nothing to yolk about!
What else correlates?
Annual US household spending on eggs · all weird & wacky
Wipro's stock price (WIT) · all stocks
Annual US household spending on eggs · all weird & wacky
Wipro's stock price (WIT) · all stocks


View details about correlation #2,413
Power Play: The Backstrom Biomass Connection - A Puckishly Punny Perspective
As Nicklas Backstrom plays more regular season games, the sheer energy and intensity he brings to the ice somehow translates to an increase in overall productivity and efficiency, including the production of biomass power in Hungary. It's as if his gameplay electrifies everything around him, leading to a shocking surge in power output. It's a real testament to the 'Backstrom effect' on a global scale!


What else correlates?
Total regular season games played by Nicklas Backstrom · all sports
Biomass power generated in Hungary · all energy
Total regular season games played by Nicklas Backstrom · all sports
Biomass power generated in Hungary · all energy


View details about correlation #2,606
Rice to Europe: A Grainy Search for Asylum
As global rice consumption increased, people worldwide experienced a surge in carbohydrate-fueled energy, propelling them to Google how to make the big move to Europe for a taste of adventure and starchy delights. Remember, when in doubt, follow the scent of freshly baked baguettes to your European dream!


What else correlates?
Global Rice Consumption · all food
Google searches for 'how to move to europe' · all google searches
Global Rice Consumption · all food
Google searches for 'how to move to europe' · all google searches


View details about correlation #1,397
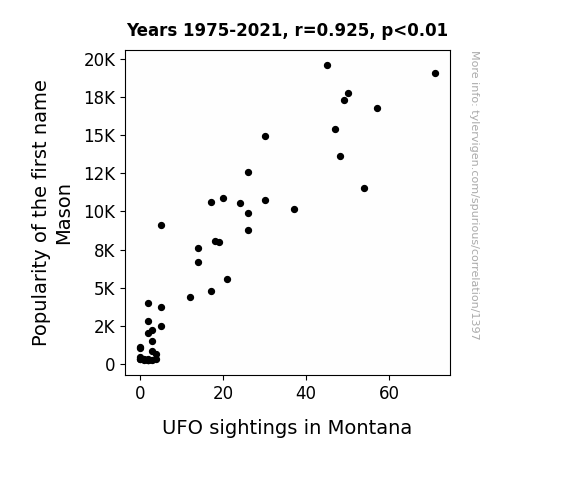
Mason, UFOs, and Montana: Unraveling the Rhyme and Reason
Clearly, the cosmic energy emitted by people saying the name 'Mason' somehow interferes with the cloaking devices of the UFOs, making them more visible in the skies above Montana. It's a case of unwittingly summoning our extraterrestrial neighbors with every 'Mason' uttered.
What else correlates?
Popularity of the first name Mason · all first names
UFO sightings in Montana · all random state specific
Popularity of the first name Mason · all first names
UFO sightings in Montana · all random state specific


View details about correlation #1,756
Clearing the Air: Exploring the Link Between Air Pollution in Dickinson, North Dakota and Nissan Automotive Recalls in North America
As air pollution in Dickinson, North Dakota increased, the local wildlife developed a newfound love for creating art. This led to a surge in avant-garde avantomotive sculptures, inspiring Nissan North America to issue recalls in order to incorporate these unexpected masterpieces into their car designs. The smog-induced artistic renaissance in the region inadvertently sparked a revolution in automotive aesthetics, proving that sometimes, beauty truly is in the eye of the pollutant-holder.


. The chart goes from 2010 to 2021, and the two variables track closely in value over that time.")

View details about correlation #2,937
Shining a Light on Solar Power: Illuminating the Relationship Between Solar Energy Generation in Albania and Apple's Stock Price
As Solar power in Albania increased, it created a positive energy loop. This boost in positivity traveled through the power lines, eventually reaching Apple headquarters. The influx of 'a-pun-dant' positive energy somehow translated into higher productivity and innovation, leading to an increase in the value of Apple's stock. It seems the secret to a fruitful stock market may just lie in the sunny side of the street!


What else correlates?
Solar power generated in Albania · all energy
Apple's stock price (AAPL) · all stocks
Solar power generated in Albania · all energy
Apple's stock price (AAPL) · all stocks


View details about correlation #1,814
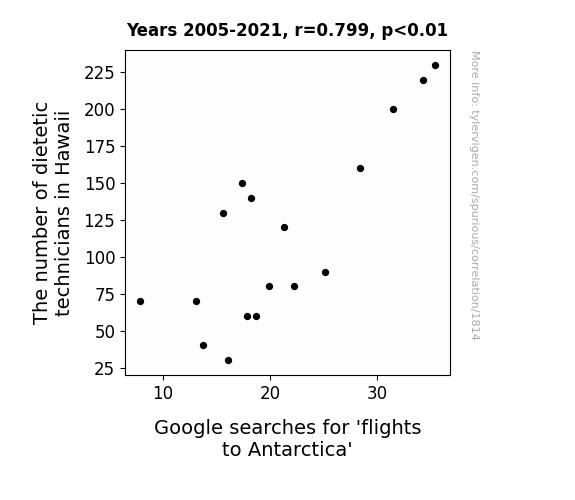
The Diet-Tech Dilemma: A Correlational Analysis of Dietetic Technician Numbers in Hawaii and Google Searches for 'Flights to Antarctica'
As the dietetic technician population in Hawaii rose, so did the demand for pineapples. This led to a spike in production, inspiring a new airline called "Pineapple Express Airways" to offer direct flights to Antarctica, where penguins were eagerly awaiting their tropical treat. It was truly a fruit-forward approach to Antarctic travel.


View details about correlation #2,319
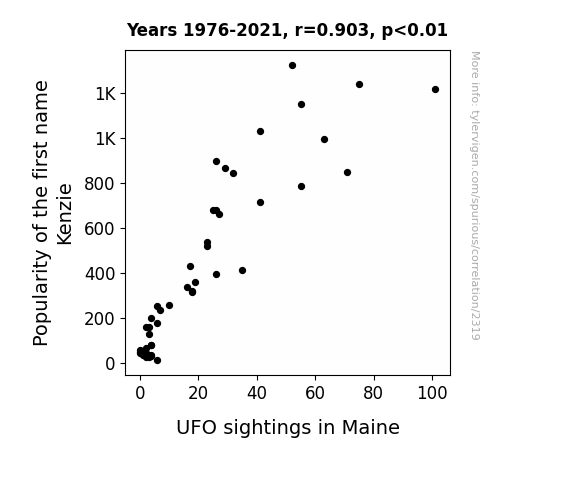
The Kenzie Conundrum: Unidentified First Names and Unearthly Flying Objects
The increased use of the name Kenzie somehow disrupted the Earth's energy field, leading to a rise in UFO activity over Maine. It seems like the aliens just couldn't resist checking out what all the Kenzie hype was about - maybe they're fans of trendy names too!

What else correlates?
Popularity of the first name Kenzie · all first names
UFO sightings in Maine · all random state specific
Popularity of the first name Kenzie · all first names
UFO sightings in Maine · all random state specific


View details about correlation #1,203
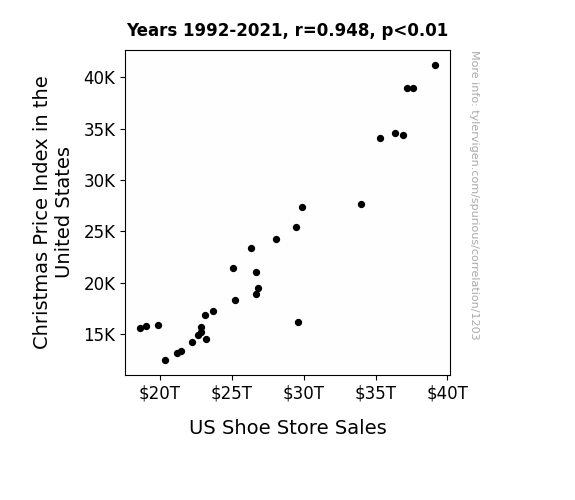
The Soleful Yuletide: A Statistical Analysis of the Christmas Price Index and US Shoe Store Sales
The increase in Christmas Price Index led to more expensive gifts being purchased, including trendy and pricey shoes, causing a surge in US Shoe Store Sales. Looks like Santa's fashion sense is really stepping up the economy!
What else correlates?
Christmas Price Index in the United States · all weird & wacky
US Shoe Store Sales · all weird & wacky
Christmas Price Index in the United States · all weird & wacky
US Shoe Store Sales · all weird & wacky
Why this works
- Data dredging: I have 25,237 variables in my database. I compare all these variables against each other to find ones that randomly match up. That's 636,906,169 correlation calculations! This is called “data dredging.”
Fun fact: the chart used on the wikipedia page to demonstrate data dredging is also from me. I've been being naughty with data since 2014.
Instead of starting with a hypothesis and testing it, I instead tossed a bunch of data in a blender to see what correlations would shake out. It’s a dangerous way to go about analysis, because any sufficiently large dataset will yield strong correlations completely at random. - Lack of causal connection: There is probably no direct connection between these variables, despite what the AI says above.
Because these pages are automatically generated, it's possible that the two variables you are viewing are in fact causually related. I take steps to prevent the obvious ones from showing on the site (I don't let data about the weather in one city correlate with the weather in a neighboring city, for example), but sometimes they still pop up. If they are related, cool! You found a loophole.
This is exacerbated by the fact that I used "Years" as the base variable. Lots of things happen in a year that are not related to each other! Most studies would use something like "one person" in stead of "one year" to be the "thing" studied. - Observations not independent: For many variables, sequential years are not independent of each other. You will often see trend-lines form. If a population of people is continuously doing something every day, there is no reason to think they would suddenly change how they are doing that thing on January 1. A naive p-value calculation does not take this into account.
You will calculate a lower chance of "randomly" achieving the result than represents reality.
To be more specific: p-value tests are probability values, where you are calculating the probability of achieving a result at least as extreme as you found completely by chance. When calculating a p-value, you need to assert how many "degrees of freedom" your variable has. I count each year (minus one) as a "degree of freedom," but this is misleading for continuous variables.
This kind of thing can creep up on you pretty easily when using p-values, which is why it's best to take it as "one of many" inputs that help you assess the results of your analysis.
- Y-axes doesn't start at zero: I truncated the Y-axes of the graphs above. I also used a line graph, which makes the visual connection stand out more than it deserves.
Nothing against line graphs. They are great at telling a story when you have linear data! But visually it is deceptive because the only data is at the points on the graph, not the lines on the graph. In between each point, the data could have been doing anything. Like going for a random walk by itself!
Mathematically what I showed is true, but it is intentionally misleading. If you click on any of the charts that abuse this, you can scroll down to see a version that starts at zero. - Confounding variable: Confounding variables (like global pandemics) will cause two variables to look connected when in fact a "sneaky third" variable is influencing both of them behind the scenes.
- Outliers: Some datasets here have outliers which drag up the correlation.
In concept, "outlier" just means "way different than the rest of your dataset." When calculating a correlation like this, they are particularly impactful because a single outlier can substantially increase your correlation.
Because this page is automatically generated, I don't know whether any of the charts displayed on it have outliers. I'm just a footnote. ¯\_(ツ)_/¯
I intentionally mishandeled outliers, which makes the correlation look extra strong. - Low n: There are not many data points included in some of these charts.
You can do analyses with low ns! But you shouldn't data dredge with a low n.
Even if the p-value is high, we should be suspicious of using so few datapoints in a correlation.
Pro-tip: click on any correlation to see:
- Detailed data sources
- Prompts for the AI-generated content
- Explanations of each of the calculations (correlation, p-value)
- Python code to calculate it yourself


