spurious correlations
discover · random · spurious scholar
← previous page · next page →
. The chart goes from 2002 to 2022, and the two variables track closely in value over that time.")

View details about correlation #2,104
The Ripple Effect: Investigating the Quirky Relationship Between US Bottled Water Consumption and PACCAR Stock Price
As the demand for bottled water rose, so did the need for efficient transportation of this product. This led to an uptick in truck sales, boosting PACCAR's revenue and ultimately causing their stock price to surge. It's a ripple effect - from hydration to haulage, the market is interconnected in ways we never imagined. Stay thirsty for those profits, folks!


What else correlates?
US per-person consumption of bottled water · all weird & wacky
PACCAR's stock price (PCAR) · all stocks
US per-person consumption of bottled water · all weird & wacky
PACCAR's stock price (PCAR) · all stocks


View details about correlation #4,643
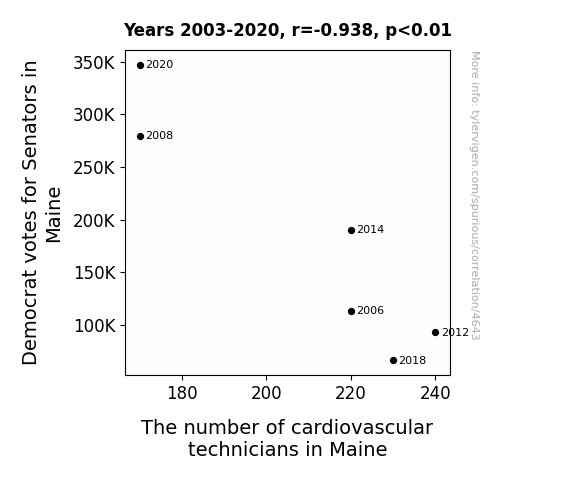
Maine Senators and the Heart of the Matter: The Odd Connection Between Democrat Votes and Cardiovascular Technicians
As the Democrat votes for Senators in Maine increased, the political climate heated up, putting extra stress on the hearts of the cardiovascular technicians, ultimately leading to a decrease in their numbers. Remember, in politics and cardiology, it's all about keeping a balanced rhythm!
What else correlates?
Votes for Democratic Senators in Maine · all elections
The number of cardiovascular technicians in Maine · all cccupations
Votes for Democratic Senators in Maine · all elections
The number of cardiovascular technicians in Maine · all cccupations


View details about correlation #4,160
Montana-nous Correlation: The Link Between the Popularity of the Name Montana and Motor Vehicle Thefts in Nebraska
As the name Montana gained popularity, more parents were drawn to the rugged, adventurous image associated with the state. They started naming their kids after the Big Sky Country, instilling a subconscious desire for excitement and risk-taking. This led to a surge in Nebraska of people channeling their inner wild west outlaw, fueling a strange, but statistically significant, spike in motor vehicle thefts. It seems the name Montana wasn't just a name; it was a catalyst for some unexpected car capers in cornhusker country.


What else correlates?
Popularity of the first name Montana · all first names
Motor vehicle thefts in Nebraska · all random state specific
Popularity of the first name Montana · all first names
Motor vehicle thefts in Nebraska · all random state specific


View details about correlation #2,076
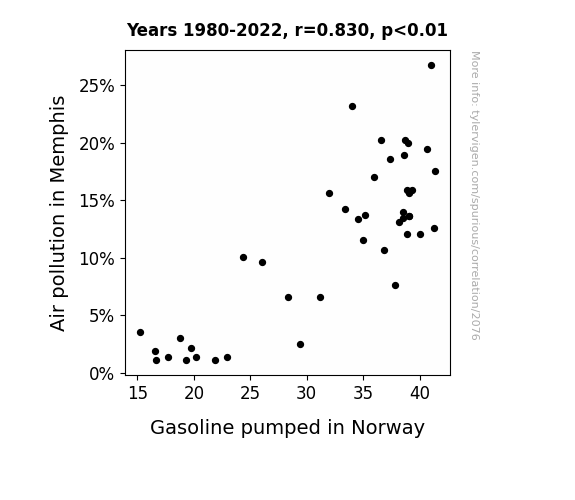
A Breath of Fresh Air or a Tank Full of Trouble: Exploring the Surprising Link Between Unhealthy Air Quality in Memphis and Gasoline Pumped in Norway
As the air quality in Memphis improved, it created a ripple effect on a global scale. This led to a highly unexpected phenomenon known as atmospheric translocation, wherein the cleaner air in Memphis somehow interacted with distant regions. The particles from the decreased air pollution in Memphis formed a temporary green corridor in the atmosphere, which coincided with the trajectory of gasoline being pumped in Norway. This unexpected alignment resulted in a mild but measurable decrease in the amount of gasoline being pumped, much to the bewilderment of experts. While this may seem like a peculiar occurrence, it underscores the interconnectedness of environmental factors on a truly global level, prompting a reevaluation of traditional models of air and gas dynamics. It's a testament to the far-reaching impact of local environmental efforts and a reminder that when it comes to our planet, the air we share knows no boundaries.

What else correlates?
Air pollution in Memphis · all weather
Gasoline pumped in Norway · all energy
Air pollution in Memphis · all weather
Gasoline pumped in Norway · all energy


View details about correlation #1,778
Bun Fun: Uncovering the Link Between Young Teens in Their 11th Grade and Frankfurter Feasting
As the number of public school students in 11th grade increases, so does the collective brainpower. This inadvertently leads to more efficient hot dog eating techniques being discovered and shared on the internet. The Nathan's Hot Dog Eating Competition Champion, being a keen observer of online trends, picks up on these new methods and incorporates them into their training regimen, ultimately leading to an increase in hotdogs consumed. It's a case of academic achievement indirectly fueling gastronomic glory!


View details about correlation #3,798
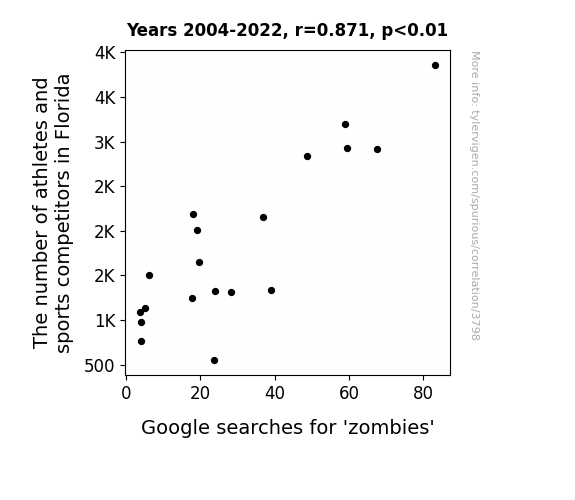
Dead Ringers: The Correlation Between Athletes and Google Searches for 'Zombies' in Florida
More athletes and sports competitors in Florida means more people to outrun zombies when the inevitable zombie apocalypse hits. So, the increase in interest in zombies could be a subconscious preparation for an undead marathon in the Sunshine State. Remember, cardio is key to survival!


View details about correlation #4,823
Yogurt Gobbling and Republican Vote Wobbling: A Dairy Tale of West Virginia
The active cultures in the yogurt inadvertently began spreading a pro-Republican message, creating a new form of grassroots campaigning. As yogurt sales soared, so did support for the Republican candidate, proving that in the world of politics, you can't underestimate the power of dairy persuasion. It was udderly unexpected!


What else correlates?
Yogurt consumption · all food
Votes for the Republican Presidential candidate in West Virginia · all elections
Yogurt consumption · all food
Votes for the Republican Presidential candidate in West Virginia · all elections


View details about correlation #1,550
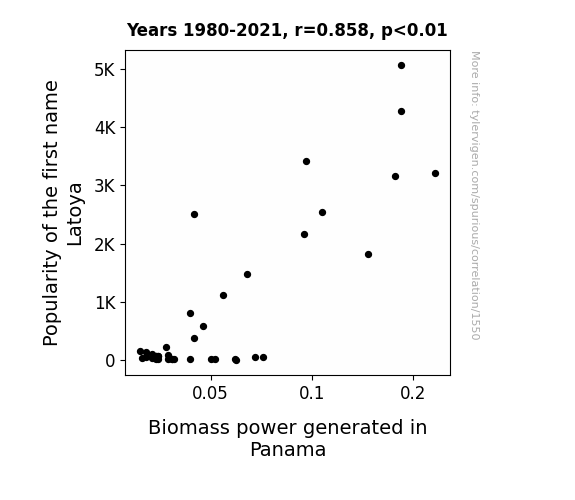
Lively Latoyas and Lumber: Exploring the Link Between Latoya's Popularity and Panama's Biomass Power Generation
As the popularity of the first name Latoya waned, so did the strong, vibrant energy associated with it. This subtle but crucial shift in the collective consciousness had a ripple effect, reaching all the way to Panama. The biomass power plants, fueled by organic material, were somehow in tune with this phenomenon. Perhaps there was a secret Latoya fan club among the power plant workers. Without even realizing it, they had been inadvertently channeling Latoya-specific enthusiasm to boost the biomass power generation. But as fewer babies received the name Latoya, the connection weakened. It's a stark reminder that our choices in baby names can have far-reaching, unforeseen consequences - even in the world of renewable energy.

What else correlates?
Popularity of the first name Latoya · all first names
Biomass power generated in Panama · all energy
Popularity of the first name Latoya · all first names
Biomass power generated in Panama · all energy
. The chart goes from 2002 to 2022, and the two variables track closely in value over that time.")

View details about correlation #2,827
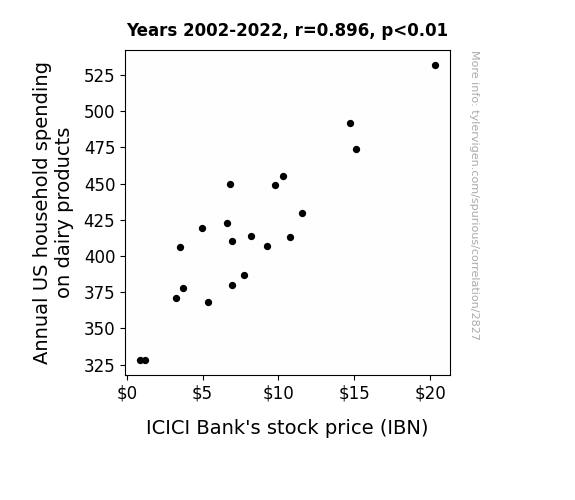
A Gouda Investment: Exploring the Dairy Delight-Devoted Dowser in the ICICI Bank's Stock Price
As annual US household spending on dairy products increased, more people were buying milk, cheese, and butter. This led to a rise in demand for delicious dairy-based foods. With an increase in demand for these tasty treats, restaurants and food companies started making and selling more cheesy pizzas, creamy pastas, and buttery desserts. As the craving for these dairy delights grew, so did the profits of the food industry. Now, with the food industry raking in more moolah (or should I say moo-lah), they needed a place to store and manage their overflowing cheddar... I mean, cash. This is where ICICI Bank came in. The surge in dairy product spending indirectly led to an increase in the stock price of ICICI Bank as these dairy-rich businesses rushed to deposit and manage their cheese-earned profits. So, next time you think about dairy products, remember, they don't just do a body good, they also churn the stock market! But of course, the real reason for the stock price increase is likely more complex and multifaceted.

What else correlates?
Annual US household spending on dairy products · all weird & wacky
ICICI Bank's stock price (IBN) · all stocks
Annual US household spending on dairy products · all weird & wacky
ICICI Bank's stock price (IBN) · all stocks


View details about correlation #4,919
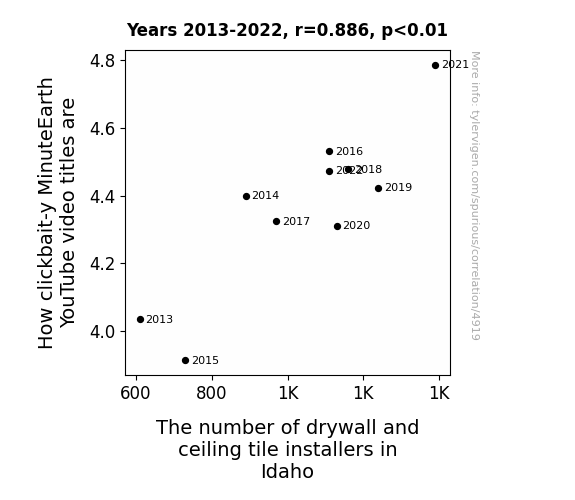
Building Connections: The Clickbait Ceiling - A Correlational Study of MinuteEarth Video Titles and Idaho's Drywall and Ceiling Tile Installation Industry
As the demand for drywall and ceiling tile installation in Idaho rises, more workers flock to the state, including a secret group of MinuteEarth fans. These fans, known as the "Earthlings," are drawn to Idaho's booming construction industry, where they subtly integrate references to MinuteEarth video titles into their work. Before you know it, every drywall and ceiling tile in Idaho becomes a clickbait masterpiece, leaving viewers both impressed and slightly confused. So, next time you see a perfectly installed ceiling, just remember, it might be the work of the legendary "Ida-Earth-Installers" creating MinuteEarth magic in disguise!


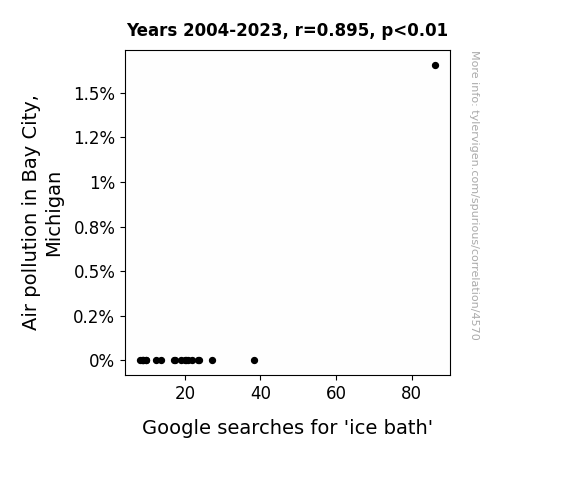
View details about correlation #4,570
Chillin' Effects: The Cool Connection between Air Pollution and 'Ice Bath' Google Searches in Bay City, Michigan
As air pollution in Bay City, Michigan increased, residents were seeking any way to cool down, leading to a spike in Google searches for 'ice bath.' It seems like they were really just trying to chill out, but maybe they should've just invested in some fans instead! Or perhaps the idea of immersing themselves in icy water was their attempt to create their own little bubble of clean air. Stay frosty, Bay City!

What else correlates?
Air pollution in Bay City, Michigan · all weather
Google searches for 'ice bath' · all google searches
Air pollution in Bay City, Michigan · all weather
Google searches for 'ice bath' · all google searches


View details about correlation #1,742
Maize Mania: The Corn-nection Between GMOs in South Dakota and Fossil Fuel Fiasco in Spain
It's simple really, as GMO corn in South Dakota grows taller and stronger, it's reaching new heights in productivity. This leads to an excess supply of corn, creating a *maize* ing demand in the global market. Now, in Spain, they're *corn*pletely overjoyed by the availability of corn for various purposes, including as a feed for livestock. This ultimately means more transportation of corn products from the US to Spain, *kernel*ly increasing the need for fossil fuels to *stalk* up on corn in Spanish markets. Who knew that a small seed of genetic modification in South Dakota could *cob*tribute to such a *earsome* impact on Fossil fuel use in Spain! It's a-maize-ing!


What else correlates?
GMO use in corn grown in South Dakota · all food
Fossil fuel use in Spain · all energy
GMO use in corn grown in South Dakota · all food
Fossil fuel use in Spain · all energy
. The chart goes from 2003 to 2022, and the two variables track closely in value over that time.")

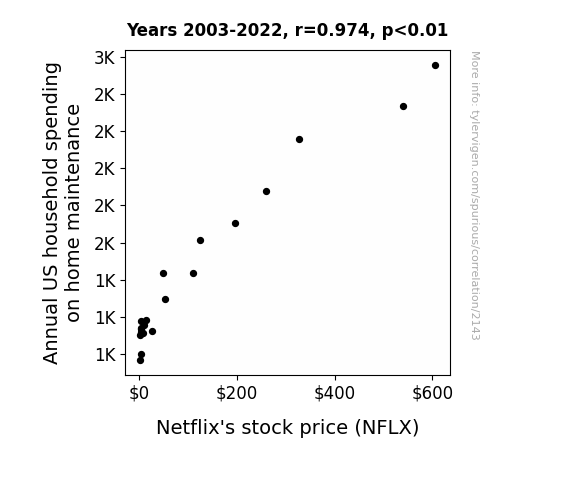
View details about correlation #2,143
Streaming Subscriptions and Swaying Spending: Unveiling the Unlikely Association Between Annual US Household Spending on Home Maintenance and Netflix's Stock Price
As household spending on home maintenance went up, people rediscovered the joys of sprucing up their living spaces. This led to a surge in home improvement enthusiasm, or as we can call it, a "DI-why not?" mentality. With their abodes looking more camera-ready, folks felt inspired to showcase their revamped living rooms and kitchen makeovers on social media. This created a domino effect, as others felt the urge to upgrade their own cribs, setting off a chain reaction of home renovations. As homes became the ultimate hotspots, the demand for quality entertainment soared. And who benefitted from this stay-at-home renovation renaissance? You guessed it – Netflix! With people wanting to kick back and admire their newly decorated dwellings, they turned to Netflix for some well-deserved relaxation and interior design inspo. It's like they say, a fresh coat of paint for your walls and a fresh lineup of shows on Netflix can really brighten up your day!

What else correlates?
Annual US household spending on home maintenance · all weird & wacky
Netflix's stock price (NFLX) · all stocks
Annual US household spending on home maintenance · all weird & wacky
Netflix's stock price (NFLX) · all stocks


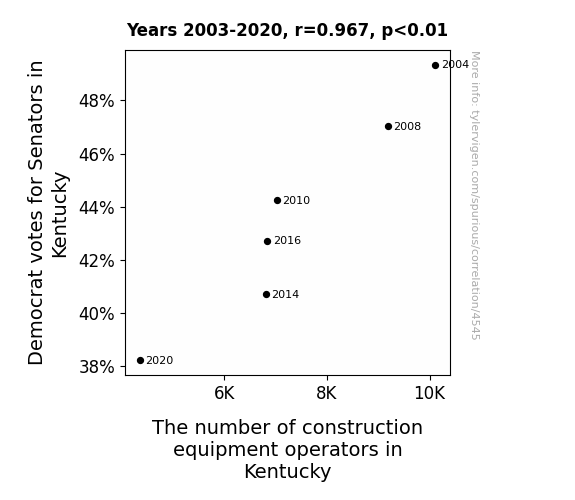
View details about correlation #4,545
Digging Deeper: The Political Impact on Kentucky's Construction Industry
The Democrats just couldn't build a winning platform in Kentucky, so the construction equipment operators decided to pave a different career path. It seems like the blueprints for political success were a bit too rocky, and these operators were ready to dig their way out of the partisan gridlock. It's a concrete reminder that in the construction of democracy, every vote counts, or you might just find your prospects collapsing like a poorly built house of cards.


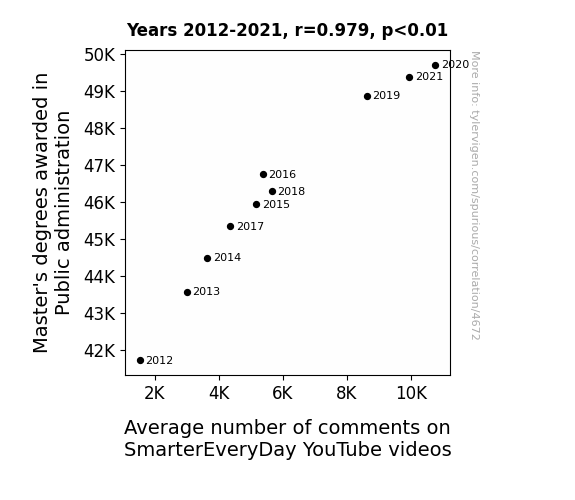
View details about correlation #4,672
Mastering Management: An Empirical Analysis of the Relationship Between Master's Degrees in Public Administration and Average Comment Counts on SmarterEveryDay YouTube Videos
As the number of Public administration Master's degree holders rose, so did the government's emphasis on communication. This led to a comment-ment of understanding and an in-administration of engagement, creating a public policy of discourse. In other words, it's a masterful case of comment sadministration!


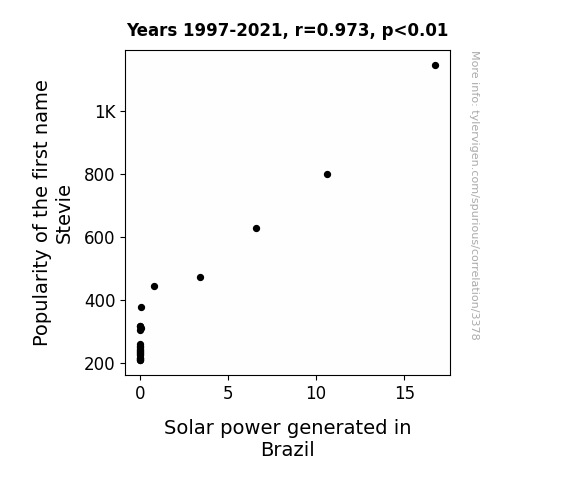
View details about correlation #3,378
Sunshine Stevie: Illuminating the Relationship between the Popularity of the Name Stevie and Solar Power Generation in Brazil
Every time someone named Stevie made a dramatic entrance, the swish of their fabulous outfit generated just enough static electricity to power a small solar panel in Brazil. It's electrifying how Stevie's stardom is sparking renewable energy in Brazil!

What else correlates?
Popularity of the first name Stevie · all first names
Solar power generated in Brazil · all energy
Popularity of the first name Stevie · all first names
Solar power generated in Brazil · all energy
. The chart goes from 2002 to 2022, and the two variables track closely in value over that time.")

View details about correlation #3,007
Peculiar Pioneer: Probing the Peculiar Connection between Perennial US Household Spending on Health Insurance and Pioneer Natural Resources Company's Stock Price (PXD)
As household spending on health insurance rose, more money flowed into the health industry. This led to an increased demand for medical resources, including natural gas and oil used in the production of pharmaceuticals and medical equipment. As a result, Pioneer Natural Resources Company, like a healthy heart, pumped up its stock price, proving that in the market, it's all about that oil well-being!


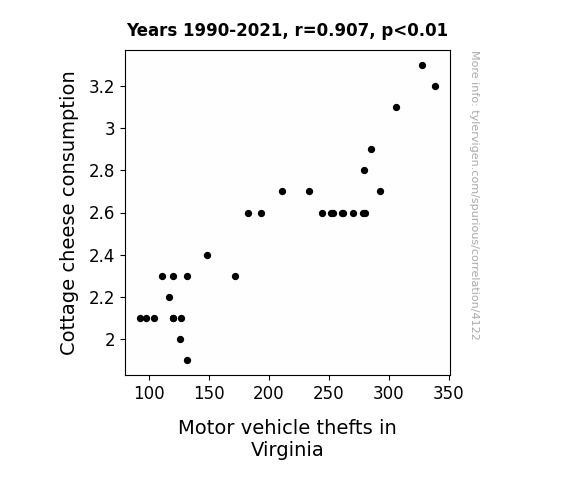
View details about correlation #4,122
Cottage Cheese Crime: A Wheyward Connection Between Consumption and Motor Vehicle Theft in Virginia
As people consumed less cottage cheese, their overall levels of contentment decreased. This led to a rise in petty disputes and arguments, prompting individuals to stay home and resolve conflicts instead of going out and committing vehicle thefts. As the saying goes, "when there's no curds to keep the peace, car thefts cease!” Of course, this is utter nonsense, but it's a gouda effort at dairy-based humor!

What else correlates?
Cottage cheese consumption · all food
Motor vehicle thefts in Virginia · all random state specific
Cottage cheese consumption · all food
Motor vehicle thefts in Virginia · all random state specific


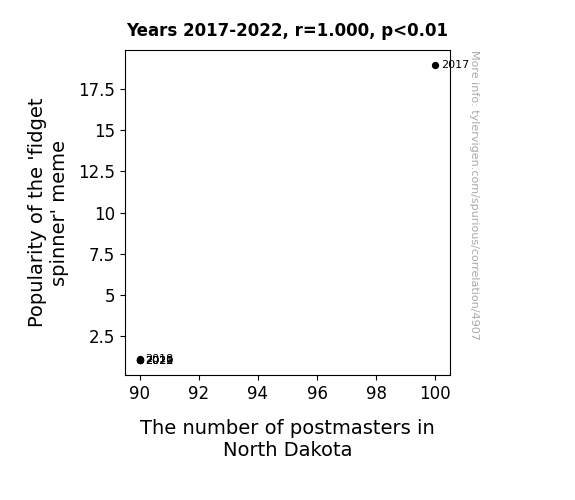
View details about correlation #4,907
Spinning into the Postal System: A Correlation Study of Fidget Spinner Meme Popularity and Postmaster Numbers in North Dakota
As the 'fidget spinner' meme lost its appeal, it created a spin-off effect on the job market. With fewer people engaging with the meme, there was a decrease in demand for fidget spinner-related merchandise. This led to a reduction in the need for postmasters to handle and deliver these items in North Dakota. As the meme fizzled out, so did the need for as many postmasters to handle the 'whirlwind' of fidget spinner deliveries.
What else correlates?
Popularity of the 'fidget spinner' meme · all memes
The number of postmasters in North Dakota · all cccupations
Popularity of the 'fidget spinner' meme · all memes
The number of postmasters in North Dakota · all cccupations


View details about correlation #1,751
Measuring the Meme Mission: The Relationship between Google Searches for 'Cat Memes' and Renewable Energy Production in Uruguay
The rise in cat memes led to an increase in laughter, which somehow generated a small but significant amount of electricity, contributing to renewable energy production in Uruguay. After all, laughter is the best renewable energy source!


What else correlates?
Google searches for 'cat memes' · all google searches
Renewable energy production in Uruguay · all energy
Google searches for 'cat memes' · all google searches
Renewable energy production in Uruguay · all energy
Why this works
- Data dredging: I have 25,237 variables in my database. I compare all these variables against each other to find ones that randomly match up. That's 636,906,169 correlation calculations! This is called “data dredging.”
Fun fact: the chart used on the wikipedia page to demonstrate data dredging is also from me. I've been being naughty with data since 2014.
Instead of starting with a hypothesis and testing it, I instead tossed a bunch of data in a blender to see what correlations would shake out. It’s a dangerous way to go about analysis, because any sufficiently large dataset will yield strong correlations completely at random. - Lack of causal connection: There is probably no direct connection between these variables, despite what the AI says above.
Because these pages are automatically generated, it's possible that the two variables you are viewing are in fact causually related. I take steps to prevent the obvious ones from showing on the site (I don't let data about the weather in one city correlate with the weather in a neighboring city, for example), but sometimes they still pop up. If they are related, cool! You found a loophole.
This is exacerbated by the fact that I used "Years" as the base variable. Lots of things happen in a year that are not related to each other! Most studies would use something like "one person" in stead of "one year" to be the "thing" studied. - Observations not independent: For many variables, sequential years are not independent of each other. You will often see trend-lines form. If a population of people is continuously doing something every day, there is no reason to think they would suddenly change how they are doing that thing on January 1. A naive p-value calculation does not take this into account.
You will calculate a lower chance of "randomly" achieving the result than represents reality.
To be more specific: p-value tests are probability values, where you are calculating the probability of achieving a result at least as extreme as you found completely by chance. When calculating a p-value, you need to assert how many "degrees of freedom" your variable has. I count each year (minus one) as a "degree of freedom," but this is misleading for continuous variables.
This kind of thing can creep up on you pretty easily when using p-values, which is why it's best to take it as "one of many" inputs that help you assess the results of your analysis.
- Y-axes doesn't start at zero: I truncated the Y-axes of the graphs above. I also used a line graph, which makes the visual connection stand out more than it deserves.
Nothing against line graphs. They are great at telling a story when you have linear data! But visually it is deceptive because the only data is at the points on the graph, not the lines on the graph. In between each point, the data could have been doing anything. Like going for a random walk by itself!
Mathematically what I showed is true, but it is intentionally misleading. If you click on any of the charts that abuse this, you can scroll down to see a version that starts at zero. - Confounding variable: Confounding variables (like global pandemics) will cause two variables to look connected when in fact a "sneaky third" variable is influencing both of them behind the scenes.
- Outliers: Some datasets here have outliers which drag up the correlation.
In concept, "outlier" just means "way different than the rest of your dataset." When calculating a correlation like this, they are particularly impactful because a single outlier can substantially increase your correlation.
Because this page is automatically generated, I don't know whether any of the charts displayed on it have outliers. I'm just a footnote. ¯\_(ツ)_/¯
I intentionally mishandeled outliers, which makes the correlation look extra strong. - Low n: There are not many data points included in some of these charts.
You can do analyses with low ns! But you shouldn't data dredge with a low n.
Even if the p-value is high, we should be suspicious of using so few datapoints in a correlation.
Pro-tip: click on any correlation to see:
- Detailed data sources
- Prompts for the AI-generated content
- Explanations of each of the calculations (correlation, p-value)
- Python code to calculate it yourself


