spurious correlations
discover · random · spurious scholar
← previous page · next page →


View details about correlation #4,332
iCan't Believe It's Apples and Likes: Exploring the Surprising Connection Between Global Apple iPhone Sales in Q3 and Total Likes of AsapSCIENCE YouTube Videos
The electromagnetic waves emitted by the iPhones inadvertently triggered a subliminal urge to engage with science content, leading to more likes on AsapSCIENCE videos. It's a shocking discovery!

What else correlates?
Global Apple iPhone Sales in Q3 · all weird & wacky
Total likes of AsapSCIENCE YouTube videos · all YouTube
Global Apple iPhone Sales in Q3 · all weird & wacky
Total likes of AsapSCIENCE YouTube videos · all YouTube


View details about correlation #3,462
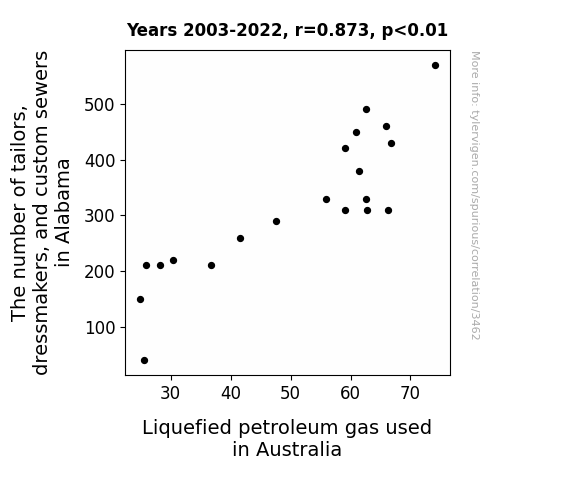
The Tailor-Tailgate Tango: Tracking the Tutelage of Tailors, Tweeds, and Tankers
As the saying goes, 'Sew long, farewell, auf wiedersehen, adieu' to the tailors and dressmakers in Alabama! With fewer of them around to create stunning fashion pieces, the demand for extravagant clothing in Australia plummeted. Consequently, there was a significant reduction in the number of flamboyant dress designs, leading to a decreased need for Liquefied Petroleum Gas used in the glitzy fashion industry. It seems the lack of 'sew' much frilling and 'tailor'ed outfits has left the LPG suppliers in Australia in stitches!


View details about correlation #4,306
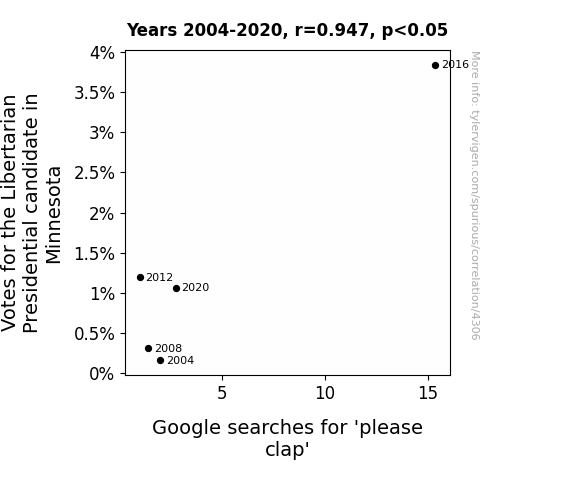
Please Clap for Freedom: The Surprising Correlation Between Votes for the Libertarian Presidential Candidate in Minnesota and Google Searches for 'Please Clap'
As the support for the Libertarian candidate grew, so did the number of individuals silently cheering at political events. Unable to generate spontaneous applause, the speakers began prompting the audience, leading to an uptick in the number of searches for the now-awkward request, "please clap." Remember, every vote has a ripple effect, even in the peculiar realm of polite political applause.

. The chart goes from 2002 to 2022, and the two variables track closely in value over that time.")

View details about correlation #3,729
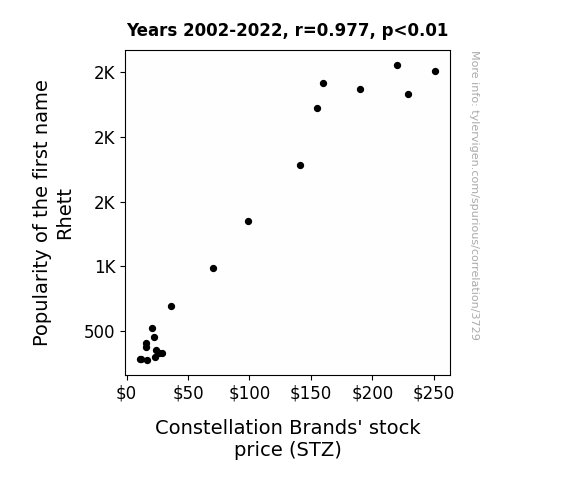
The Rhett Effect: An Examination of the Stellar Relationship Between the Popularity of the Name Rhett and Constellation Brands' Stock Price
As the popularity of the name Rhett rose, more parents were subconsciously drawn to the idea of a sophisticated and charming Southern gentleman. This led to a spike in demand for fancy, upscale baby products, including decorative constellation-themed nursery items. With this increased demand for all things celestial, Constellation Brands, known for its star-studded lineup of beverages, saw a corresponding boost in stock price. It seems like naming your kid Rhett isn't just a decision, it's a stellar investment strategy!

What else correlates?
Popularity of the first name Rhett · all first names
Constellation Brands' stock price (STZ) · all stocks
Popularity of the first name Rhett · all first names
Constellation Brands' stock price (STZ) · all stocks


View details about correlation #4,794
Clearing the Air: Examining the Correlation Between Air Quality in Raleigh, North Carolina, and the Rise of Internet Users
The cleaner air made people want to spend more time outdoors, but since they couldn't live without the internet, they just took it with them wherever they went. It's like they were saying, "I'll enjoy this fresh air, but only if I can still check my social media and watch videos of cats being ridiculous."


What else correlates?
Air quality in Raleigh, North Carolina · all weather
Number of internet users · all weird & wacky
Air quality in Raleigh, North Carolina · all weather
Number of internet users · all weird & wacky


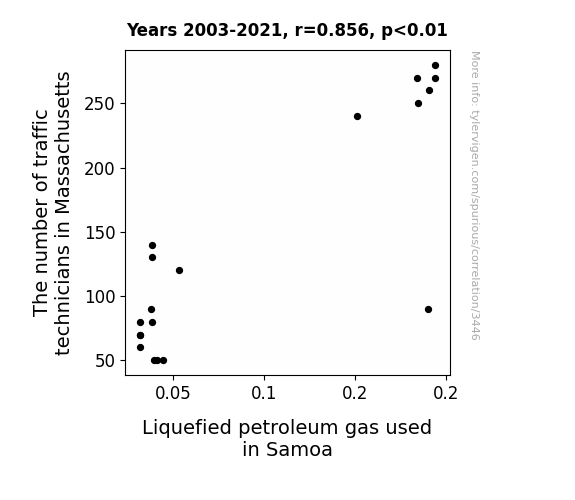
View details about correlation #3,446
Going with the flow: The Traffic Technician Tango with Liquefied Petroleum Gas Consumption in Samoa
More traffic technicians in Massachusetts means more efficient traffic flow, leading to smoother trucking routes. These smoother routes somehow result in a surge of demand for Liquefied Petroleum Gas in Samoa, possibly due to a cosmic connection between traffic control and gas preferences on distant islands. It's a strangely specific but undeniably wacky ripple effect!

What else correlates?
The number of traffic technicians in Massachusetts · all cccupations
Liquefied petroleum gas used in Samoa · all energy
The number of traffic technicians in Massachusetts · all cccupations
Liquefied petroleum gas used in Samoa · all energy


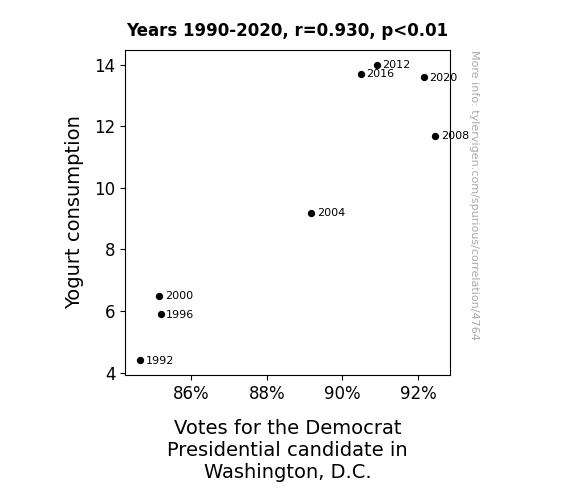
View details about correlation #4,764
The Yummy Yogurt Yield: Yoking Yogurt Consumption to Yardstick Yeas for the Democrat Presidential candidate in Washington, D.C.
The active cultures in yogurt led to a more liberal gut microbiome, which in turn influenced political leanings towards the Democratic candidate. Additionally, the smooth and creamy texture of yogurt may have subconsciously swayed residents towards a more harmonious and inclusive political platform.

What else correlates?
Yogurt consumption · all food
Votes for the Democratic Presidential candidate in Washington, D.C. · all elections
Yogurt consumption · all food
Votes for the Democratic Presidential candidate in Washington, D.C. · all elections
. The chart goes from 2011 to 2021, and the two variables track closely in value over that time.")

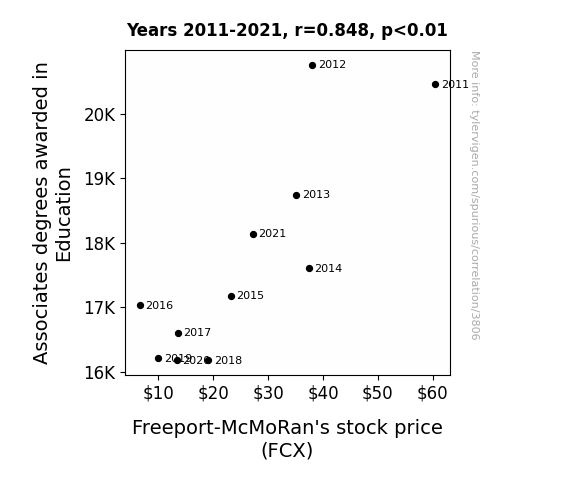
View details about correlation #3,806
Ore Edu-cation or Ore Speculation? Exploring the Connection Between Associate Degrees in Education and Freeport-McMoRan's Stock Price
As the number of Associates degrees awarded in Education decreased, there was a corresponding decline in the creation of highly qualified mining song lyricists. This led to a lack of uplifting and motivational mining jingles in Freeport-McMoRan's advertising campaigns, ultimately diminishing investor confidence and causing a decrease in their stock price (FCX). Remember, a well-educated workforce is instrumental in digging up success, both in the classroom and the copper mines!

What else correlates?
Associates degrees awarded in Education · all education
Freeport-McMoRan's stock price (FCX) · all stocks
Associates degrees awarded in Education · all education
Freeport-McMoRan's stock price (FCX) · all stocks


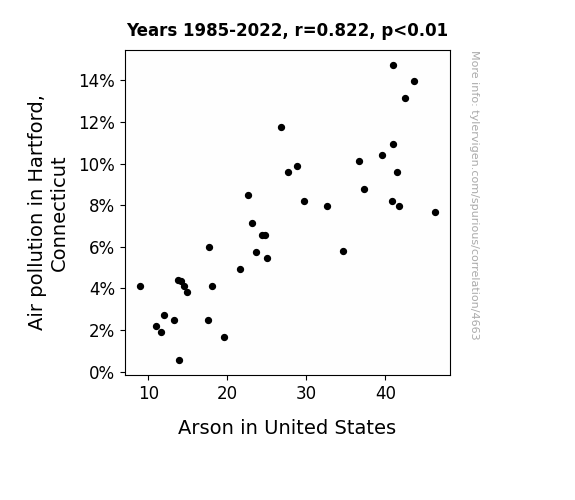
View details about correlation #4,663
The Hazy Connection: A Statistical Analysis of Air Pollution in Hartford and Arson-Driven Fires in the United States
As the air cleared, it turns out the arsonists could no longer use 'smoke screen' as an effective getaway tactic. Without the thick smog to provide cover, their fiery shenanigans were easily spotted, leading to a rapid decrease in their success rates. It seems like when it comes to committing arson, these individuals just couldn't handle the heat without the city's pollution offering them some serious 'burn' protection. So, as Hartford took a deep breath of fresh air, the arsonists found themselves running out of 'fuel' for their fiery escapades, ultimately dampening their enthusiasm for the illicit activity. I guess you could say that cleaner air really did help clear the path to a reduction in arson across the country!

What else correlates?
Air pollution in Hartford, Connecticut · all weather
Arson in United States · all random state specific
Air pollution in Hartford, Connecticut · all weather
Arson in United States · all random state specific


View details about correlation #2,712
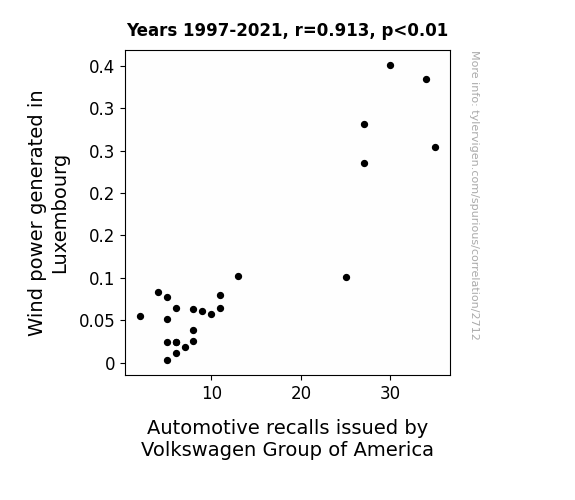
Blowing in the Wind: An Empirical Study on the Relationship between Wind Power in Luxembourg and Automotive Recalls Issued by Volkswagen Group of America
The excessive gusts of wind in Luxembourg were inadvertently causing Volkswagen cars in America to develop a case of "wind-power-itis." This rare and unexpected condition led to a surge in automotive recalls as the cars struggled to cope with the unrelenting influx of European air currents. The recall issues included cars unexpectedly veering off course as if driven by the invisible hand of Aeolus himself. It seems the cars just couldn't handle the sudden influx of renewable energy, leading to some rather shocking and electrifying malfunctions.


View details about correlation #4,388
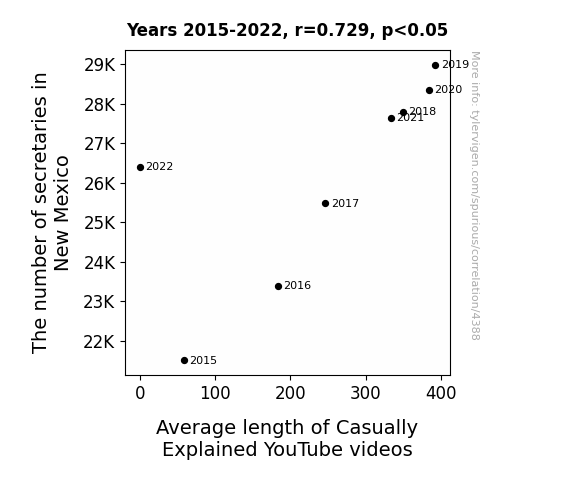
The Secretary Situation: A Typing Tale of Casual Correlations
It seems that as the number of secretaries in New Mexico rises, so does the typing pool of potential jokes for the videos. One could say that their increasing presence is dictating the video length, and the content is being transcribed into longer, more secretary-ous explanations!

What else correlates?
The number of secretaries in New Mexico · all cccupations
Average length of Casually Explained YouTube videos · all YouTube
The number of secretaries in New Mexico · all cccupations
Average length of Casually Explained YouTube videos · all YouTube


View details about correlation #4,338
Flight of the Elephants: The Trunkated Relationship Between Republican Votes in Illinois and Google Searches for 'Flights to Antarctica'
As Republican votes for Senators in Illinois increased, so did the hot air in the state, leading to a surge in demand for cool Antarctic getaways. It seems like Illinois was just trying to win the 'coolest state' competition! Remember, when Illinois gets political, Antarctica gets tropical!

What else correlates?
Votes for Republican Senators in Illinois · all elections
Google searches for 'flights to Antarctica' · all google searches
Votes for Republican Senators in Illinois · all elections
Google searches for 'flights to Antarctica' · all google searches


View details about correlation #4,061
Analyzing the Heat: A Fiery Relationship Between Smog and Scorching in California
As the smog cleared, so did the arsonists' consciences. It turns out, they just couldn't bear to pollute the air any more than it already was!


What else correlates?
Air pollution in Los Angeles · all weather
Arson in California · all random state specific
Air pollution in Los Angeles · all weather
Arson in California · all random state specific


View details about correlation #3,558
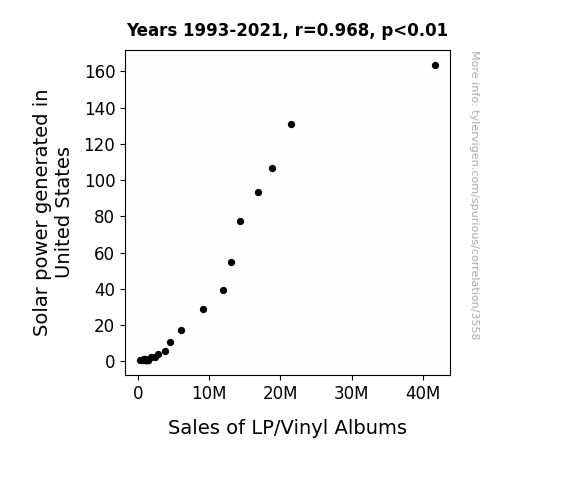
Spinning in the Sun: The Bright Link Between Solar Power and Vinyl Sales in the United States
As the country soaked up more solar energy, it seems to have recharged people's interest in vinyl, sparking a sunny revival of classic music. It's like the sun said, "Let's groove tonight," and the vinyl albums couldn't help but spin out some electrifying tunes. It's a bright idea to think that solar power is not only fueling homes but also spinning the tracks of music lovers across the nation. It's a solar-powered symphony, where the sun's rays are not just light, but also the right wavelength for a vinyl renaissance. Who knew that the hottest trend in music would be powered by the coolest source of energy? With solar on the rise, it's a whole new wattage of enjoying music – truly a shining example of how solar power is not just a ray of hope, but also a groovy revolution in the world of sound. The correlation may seem far-fetched, but perhaps there's a solar connection to why people are feeling so amp'd up about vinyl again.

What else correlates?
Solar power generated in United States · all energy
Sales of LP/Vinyl Albums · all weird & wacky
Solar power generated in United States · all energy
Sales of LP/Vinyl Albums · all weird & wacky


View details about correlation #4,564
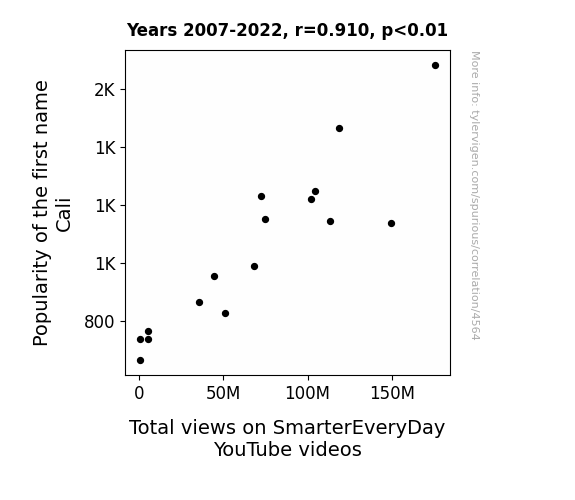
The Calli-ing of Cali: A Statistical Analysis of the Relationship between Popularity of the Name Cali and Total Views on SmarterEveryDay YouTube Videos
Sure! As the name Cali gained popularity, more people were drawn to the laid-back, sunny vibes associated with California. These good vibes subconsciously led them to seek out uplifting and educational content, like SmarterEveryDay videos, creating a wave of viewership. It seems the connection between Cali and cleverness is not just a mere 'coincali'dence.

What else correlates?
Popularity of the first name Cali · all first names
Total views on SmarterEveryDay YouTube videos · all YouTube
Popularity of the first name Cali · all first names
Total views on SmarterEveryDay YouTube videos · all YouTube
. The chart goes from 2003 to 2022, and the two variables track closely in value over that time.")

View details about correlation #3,886
Pouring Over the Pour: Exploring the Bartenders-Stock Price Connection
As the number of bartenders in Idaho rose, so did the demand for drinks. This led to an increase in people getting "Ford" - sorry, I mean "fourth" rounds, resulting in higher alcohol consumption. With more liquid confidence flowing, folks felt more inclined to invest, leading to a spike in Ford Motor Company's stock price. Looks like the bartenders weren't just mixing drinks, they were also stirring up the stock market!


What else correlates?
The number of bartenders in Idaho · all cccupations
Ford Motor Company's stock price (F) · all stocks
The number of bartenders in Idaho · all cccupations
Ford Motor Company's stock price (F) · all stocks


View details about correlation #3,898
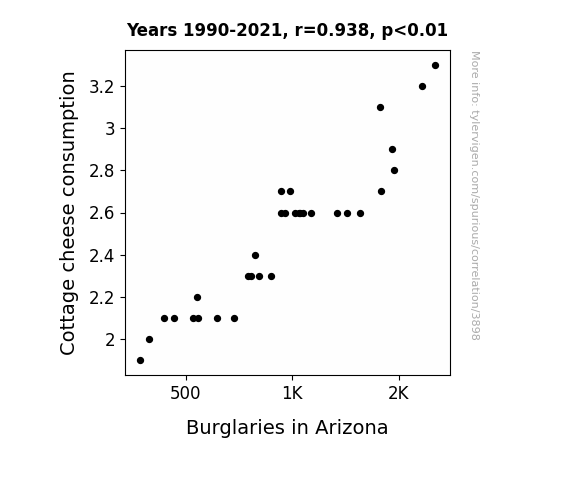
Say Cheese, Say Please: Exploring the Whey of Cottage Cheese Consumption and Burglaries in Arizona
As people consumed less cottage cheese, they experienced a decrease in lactose intolerance, leading to improved sleep quality. This reduced the likelihood of sleepwalking, a common precursor to accidental burglary attempts in Arizona. It turns out, when it comes to preventing theft, the real secret is cutting the cheese!

What else correlates?
Cottage cheese consumption · all food
Burglaries in Arizona · all random state specific
Cottage cheese consumption · all food
Burglaries in Arizona · all random state specific


View details about correlation #2,713
Windswept Woes: Whimsical Warnings of Wind Power and Air Bag Anomalies
The powerful gusts from the increased wind power were inadvertently inflating the airbags in a way that mimicked a safety issue, prompting the recalls.


What else correlates?
Wind power generated in Faroe Islands · all energy
Automotive recalls for issues with the Air Bags · all weird & wacky
Wind power generated in Faroe Islands · all energy
Automotive recalls for issues with the Air Bags · all weird & wacky


View details about correlation #4,924
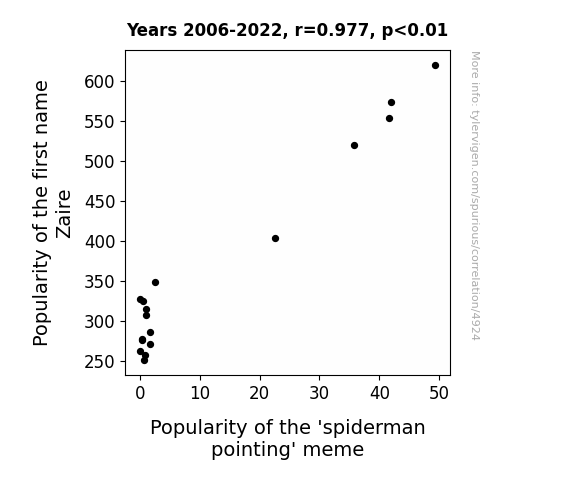
Zaire's Zealous Zip with the 'Spiderman Pointing' Sensation: A Statistical Study
As more and more babies were named Zaire, a secret competition began among them to see who could strike the most dynamic Spiderman pose. This led to an influx of adorable, web-slinging photos and videos on social media, captivating internet users and propelling the 'Spiderman pointing' meme to new heights of fame. The Zaires inadvertently created a new trend that had everyone cheering them on, one spidey stance at a time.
What else correlates?
Popularity of the first name Zaire · all first names
Popularity of the 'spiderman pointing' meme · all memes
Popularity of the first name Zaire · all first names
Popularity of the 'spiderman pointing' meme · all memes


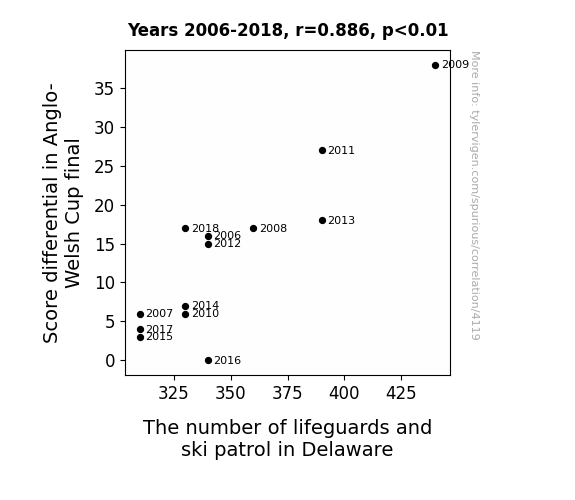
View details about correlation #4,119
Guarding Scores: A Dive into the Correlation Between Anglo-Welsh Cup Final Score Differential and Lifeguard/Ski Patrol Numbers in Delaware
As the score differential in the Anglo-Welsh Cup final increases, so does the level of excitement among fans. This heightened state of excitement leads to a sudden urge to hit the slopes, even in a state like Delaware. As more people inexplicably take up skiing and snowboarding, the demand for lifeguards and ski patrol in Delaware skyrockets. Who knew that a rugby tournament in the UK could have such a snowball effect on winter sports safety in a small East Coast state?

Why this works
- Data dredging: I have 25,237 variables in my database. I compare all these variables against each other to find ones that randomly match up. That's 636,906,169 correlation calculations! This is called “data dredging.”
Fun fact: the chart used on the wikipedia page to demonstrate data dredging is also from me. I've been being naughty with data since 2014.
Instead of starting with a hypothesis and testing it, I instead tossed a bunch of data in a blender to see what correlations would shake out. It’s a dangerous way to go about analysis, because any sufficiently large dataset will yield strong correlations completely at random. - Lack of causal connection: There is probably no direct connection between these variables, despite what the AI says above.
Because these pages are automatically generated, it's possible that the two variables you are viewing are in fact causually related. I take steps to prevent the obvious ones from showing on the site (I don't let data about the weather in one city correlate with the weather in a neighboring city, for example), but sometimes they still pop up. If they are related, cool! You found a loophole.
This is exacerbated by the fact that I used "Years" as the base variable. Lots of things happen in a year that are not related to each other! Most studies would use something like "one person" in stead of "one year" to be the "thing" studied. - Observations not independent: For many variables, sequential years are not independent of each other. You will often see trend-lines form. If a population of people is continuously doing something every day, there is no reason to think they would suddenly change how they are doing that thing on January 1. A naive p-value calculation does not take this into account.
You will calculate a lower chance of "randomly" achieving the result than represents reality.
To be more specific: p-value tests are probability values, where you are calculating the probability of achieving a result at least as extreme as you found completely by chance. When calculating a p-value, you need to assert how many "degrees of freedom" your variable has. I count each year (minus one) as a "degree of freedom," but this is misleading for continuous variables.
This kind of thing can creep up on you pretty easily when using p-values, which is why it's best to take it as "one of many" inputs that help you assess the results of your analysis.
- Y-axes doesn't start at zero: I truncated the Y-axes of the graphs above. I also used a line graph, which makes the visual connection stand out more than it deserves.
Nothing against line graphs. They are great at telling a story when you have linear data! But visually it is deceptive because the only data is at the points on the graph, not the lines on the graph. In between each point, the data could have been doing anything. Like going for a random walk by itself!
Mathematically what I showed is true, but it is intentionally misleading. If you click on any of the charts that abuse this, you can scroll down to see a version that starts at zero. - Confounding variable: Confounding variables (like global pandemics) will cause two variables to look connected when in fact a "sneaky third" variable is influencing both of them behind the scenes.
- Outliers: Some datasets here have outliers which drag up the correlation.
In concept, "outlier" just means "way different than the rest of your dataset." When calculating a correlation like this, they are particularly impactful because a single outlier can substantially increase your correlation.
Because this page is automatically generated, I don't know whether any of the charts displayed on it have outliers. I'm just a footnote. ¯\_(ツ)_/¯
I intentionally mishandeled outliers, which makes the correlation look extra strong. - Low n: There are not many data points included in some of these charts.
You can do analyses with low ns! But you shouldn't data dredge with a low n.
Even if the p-value is high, we should be suspicious of using so few datapoints in a correlation.
Pro-tip: click on any correlation to see:
- Detailed data sources
- Prompts for the AI-generated content
- Explanations of each of the calculations (correlation, p-value)
- Python code to calculate it yourself


