

Check back later, or email me if you'd enjoy seeing this work in real-time.
Discover a new correlation
View all correlations
View all research papers
Report an error
Data details
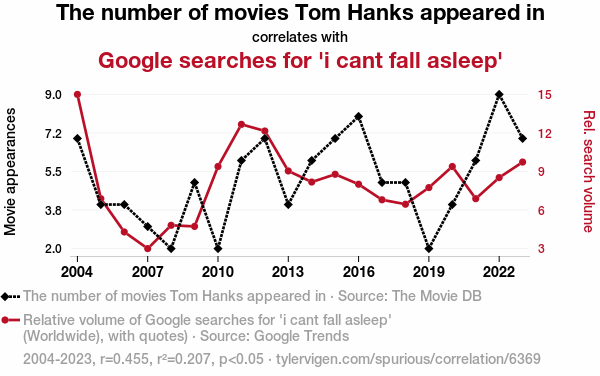
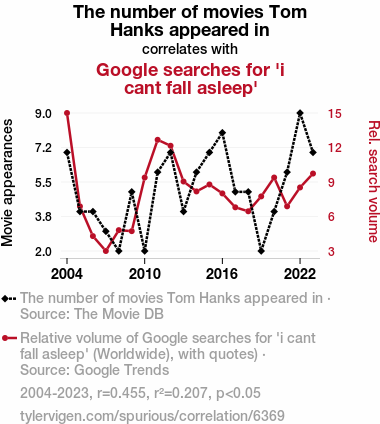
The number of movies Tom Hanks appeared inSource: The Movie DB
Additional Info: Forrest Gump (1994); Apollo 13 (1995); The Da Vinci Code (2006); The Green Mile (1999); The Terminal (2004); Saving Private Ryan (1998); Toy Story (1995); Sleepless in Seattle (1993); Toy Story 3 (2010); Big (1988); Joe Versus the Volcano (1990); Splash (1984); The Money Pit (1986); Road to Perdition (2002); The Man with One Red Shoe (1985); Magnificent Desolation: Walking on the Moon (2005); The Ladykillers (2004); Shooting War (2000); A League of Their Own (1992); Charlie Wilson's War (2007); Turner & Hooch (1989); Cast Away (2000); The 'Burbs (1989); Bachelor Party (1984); You've Got Mail (1998); The Bonfire of the Vanities (1990); That Thing You Do! (1996); Philadelphia (1993); Mazes and Monsters (1982); Angels & Demons (2009); Every Time We Say Goodbye (1986); Nothing in Common (1986); Extremely Loud & Incredibly Close (2011); Volunteers (1985); Small Fry (2011); Hawaiian Vacation (2011); Larry Crowne (2011); Captain Phillips (2013); Killing Lincoln (2013); Cloud Atlas (2012); Bridge of Spies (2015); Inferno (2016); A Hologram for the King (2016); Sully (2016); Boatlift (2011); Toy Story 4 (2019); California Typewriter (2017); The Polar Express (2004); Horatio's Drive: America's First Road Trip (2003); Walking the Mile: The Making of The Green Mile (2000); The David S. Pumpkins Halloween Special (2017); Toy Story 2 (1999); Greyhound (2020); Finch (2021); The Last Mile (2018); News of the World (2020); The 25th Anniversary Rock and Roll Hall of Fame Concerts (2009); Celebrating America (2021); A Night at the Academy Museum (2021); Tom Hanks: Hollywood's Mr Nice Guy (2022); A Man Called Otto (2022); Earth to America (2005); 'Tis the Season: The Holidays on Screen (2022); A Timeless Call (2008); Die Tom Hanks Story (2021); Catch Me If You Can (2002); Dragnet (1987); Punchline (1988); Saving Mr. Banks (2013); Partysaurus Rex (2012); Stephen King: Shining in the Dark (1999); The Circle (2017); Toy Story at 20: To Infinity and Beyond (2015); Defying the Nazis: The Sharps' War (2016); The Post (2017); The Story Behind 'Toy Story' (1996); A Beautiful Day in the Neighborhood (2019); The Dave Clark Five and Beyond: Glad All Over (2014); Elvis (2022); Die Clint Eastwood Story (2018); Pinocchio (2022); Inventing David Geffen (2012); Toy Story of Terror! (2013); Through the Eyes of Forrest Gump (1994); Toy Story That Time Forgot (2014); Everything Is Copy (2015); The Harryhausen Chronicles (1997); The Mayo Clinic (2018); Quincy (2018); People Like Us: Making 'Philadelphia' (2004); Borat Subsequent Moviefilm (2020); Asteroid City (2023); Just a Boy From Tupelo: Bringing Elvis to the Big Screen (2023); Tom Hanks: The Nomad (2023); The Great Buck Howard (2008); Return with Honor (1999); Mike Nichols: An American Master (2016); The Universal Story (1996); Pennis from Heaven (2005); Making 'Saving Private Ryan' (2004); The Real Mary Poppins (2014); Who Killed the Electric Car? (2006); 'Saving Private Ryan': Boot Camp (2023); He Knows You're Alone (1980); Spielberg (2017); Catch Me If You Can: Behind the Camera (2003); The Road We've Traveled (2012); Exclusively Elvis: A Special Edition of 20/20 (2022); Lost Moon: The Triumph of Apollo 13 (1996); The Concert for Valor (2014); Ithaca (2015); Rebels of Oakland: The A's, The Raiders, The '70s (2003); A Grammy Salute to The Beach Boys (2023); There's Something About Romcoms (2016); Sully: Sully Sullenberger - The Man Behind the Miracle (2016); Making a 'Splash' (2004); We Are One With President-Elect Barack Obama (2009); Norman Lear: 100 Years of Music and Laughter (2022); I'll Be Waiting (1993); Elvis Has Left the Building (2004); Saturday Night Live: 15th Anniversary (1989); Vault of Horror I (1994); And the Oscar Goes to... (2014); Making 'Toy Story' (1995); Halftime (2022); Radioman (2012); Beyond All Boundaries (2009); Who Needs Sleep? (2006); The Extraordinary Voyage (2011); The Celluloid Closet (1996); Disney 100: A Century of Dreams - A Special Edition of 20/20 (2023); America: A Tribute to Heroes (2001); The Best of Disney: 50 Years of Magic (1991); Rescued from the Closet (2001); Electric City (2016); The Pixar Story (2007); Beyond Infinity: Buzz and the Journey to Lightyear (2022); Close Up (2012); Saturday Night Live: 25th Anniversary Special (1999); The Simpsons Movie (2007); All In (2014); Cars (2006); Beyond Boundaries: The Harvey Weinstein Scandal (2018); The Rutles 2: Can't Buy Me Lunch (2003); Concert for George (2003); Clint Eastwood: A Cinematic Legacy (2021); Final Cut: Ladies and Gentlemen (2012); Saturday Night Live: 40th Anniversary Special (2015); AFI Life Achievement Award: 50th Anniversary Special (2023); Radio Flyer (1992); Noi siamo cinema (2021); Disclosure (2020); Live 8 (2005); The Walk (2015); Misery Loves Comedy (2015); Never Sleep Again: The Elm Street Legacy (2010); Waking Sleeping Beauty (2009)
See what else correlates with The number of movies Tom Hanks appeared in
Google searches for 'i cant fall asleep'
Detailed data title: Relative volume of Google searches for 'i cant fall asleep' (Worldwide), with quotes)
Source: Google Trends
Additional Info: Relative search volume (not absolute numbers)
See what else correlates with Google searches for 'i cant fall asleep'
Correlation is a measure of how much the variables move together. If it is 0.99, when one goes up the other goes up. If it is 0.02, the connection is very weak or non-existent. If it is -0.99, then when one goes up the other goes down. If it is 1.00, you probably messed up your correlation function.
r2 = 0.2065707 (Coefficient of determination)
This means 20.7% of the change in the one variable (i.e., Google searches for 'i cant fall asleep') is predictable based on the change in the other (i.e., The number of movies Tom Hanks appeared in) over the 20 years from 2004 through 2023.
p < 0.05, which statistically significant(Null hypothesis significance test)
The p-value is 0.0441. 0.0440873166972692200000000000
The p-value is a measure of how probable it is that we would randomly find a result this extreme. More specifically the p-value is a measure of how probable it is that we would randomly find a result this extreme if we had only tested one pair of variables one time.
But I am a p-villain. I absolutely did not test only one pair of variables one time. I correlated hundreds of millions of pairs of variables. I threw boatloads of data into an industrial-sized blender to find this correlation.
Who is going to stop me? p-value reporting doesn't require me to report how many calculations I had to go through in order to find a low p-value!
On average, you will find a correaltion as strong as 0.45 in 4.41% of random cases. Said differently, if you correlated 23 random variables Which I absolutely did.
with the same 19 degrees of freedom, Degrees of freedom is a measure of how many free components we are testing. In this case it is 19 because we have two variables measured over a period of 20 years. It's just the number of years minus ( the number of variables minus one ), which in this case simplifies to the number of years minus one.
you would randomly expect to find a correlation as strong as this one.
[ 0.01, 0.75 ] 95% correlation confidence interval (using the Fisher z-transformation)
The confidence interval is an estimate the range of the value of the correlation coefficient, using the correlation itself as an input. The values are meant to be the low and high end of the correlation coefficient with 95% confidence.
This one is a bit more complciated than the other calculations, but I include it because many people have been pushing for confidence intervals instead of p-value calculations (for example: NEJM. However, if you are dredging data, you can reliably find yourself in the 5%. That's my goal!
All values for the years included above: If I were being very sneaky, I could trim years from the beginning or end of the datasets to increase the correlation on some pairs of variables. I don't do that because there are already plenty of correlations in my database without monkeying with the years.
Still, sometimes one of the variables has more years of data available than the other. This page only shows the overlapping years. To see all the years, click on "See what else correlates with..." link above.
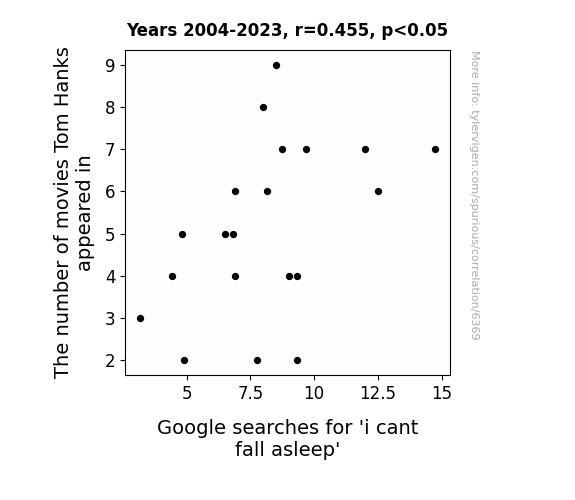
| 2004 | 2005 | 2006 | 2007 | 2008 | 2009 | 2010 | 2011 | 2012 | 2013 | 2014 | 2015 | 2016 | 2017 | 2018 | 2019 | 2020 | 2021 | 2022 | 2023 | |
| The number of movies Tom Hanks appeared in (Movie appearances) | 7 | 4 | 4 | 3 | 2 | 5 | 2 | 6 | 7 | 4 | 6 | 7 | 8 | 5 | 5 | 2 | 4 | 6 | 9 | 7 |
| Google searches for 'i cant fall asleep' (Rel. search volume) | 14.75 | 6.91667 | 4.41667 | 3.16667 | 4.91667 | 4.83333 | 9.33333 | 12.5 | 12 | 9 | 8.16667 | 8.75 | 8 | 6.83333 | 6.5 | 7.75 | 9.33333 | 6.91667 | 8.5 | 9.66667 |
Why this works
- Data dredging: I have 25,153 variables in my database. I compare all these variables against each other to find ones that randomly match up. That's 632,673,409 correlation calculations! This is called “data dredging.” Instead of starting with a hypothesis and testing it, I instead abused the data to see what correlations shake out. It’s a dangerous way to go about analysis, because any sufficiently large dataset will yield strong correlations completely at random.
- Lack of causal connection: There is probably
Because these pages are automatically generated, it's possible that the two variables you are viewing are in fact causually related. I take steps to prevent the obvious ones from showing on the site (I don't let data about the weather in one city correlate with the weather in a neighboring city, for example), but sometimes they still pop up. If they are related, cool! You found a loophole.
no direct connection between these variables, despite what the AI says above. This is exacerbated by the fact that I used "Years" as the base variable. Lots of things happen in a year that are not related to each other! Most studies would use something like "one person" in stead of "one year" to be the "thing" studied. - Observations not independent: For many variables, sequential years are not independent of each other. If a population of people is continuously doing something every day, there is no reason to think they would suddenly change how they are doing that thing on January 1. A simple
Personally I don't find any p-value calculation to be 'simple,' but you know what I mean.
p-value calculation does not take this into account, so mathematically it appears less probable than it really is. - Outlandish outliers: There are "outliers" in this data.
In concept, "outlier" just means "way different than the rest of your dataset." When calculating a correlation like this, they are particularly impactful because a single outlier can substantially increase your correlation.
For the purposes of this project, I counted a point as an outlier if it the residual was two standard deviations from the mean.
(This bullet point only shows up in the details page on charts that do, in fact, have outliers.)
They stand out on the scatterplot above: notice the dots that are far away from any other dots. I intentionally mishandeled outliers, which makes the correlation look extra strong.
Try it yourself
You can calculate the values on this page on your own! Try running the Python code to see the calculation results. Step 1: Download and install Python on your computer.Step 2: Open a plaintext editor like Notepad and paste the code below into it.
Step 3: Save the file as "calculate_correlation.py" in a place you will remember, like your desktop. Copy the file location to your clipboard. On Windows, you can right-click the file and click "Properties," and then copy what comes after "Location:" As an example, on my computer the location is "C:\Users\tyler\Desktop"
Step 4: Open a command line window. For example, by pressing start and typing "cmd" and them pressing enter.
Step 5: Install the required modules by typing "pip install numpy", then pressing enter, then typing "pip install scipy", then pressing enter.
Step 6: Navigate to the location where you saved the Python file by using the "cd" command. For example, I would type "cd C:\Users\tyler\Desktop" and push enter.
Step 7: Run the Python script by typing "python calculate_correlation.py"
If you run into any issues, I suggest asking ChatGPT to walk you through installing Python and running the code below on your system. Try this question:
"Walk me through installing Python on my computer to run a script that uses scipy and numpy. Go step-by-step and ask me to confirm before moving on. Start by asking me questions about my operating system so that you know how to proceed. Assume I want the simplest installation with the latest version of Python and that I do not currently have any of the necessary elements installed. Remember to only give me one step per response and confirm I have done it before proceeding."
# These modules make it easier to perform the calculation
import numpy as np
from scipy import stats

# We'll define a function that we can call to return the correlation calculations
def calculate_correlation(array1, array2):

    # Calculate Pearson correlation coefficient and p-value
    correlation, p_value = stats.pearsonr(array1, array2)

    # Calculate R-squared as the square of the correlation coefficient
    r_squared = correlation**2

    return correlation, r_squared, p_value

# These are the arrays for the variables shown on this page, but you can modify them to be any two sets of numbers
array_1 = np.array([7,4,4,3,2,5,2,6,7,4,6,7,8,5,5,2,4,6,9,7,])
array_2 = np.array([14.75,6.91667,4.41667,3.16667,4.91667,4.83333,9.33333,12.5,12,9,8.16667,8.75,8,6.83333,6.5,7.75,9.33333,6.91667,8.5,9.66667,])
array_1_name = "The number of movies Tom Hanks appeared in"
array_2_name = "Google searches for 'i cant fall asleep'"

# Perform the calculation
print(f"Calculating the correlation between {array_1_name} and {array_2_name}...")
correlation, r_squared, p_value = calculate_correlation(array_1, array_2)

# Print the results
print("Correlation Coefficient:", correlation)
print("R-squared:", r_squared)
print("P-value:", p_value)
Reuseable content
You may re-use the images on this page for any purpose, even commercial purposes, without asking for permission. The only requirement is that you attribute Tyler Vigen. Attribution can take many different forms. If you leave the "tylervigen.com" link in the image, that satisfies it just fine. If you remove it and move it to a footnote, that's fine too. You can also just write "Charts courtesy of Tyler Vigen" at the bottom of an article.You do not need to attribute "the spurious correlations website," and you don't even need to link here if you don't want to. I don't gain anything from pageviews. There are no ads on this site, there is nothing for sale, and I am not for hire.
For the record, I am just one person. Tyler Vigen, he/him/his. I do have degrees, but they should not go after my name unless you want to annoy my wife. If that is your goal, then go ahead and cite me as "Tyler Vigen, A.A. A.A.S. B.A. J.D." Otherwise it is just "Tyler Vigen."
When spoken, my last name is pronounced "vegan," like I don't eat meat.
Full license details.
For more on re-use permissions, or to get a signed release form, see tylervigen.com/permission.
Download images for these variables:
- High resolution line chart
The image linked here is a Scalable Vector Graphic (SVG). It is the highest resolution that is possible to achieve. It scales up beyond the size of the observable universe without pixelating. You do not need to email me asking if I have a higher resolution image. I do not. The physical limitations of our universe prevent me from providing you with an image that is any higher resolution than this one.
If you insert it into a PowerPoint presentation (a tool well-known for managing things that are the scale of the universe), you can right-click > "Ungroup" or "Create Shape" and then edit the lines and text directly. You can also change the colors this way.
Alternatively you can use a tool like Inkscape. - High resolution line chart, optimized for mobile
- Alternative high resolution line chart
- Scatterplot
- Portable line chart (png)
- Portable line chart (png), optimized for mobile
- Line chart for only The number of movies Tom Hanks appeared in
- Line chart for only Google searches for 'i cant fall asleep'
Your correlation inspection deserves a standing ovation!
Correlation ID: 6369 · Black Variable ID: 26592 · Red Variable ID: 1483

