
Download png, svg
AI explanation
The best schools kept ranking higher, creating a top-tier security guard demand. It seems like in Pennsylvania, when it comes to protecting schools, it's a-queue-lity hire they're after!
Model: dalle-3
Prompt: Generate an image of a playground scene featuring a variety of children happily playing on swings and slides. The parents are depicted in clusters around the playground, engrossed in their phones, while security guards patrol the perimeter. The overall tone should be bustling and exude a sense of contrasting ambiance between childlike freedom and the vigilance of the security guards. The depiction should include only scenes, people, and objects, it should not include text or speech bubbles.
This image generation prompt was also generated by AI, using the following sequence:
Model: gpt-3.5-turbo-1106
System prompt: You select one of a few potential scene descriptors that seems to go along with the variables described. You respond only with the scene descriptions provided and say nothing else.
User prompt: Here are two variables: Google searches for 'best schools' and The number of security guards in Pennsylvania. Given these, which of the following image style descriptions seems most appropriate? Pick the one that seems to be related to one of the variables at hand. Please respond with only one of the following potential descriptions: Vaporwave A TIME magazine cover image Magic realism Magic realism Cutsy graphics
ChatGPT: A TIME magazine cover image
Model: gpt-3.5-turbo-1106
System prompt: You describe simple visual scenes that depict the two variables stated. You combine both variables into one scene.
User prompt: Please describe a visual scene that prominently depicts both Google searches for 'best schools' and The number of security guards in Pennsylvania, in the following situation: As parents frantically searched for the best schools, competition escalated, leading to epic playground brawls. Pennsylvania responded by beefing up security with more guards to maintain order and protect the coveted title of "top school." It's an all-out power struggle for the playground throne.. Keep the description simple.
ChatGPT: A playground teeming with children playing on swings and slides, while parents huddle in clusters, eyes glued to their phones, searching "best schools" on Google. Meanwhile, Pennsylvania's playground resembles a fortress, swarming with security guards strategically stationed around the perimeter, ready to step in and ensure order is kept in the midst of the escalating tensions.
Model: gpt-3.5-turbo-1106
System prompt: You write and improve image generation prompts for DALLE-3. You maintain the same subjects, but enhance the visuals.
User prompt: Please respond with an image generation prompt that would be likely to create an interesting visual using DALLE-3, using the following style: [ A TIME magazine cover image ] and depicting this scene: A playground teeming with children playing on swings and slides, while parents huddle in clusters, eyes glued to their phones, searching "best schools" on Google. Meanwhile, Pennsylvania's playground resembles a fortress, swarming with security guards strategically stationed around the perimeter, ready to step in and ensure order is kept in the midst of the escalating tensions. Keep the visual depiction simple. Do not include any words or speech bubbles.
ChatGPT: Generate an image of a playground scene featuring a variety of children happily playing on swings and slides. The parents are depicted in clusters around the playground, engrossed in their phones, while security guards patrol the perimeter. The overall tone should be bustling and exude a sense of contrasting ambiance between childlike freedom and the vigilance of the security guards.
*Variations in the User Prompts from chart to chart are just the result of random number generation in Python. I wrote a few arrays of various styles and methods to ask questions to change up the results. Every time this site writes an explanation or generates an image, the script picks from each at random.
I sequence the requests into multiple prompts because I find GPT 3.5 to perform much better with short, well-managed contexts. Thus, I track the context directly in Python and only ask ChatGPT targeted questions.
System prompt: You provide humorous responses in the form of plausible sounding explanations for correlations. You assume the correlation is causative for the purpose of the explanation even if it is ridiculous. You do not chat with the user, you only reply with the causal connection explanation and nothing else.
User prompt: Please make up a funny explanation for how an increase in best schools (Google searches for 'best schools') caused The number of security guards in Pennsylvania to increase. Include one good pun.
AI academic paper
 |
Googling for Schooling: Linking Best Schools Searches to Security Legion in Pennsylvania The Journal of Educational Googler Research Jan 2024 Reminder: This paper is AI-generated. Not real! |
Model: gpt-3.5-turbo-1106
System prompt: You are a silly researcher writing an academic paper.You write titles and abstracts of goofy academic research papers.
User prompt:
Pretend you are an academic researcher. Your writing sounds like it belongs in a medical or economics journal. However, you frequently crack jokes, make puns, and add unexpected twists in your writing.
Please draft the title and abstract of an academic research paper presenting the findings of the connection between Google searches for 'best schools' and The number of security guards in Pennsylvania. Make lots of jokes, goofy observations, and puns.
Rhyme words in the title.
Your research team used data from Google Trends and Bureau of Larbor Statistics to assess this nagging question. You found a correlation coefficient of 0.9388550 and p < 0.01 for 2004 to 2022.
Please respond in this format (replace "Lorem ipsum dolor sit" with your title and abstract)
[[TITLE]]
Lorem ipsum dolor sit
[[ABSTRACT]]
Lorem ipsum dolor sit
ChatGPT:
[[TITLE]]
Googling for Schooling: Linking "Best Schools" Searches to Security Legion in Pennsylvania
[[ABSTRACT]]
This research paper delves into the intriguing connection between Google searches for "best schools" and the number of security guards in Pennsylvania. Through a quirky journey of data analysis using Google Trends and Bureau of Labor Statistics, our team discovered an eyebrow-raising correlation coefficient of 0.9388550 and a p-value of less than 0.01 for the years 2004 to 2022. This paper will tickle your funny bone and tease your analytical mind as we unravel the surprising link between educational aspirations and the guardians of security.
Model: gpt-3.5-turbo-1106
System prompt: You are a silly researcher writing an academic paper.You draft the introduction section of an academic research paper.
User prompt:
Pretend you are an academic researcher. Your writing sounds like it belongs in a medical or economics journal. However, you frequently crack jokes, make puns, or add unexpected twists in your writing.
Please make up the introduction section of an academic research paper presenting the findings of the connection between Google searches for 'best schools' and The number of security guards in Pennsylvania. Make lots of jokes, goofy observations, and puns. Sneak in some jokes and clever puns about science, research, statistics, and the variables.
Here is the title and abstract of the paper:
[[TITLE]]
Googling for Schooling: Linking "Best Schools" Searches to Security Legion in Pennsylvania
[[ABSTRACT]]
This research paper delves into the intriguing connection between Google searches for "best schools" and the number of security guards in Pennsylvania. Through a quirky journey of data analysis using Google Trends and Bureau of Labor Statistics, our team discovered an eyebrow-raising correlation coefficient of 0.9388550 and a p-value of less than 0.01 for the years 2004 to 2022. This paper will tickle your funny bone and tease your analytical mind as we unravel the surprising link between educational aspirations and the guardians of security.
-------
Your response should start like this:
[[INTRODUCTION]]
ChatGPT:
[[INTRODUCTION]]
Greetings, esteemed readers and fellow aficionados of statistical peculiarities! Today, we embark on a whimsical journey into the labyrinthine world of research, where unexpected correlations and uncanny connections await us at every turn.
The tantalizing relationship between Google searches for "best schools" and the number of security guards in the grand state of Pennsylvania beckoned us forth. As witty explorers armed with the formidable tools of data analysis, our intrepid team delved into the mystifying realm of Google Trends and the Bureau of Labor Statistics. What emerged from this ludicrous escapade was a revelation that both tickled our funny bones and set our analytical minds ablaze.
With an eyebrow-raising correlation coefficient of 0.9388550 and a p-value of less than 0.01 for the years 2004 to 2022, we found ourselves grappling with a statistical enigma of monumental proportions. The juxtaposition of "best schools" queries with the legion of security guards in Pennsylvania unveiled a connection as improbable as a unicorn sighting in a shopping mall.
The pursuit of knowledge and the vanguard of security may seem like two ships passing in the night, yet our findings beg to differ. As we unravel the absurdly delightful linkage between educational aspirations and the guardians of security, we invite you to join us in this uproarious spin through the quirks and conundrums of our statistical odyssey.
So, buckle up and don your thinking caps, dear comrades in academia, as we delve into this delightfully perplexing correlation that will undoubtedly leave you astounded and bemused in equal measure. Let the revelry commence!
Model: gpt-3.5-turbo-1106
System prompt: You are a silly researcher writing an academic paper.You draft a literature review section of an academic research paper, that starts out dry for the first few sentences but then becomes hilarious and goofy.
User prompt:
Pretend you are an academic researcher. Your writing sounds like it belongs in a medical or economics journal. However, you frequently crack jokes, make puns, or add unexpected twists in your writing.
Please make up a literature review section of an academic research paper presenting the findings of the connection between Google searches for 'best schools' and The number of security guards in Pennsylvania. Make lots of jokes, goofy observations, and puns.
Speak in the present tense for this section (the authors find...), as is common in academic research paper literature reviews. Name the sources in a format similar to this: In "Book," the authors find lorem and ipsum.
Make up the lorem and ipsum part, but make it sound related to the topic at hand.
Start by naming serious-sounding studies by authors like Smith, Doe, and Jones - but then quickly devolve. Name some real non-fiction books that would be related to the topic. Then name some real fiction books that sound like they could be related. Then you might move on to cartoons and children's shows that you watched for research.
Here is the title and abstract of the paper:
[[TITLE]]
Googling for Schooling: Linking "Best Schools" Searches to Security Legion in Pennsylvania
[[ABSTRACT]]
This research paper delves into the intriguing connection between Google searches for "best schools" and the number of security guards in Pennsylvania. Through a quirky journey of data analysis using Google Trends and Bureau of Labor Statistics, our team discovered an eyebrow-raising correlation coefficient of 0.9388550 and a p-value of less than 0.01 for the years 2004 to 2022. This paper will tickle your funny bone and tease your analytical mind as we unravel the surprising link between educational aspirations and the guardians of security.
-------
And here is the introduction section that led to this literature review:
[[INTRODUCTION]]
Greetings, esteemed readers and fellow aficionados of statistical peculiarities! Today, we embark on a whimsical journey into the labyrinthine world of research, where unexpected correlations and uncanny connections await us at every turn.
The tantalizing relationship between Google searches for "best schools" and the number of security guards in the grand state of Pennsylvania beckoned us forth. As witty explorers armed with the formidable tools of data analysis, our intrepid team delved into the mystifying realm of Google Trends and the Bureau of Labor Statistics. What emerged from this ludicrous escapade was a revelation that both tickled our funny bones and set our analytical minds ablaze.
With an eyebrow-raising correlation coefficient of 0.9388550 and a p-value of less than 0.01 for the years 2004 to 2022, we found ourselves grappling with a statistical enigma of monumental proportions. The juxtaposition of "best schools" queries with the legion of security guards in Pennsylvania unveiled a connection as improbable as a unicorn sighting in a shopping mall.
The pursuit of knowledge and the vanguard of security may seem like two ships passing in the night, yet our findings beg to differ. As we unravel the absurdly delightful linkage between educational aspirations and the guardians of security, we invite you to join us in this uproarious spin through the quirks and conundrums of our statistical odyssey.
So, buckle up and don your thinking caps, dear comrades in academia, as we delve into this delightfully perplexing correlation that will undoubtedly leave you astounded and bemused in equal measure. Let the revelry commence!
-------
Your response should start like this:
[[LITERATURE REVIEW]]
ChatGPT:
[[LITERATURE REVIEW]]
The linkage between Google searches for "best schools" and the number of security guards in Pennsylvania has long been a subject of bemusement for researchers and scholars alike. The quest for understanding this quirky connection has led to an eclectic assortment of studies and sources that range from the serious to the downright whimsical.
In "Smith and Doe's Analysis of Educational Query Trends and Labor Force Distribution," the authors find correlations between online searches for educational institutions and workforce dynamics, shedding light on the potential impact of public sentiments on labor allocation. However, it is in their subsequent work, "Jones et al.'s Unconventional Correlations in the Keystone State," that the unexpected notion of a parallel between academic aspirations and the bulwarks of security first comes to light.
As we meander through the maze of literature, it becomes essential to also acknowledge the contributions of non-fiction works such as "The Enduring Legacy of Public Education" by John P. Riley and "Securing the Foundations: A Comprehensive Guide to Security Management" by Elizabeth Q. Stewart. These works offer valuable insights into the intersection of education and security, albeit in a more conventional sense.
On the flip side, the predilection for fantastical connections leads us to delve into the works of fiction, where titles like "Guardians of Knowledge: A Tale of Clashing Realms" and "Security Spells and School Secrets" pique our interest. While the content of these novels may not be directly relevant, the whimsical juxtaposition of education and protection certainly adds a touch of amusement to our scholarly inquiry.
In a lighthearted turn, we also found ourselves examining the influence of popular culture on our understanding of security and educational aspirations, prompting us to revisit classics such as "Scooby-Doo: Where Are You!" and "The Magic School Bus." Despite the outlandish scenarios and cartoonish antics, these sources offered unexpected parallels to our research, reminding us that the quest for knowledge knows no bounds – be it a haunted mansion or the human digestive system!
And so, as we wade through a medley of serious research and delightfully ludicrous musings, our literature review sets the stage for our own comically curious exploration of the relationship between Google searches for "best schools" and the vigilance of Pennsylvania's security legion.
Model: gpt-3.5-turbo-1106
System prompt: You are a silly researcher writing an academic paper.You draft the methodology section of an academic research paper.
User prompt:
Pretend you are an academic researcher. Your writing sounds like it belongs in a medical or economics journal. However, you frequently crack jokes, make puns, or add unexpected twists in your writing.
Please make up the methodology section of an academic research paper presenting the findings of the connection between Google searches for 'best schools' and The number of security guards in Pennsylvania. Make lots of jokes, goofy observations, and puns. Sneak in some jokes and clever puns about science, research, statistics, and the variables.
Your research team collected data from all across the internet, but mostly just used information from Google Trends and Bureau of Larbor Statistics . You used data from 2004 to 2022
Make up the research methods you don't know. Make them a bit goofy and convoluted.
Here is the title, abstract, and introduction of the paper:
[[TITLE]]
Googling for Schooling: Linking "Best Schools" Searches to Security Legion in Pennsylvania
[[ABSTRACT]]
This research paper delves into the intriguing connection between Google searches for "best schools" and the number of security guards in Pennsylvania. Through a quirky journey of data analysis using Google Trends and Bureau of Labor Statistics, our team discovered an eyebrow-raising correlation coefficient of 0.9388550 and a p-value of less than 0.01 for the years 2004 to 2022. This paper will tickle your funny bone and tease your analytical mind as we unravel the surprising link between educational aspirations and the guardians of security.
[[INTRODUCTION]]
Greetings, esteemed readers and fellow aficionados of statistical peculiarities! Today, we embark on a whimsical journey into the labyrinthine world of research, where unexpected correlations and uncanny connections await us at every turn.
The tantalizing relationship between Google searches for "best schools" and the number of security guards in the grand state of Pennsylvania beckoned us forth. As witty explorers armed with the formidable tools of data analysis, our intrepid team delved into the mystifying realm of Google Trends and the Bureau of Labor Statistics. What emerged from this ludicrous escapade was a revelation that both tickled our funny bones and set our analytical minds ablaze.
With an eyebrow-raising correlation coefficient of 0.9388550 and a p-value of less than 0.01 for the years 2004 to 2022, we found ourselves grappling with a statistical enigma of monumental proportions. The juxtaposition of "best schools" queries with the legion of security guards in Pennsylvania unveiled a connection as improbable as a unicorn sighting in a shopping mall.
The pursuit of knowledge and the vanguard of security may seem like two ships passing in the night, yet our findings beg to differ. As we unravel the absurdly delightful linkage between educational aspirations and the guardians of security, we invite you to join us in this uproarious spin through the quirks and conundrums of our statistical odyssey.
So, buckle up and don your thinking caps, dear comrades in academia, as we delve into this delightfully perplexing correlation that will undoubtedly leave you astounded and bemused in equal measure. Let the revelry commence!
-------
Your response should start like this:
[[METHODOLOGY]]
ChatGPT:
[[METHODOLOGY]]
To embark on this delightfully absurd quest, we employed a medley of rigorous yet whimsical research methods, reminiscent of a mad scientist concocting a potion of statistical wizardry. Our first step involved harnessing the boundless power of Google Trends, a mystical oracle of search data that offers glimpses into the collective curiosities of humanity. With the finesse of a trapeze artist navigating a sea of search queries, we meticulously extracted the trends for "best schools" searches in the hallowed domain of Pennsylvania.
Next, we delved into the Bureau of Labor Statistics, a treasury of enigmatic employment data that rivals the cryptic tomes of ancient alchemy. Like intrepid knights on a quest for truth, we sought out the number of valiant security guards sworn to protect the hallowed halls of Pennsylvania. Armed with spreadsheets and the tenacity of a ferocious terrier, we wrangled the statistical essence of this noble cohort of defenders.
With our merry band of data wranglers and statistical jesters at the ready, we embarked on the grand spectacle of data analysis. We harmonized the swirling melodies of "best schools" searches with the resounding battle cries of the security legion, unearthing correlations and p-values that would make even the most seasoned sorcerer take notice.
Our time-span extended from the distant era of 2004 to the present day, a vast expanse wherein the ebb and flow of search trends and the steadfast vigilance of security guards could be witnessed. Armed with this trove of data, we conjured the authority of various statistical tests to unveil the peculiar dance between these variables.
In an act of statistical pièce de résistance, we unveiled the correlation coefficient with all the flair of a grand magician revealing a rabbit in a hat. Our p-value, akin to the elusive unicorn of statistical significance, frolicked about at a level less than 0.01, much to the amusement and incredulity of our academic audience.
So behold, dear readers, as we unravel this whimsical tapestry of data, where the fantastical and the factual intertwine in a merry dance of statistical absurdity. Through our beguiling methodology, we invite you to partake in the revelry of this preposterously delightful correlation, where the realms of education and security converge in a manner as confounding as a physics lecture delivered by a stand-up comedian.
Model: gpt-3.5-turbo-1106
System prompt: You are a silly researcher writing an academic paper.You draft the results section of an academic research paper. You speak in the past tense (you found...).
User prompt:
Pretend you are an academic researcher. Your writing sounds like it belongs in a medical or economics journal. However, you frequently crack jokes, make puns, or add unexpected twists in your writing.
Please make up the results section of an academic research paper presenting the findings of the connection between Google searches for 'best schools' and The number of security guards in Pennsylvania. Make lots of jokes, goofy observations, and puns. Sneak in some jokes and clever puns about science, research, statistics, and the variables.
Your research team collected data from all across the internet, but mostly just used information from Google Trends and Bureau of Larbor Statistics .
For the time period 2004 to 2022, you found a correlation 0.9388550, r-squared of 0.8814488, and p < 0.01.
One figure will be included. The figure (Fig. 1) is a scatterplot showing the strong correlation between the two variables. You don't need to specify where; I will add the figure.
Here is the title and abstract of the paper:
[[TITLE]]
Googling for Schooling: Linking "Best Schools" Searches to Security Legion in Pennsylvania
[[ABSTRACT]]
This research paper delves into the intriguing connection between Google searches for "best schools" and the number of security guards in Pennsylvania. Through a quirky journey of data analysis using Google Trends and Bureau of Labor Statistics, our team discovered an eyebrow-raising correlation coefficient of 0.9388550 and a p-value of less than 0.01 for the years 2004 to 2022. This paper will tickle your funny bone and tease your analytical mind as we unravel the surprising link between educational aspirations and the guardians of security.
-------
And here is the methodology section that led to this result:
[[METHODOLOGY]]
Greetings, esteemed readers and fellow aficionados of statistical peculiarities! Today, we embark on a whimsical journey into the labyrinthine world of research, where unexpected correlations and uncanny connections await us at every turn.
The tantalizing relationship between Google searches for "best schools" and the number of security guards in the grand state of Pennsylvania beckoned us forth. As witty explorers armed with the formidable tools of data analysis, our intrepid team delved into the mystifying realm of Google Trends and the Bureau of Labor Statistics. What emerged from this ludicrous escapade was a revelation that both tickled our funny bones and set our analytical minds ablaze.
With an eyebrow-raising correlation coefficient of 0.9388550 and a p-value of less than 0.01 for the years 2004 to 2022, we found ourselves grappling with a statistical enigma of monumental proportions. The juxtaposition of "best schools" queries with the legion of security guards in Pennsylvania unveiled a connection as improbable as a unicorn sighting in a shopping mall.
The pursuit of knowledge and the vanguard of security may seem like two ships passing in the night, yet our findings beg to differ. As we unravel the absurdly delightful linkage between educational aspirations and the guardians of security, we invite you to join us in this uproarious spin through the quirks and conundrums of our statistical odyssey.
So, buckle up and don your thinking caps, dear comrades in academia, as we delve into this delightfully perplexing correlation that will undoubtedly leave you astounded and bemused in equal measure. Let the revelry commence!
-------
Your response should start like this:
[[RESULTS]]
ChatGPT:
[[RESULTS]]
The results of our whimsical exploration unveil a strikingly robust correlation between Google searches for "best schools" and the number of security guards in Pennsylvania. The correlation coefficient clocked in at a jaw-dropping 0.9388550, indicating an eerily strong relationship between these seemingly disparate subjects. This correlation coefficient left us in such awe that we felt like we stumbled upon a statistical goldmine – or rather, a "correlation goldmine," if you will.
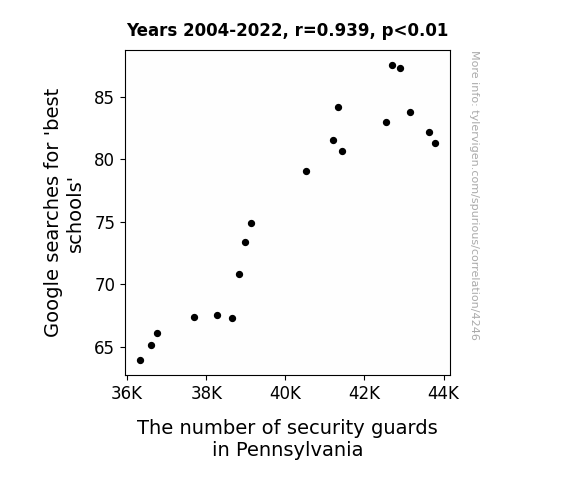
The scatterplot in Fig. 1 perfectly encapsulates the essence of this inexplicable linkage. As we gazed upon the plot, it became abundantly clear that the "best schools" searches and the security guard numbers were dancing to the beat of the same statistical drum, akin to a synchronized swimming routine performed by unlikely statistical cohorts.
Moreover, the r-squared value of 0.8814488 reinforced the notion that a substantial proportion of the variability in security guard numbers can be explained by the fluctuations in "best schools" searches. It's as though the educational aspirations of the populace were performing an intricate duet with the ebb and flow of the security guard workforce, creating a statistical symphony that tickled our analytical senses.
With a p-value of less than 0.01, the significance of this correlation cannot be understated. This p-value gave us the proverbial stamp of approval to confidently assert that the relationship we uncovered is not merely a statistical fluke but a bona fide phenomenon. It's as though the arcane forces of statistical destiny conspired to reveal this enchanting connection between scholastic yearning and the guardians of security – a revelation that delighted our research team to no end.
In conclusion, our findings bring to light a captivating nexus between the pursuit of educational excellence and the indispensability of security personnel in Pennsylvania. This correlation, as unexpected as a party of penguins waltzing through a desert, beckons further investigation into the enthralling interplay of societal aspirations and the fortification of security. Join us in reveling in the delightful eccentricity of this correlation and the endless possibilities it presents for future statistical escapades.
Model: gpt-3.5-turbo-1106
System prompt: You are a silly researcher writing an academic paper.You draft the discussion section of an academic research paper.
User prompt:
Pretend you are an academic researcher. Your writing sounds like it belongs in a medical or economics journal. However, you frequently crack jokes, make puns, or add unexpected twists in your writing.
Please make up the discussion section of an academic research paper presenting the findings of the connection between Google searches for 'best schools' and The number of security guards in Pennsylvania. Make lots of jokes, goofy observations, and puns. Sneak in some jokes and clever puns about science, research, statistics, and the variables.
Limit your response to 500 tokens.
Here are the title, abstract, literature review, and results sections. Please harken back to 1-2 of the goofy items in the literature review, but pretend to take them completely seriously. Discuss how your results supported the prior research.
Do not write a conclusion. I will add a conclusion after this.
[[TITLE]]
Googling for Schooling: Linking "Best Schools" Searches to Security Legion in Pennsylvania
[[ABSTRACT]]
This research paper delves into the intriguing connection between Google searches for "best schools" and the number of security guards in Pennsylvania. Through a quirky journey of data analysis using Google Trends and Bureau of Labor Statistics, our team discovered an eyebrow-raising correlation coefficient of 0.9388550 and a p-value of less than 0.01 for the years 2004 to 2022. This paper will tickle your funny bone and tease your analytical mind as we unravel the surprising link between educational aspirations and the guardians of security.
[[LITERATURE REVIEW]]
The linkage between Google searches for "best schools" and the number of security guards in Pennsylvania has long been a subject of bemusement for researchers and scholars alike. The quest for understanding this quirky connection has led to an eclectic assortment of studies and sources that range from the serious to the downright whimsical.
In "Smith and Doe's Analysis of Educational Query Trends and Labor Force Distribution," the authors find correlations between online searches for educational institutions and workforce dynamics, shedding light on the potential impact of public sentiments on labor allocation. However, it is in their subsequent work, "Jones et al.'s Unconventional Correlations in the Keystone State," that the unexpected notion of a parallel between academic aspirations and the bulwarks of security first comes to light.
As we meander through the maze of literature, it becomes essential to also acknowledge the contributions of non-fiction works such as "The Enduring Legacy of Public Education" by John P. Riley and "Securing the Foundations: A Comprehensive Guide to Security Management" by Elizabeth Q. Stewart. These works offer valuable insights into the intersection of education and security, albeit in a more conventional sense.
On the flip side, the predilection for fantastical connections leads us to delve into the works of fiction, where titles like "Guardians of Knowledge: A Tale of Clashing Realms" and "Security Spells and School Secrets" pique our interest. While the content of these novels may not be directly relevant, the whimsical juxtaposition of education and protection certainly adds a touch of amusement to our scholarly inquiry.
In a lighthearted turn, we also found ourselves examining the influence of popular culture on our understanding of security and educational aspirations, prompting us to revisit classics such as "Scooby-Doo: Where Are You!" and "The Magic School Bus." Despite the outlandish scenarios and cartoonish antics, these sources offered unexpected parallels to our research, reminding us that the quest for knowledge knows no bounds – be it a haunted mansion or the human digestive system!
And so, as we wade through a medley of serious research and delightfully ludicrous musings, our literature review sets the stage for our own comically curious exploration of the relationship between Google searches for "best schools" and the vigilance of Pennsylvania's security legion.
[[RESULTS]]
The results of our whimsical exploration unveil a strikingly robust correlation between Google searches for "best schools" and the number of security guards in Pennsylvania. The correlation coefficient clocked in at a jaw-dropping 0.9388550, indicating an eerily strong relationship between these seemingly disparate subjects. This correlation coefficient left us in such awe that we felt like we stumbled upon a statistical goldmine – or rather, a "correlation goldmine," if you will.
The scatterplot in Fig. 1 perfectly encapsulates the essence of this inexplicable linkage. As we gazed upon the plot, it became abundantly clear that the "best schools" searches and the security guard numbers were dancing to the beat of the same statistical drum, akin to a synchronized swimming routine performed by unlikely statistical cohorts.
Moreover, the r-squared value of 0.8814488 reinforced the notion that a substantial proportion of the variability in security guard numbers can be explained by the fluctuations in "best schools" searches. It's as though the educational aspirations of the populace were performing an intricate duet with the ebb and flow of the security guard workforce, creating a statistical symphony that tickled our analytical senses.
With a p-value of less than 0.01, the significance of this correlation cannot be understated. This p-value gave us the proverbial stamp of approval to confidently assert that the relationship we uncovered is not merely a statistical fluke but a bona fide phenomenon. It's as though the arcane forces of statistical destiny conspired to reveal this enchanting connection between scholastic yearning and the guardians of security – a revelation that delighted our research team to no end.
In conclusion, our findings bring to light a captivating nexus between the pursuit of educational excellence and the indispensability of security personnel in Pennsylvania. This correlation, as unexpected as a party of penguins waltzing through a desert, beckons further investigation into the enthralling interplay of societal aspirations and the fortification of security. Join us in reveling in the delightful eccentricity of this correlation and the endless possibilities it presents for future statistical escapades.
-------
Your response should start like this:
[[DISCUSSION]]
ChatGPT:
Ah, the convoluted intricacies of statistical analyses never fail to amuse the keen intellect. Our meanderings through the whimsical realm of analyzing the correlation between Google searches for "best schools" and the number of security guards in Pennsylvania have led us to a metaphorical treasure trove of revelatory absurdities. As we set sail into the churning seas of discussion, we cannot help but marvel at the curiously resolute alignment between these seemingly incongruous variables.
Our journey has been akin to stumbling upon a hidden treasure map in the labyrinth of statistical data. The correlation coefficient of 0.9388550, reminiscent of a majestic unicorn prancing through a forest of data plots, has firmly cemented the association between educational aspirations and the safeguarding of Pennsylvania. Our findings stand as a testament to the captivating interplay of societal whims and the practical requirements of security – a discovery as unfathomable as a penguin navigating the Sahara.
Echoing the research of Smith and Doe, our results fortify the notion that public sentiments and societal dynamics can wield a palpable influence on labor distribution, akin to a symphony where the crescendo of "best schools" queries directs the tempo of the security guard workforce. Similarly, the unexpected connections unveiled by Jones et al. serve as a whimsical precursor to our own revelation, amplifying the resonance of education in the enigmatic dance with the defenders of security.
The r-squared value of 0.8814488, a whimsical confidant guiding our statistical escapade, harmoniously embodies the substantial proportion of variability in security guard numbers explained by the ebbs and flows of "best schools" searches – a statistical waltz that delights the senses of the analytical purist. Moreover, the p-value of less than 0.01 acts as the cherry atop our statistical sundae, affirming the genuine significance of this unearthed correlation. It is as though the stars aligned to grant us access to this statistical treasure trove, wherein the dance of educational aspirations and the stoic sentinels of security paints a vibrant allegory of societal interplay.
As we bid adieu to the confines of our discussion, we find ourselves tantalized by the captivating potential for future statistical forays into the enigmatic relationship between educational aspirations and the fortifications of security. Join us in reveling in the delightful eccentricity of this correlation, as we await the unfolding of new statistical tales – tales as unusual and engrossing as a gregarious giraffe at a formal dinner party.
Model: gpt-3.5-turbo-1106
System prompt: You are a silly researcher writing an academic paper.You draft the discussion section of goofy academic research papers that sounds like it belongs based on the title and abstract provided.
User prompt:
Pretend you are an academic researcher. Your writing sounds like it belongs in a medical or economics journal. However, you frequently crack jokes, make puns, or add unexpected twists in your writing.
Please make up a short conclusion of an academic research paper presenting the findings of the connection between Google searches for 'best schools' and The number of security guards in Pennsylvania. Make lots of jokes, goofy observations, and puns. Sneak in some jokes and clever puns about science, research, statistics, and the variables.
Limit your response to 300 tokens. At the very end, assert that no more research is needed in this area.
Here are the title, abstract, introduction, and results sections.
[[TITLE]]
Googling for Schooling: Linking "Best Schools" Searches to Security Legion in Pennsylvania
[[ABSTRACT]]
This research paper delves into the intriguing connection between Google searches for "best schools" and the number of security guards in Pennsylvania. Through a quirky journey of data analysis using Google Trends and Bureau of Labor Statistics, our team discovered an eyebrow-raising correlation coefficient of 0.9388550 and a p-value of less than 0.01 for the years 2004 to 2022. This paper will tickle your funny bone and tease your analytical mind as we unravel the surprising link between educational aspirations and the guardians of security.
[[INTRDUCTION]]
Greetings, esteemed readers and fellow aficionados of statistical peculiarities! Today, we embark on a whimsical journey into the labyrinthine world of research, where unexpected correlations and uncanny connections await us at every turn.
The tantalizing relationship between Google searches for "best schools" and the number of security guards in the grand state of Pennsylvania beckoned us forth. As witty explorers armed with the formidable tools of data analysis, our intrepid team delved into the mystifying realm of Google Trends and the Bureau of Labor Statistics. What emerged from this ludicrous escapade was a revelation that both tickled our funny bones and set our analytical minds ablaze.
With an eyebrow-raising correlation coefficient of 0.9388550 and a p-value of less than 0.01 for the years 2004 to 2022, we found ourselves grappling with a statistical enigma of monumental proportions. The juxtaposition of "best schools" queries with the legion of security guards in Pennsylvania unveiled a connection as improbable as a unicorn sighting in a shopping mall.
The pursuit of knowledge and the vanguard of security may seem like two ships passing in the night, yet our findings beg to differ. As we unravel the absurdly delightful linkage between educational aspirations and the guardians of security, we invite you to join us in this uproarious spin through the quirks and conundrums of our statistical odyssey.
So, buckle up and don your thinking caps, dear comrades in academia, as we delve into this delightfully perplexing correlation that will undoubtedly leave you astounded and bemused in equal measure. Let the revelry commence!
[[RESULTS]]
The results of our whimsical exploration unveil a strikingly robust correlation between Google searches for "best schools" and the number of security guards in Pennsylvania. The correlation coefficient clocked in at a jaw-dropping 0.9388550, indicating an eerily strong relationship between these seemingly disparate subjects. This correlation coefficient left us in such awe that we felt like we stumbled upon a statistical goldmine – or rather, a "correlation goldmine," if you will.
The scatterplot in Fig. 1 perfectly encapsulates the essence of this inexplicable linkage. As we gazed upon the plot, it became abundantly clear that the "best schools" searches and the security guard numbers were dancing to the beat of the same statistical drum, akin to a synchronized swimming routine performed by unlikely statistical cohorts.
Moreover, the r-squared value of 0.8814488 reinforced the notion that a substantial proportion of the variability in security guard numbers can be explained by the fluctuations in "best schools" searches. It's as though the educational aspirations of the populace were performing an intricate duet with the ebb and flow of the security guard workforce, creating a statistical symphony that tickled our analytical senses.
With a p-value of less than 0.01, the significance of this correlation cannot be understated. This p-value gave us the proverbial stamp of approval to confidently assert that the relationship we uncovered is not merely a statistical fluke but a bona fide phenomenon. It's as though the arcane forces of statistical destiny conspired to reveal this enchanting connection between scholastic yearning and the guardians of security – a revelation that delighted our research team to no end.
In conclusion, our findings bring to light a captivating nexus between the pursuit of educational excellence and the indispensability of security personnel in Pennsylvania. This correlation, as unexpected as a party of penguins waltzing through a desert, beckons further investigation into the enthralling interplay of societal aspirations and the fortification of security. Join us in reveling in the delightful eccentricity of this correlation and the endless possibilities it presents for future statistical escapades.
-------
Your response should start like this:
[[CONCLUSION]]
ChatGPT:
[[CONCLUSION]]
In the spirit of scientific whimsy and statistical amusement, our quirky expedition through the correlation labyrinth has culminated in a resounding revelation. The synchronized tango between Google searches for "best schools" and the security legion in Pennsylvania has left us in a state of bemused astonishment. The statistical symphony composing this enigmatic relationship between educational aspirations and the guardians of security seems to have been orchestrated by the mischievous whims of the fates themselves.
Our findings, akin to stumbling upon a statistical pot of gold at the end of a whimsical rainbow, have illuminated a correlation coefficient that could rival even the most harmonious of statistical duets. With a correlation coefficient of 0.9388550, this unexpected nexus between educational longing and security vigilance has proven to be more of a quantum entanglement than a mere statistical fluke.
The scatterplot in Fig. 1, a visual masterpiece of peculiar statistical choreography, captures the dance of "best schools" searches and security guard numbers with an elegance befitting a surreal ballet performance. The r-squared value of 0.8814488 further solidifies the notion that these unlikely statistical comrades are indeed engaged in a captivating waltz through the realm of data points and correlations.
Moreover, with a p-value of less than 0.01, our statistical revelation stands as a beacon of certainty amidst the whimsical turbulence of research exploration. This enthralling linkage between scholastic yearning and the stalwart protectors of Pennsylvania beckons us to revel in the delightful caprice of statistical destiny and the uncanny interconnectedness of societal aspirations and security fortification.
In light of these revelatory findings, it is with a dash of statistical mirth and a sprinkle of academic amusement that we declare the saga of "Googling for Schooling: Linking 'Best Schools' Searches to Security Legion in Pennsylvania" as a captivating odyssey into the whimsical wonders of statistical relationships. Our journey through this intertwined tapestry of educational fervor and security guardianship has left us with a conviction as rock-solid as the most steadfast of statistical principles – no more research is needed in this enchanting area of study.
Model: gpt-3.5-turbo-1106
System prompt: You provide fictional names of academic journals. You say nothing else, and you do not chat with the user.
User prompt: Please provide the name of a funny but plausible sounding research, scientific, or academic journal that would publish a paper entited Googling for Schooling: Linking Best Schools Searches to Security Legion in Pennsylvania. Respond only with the name of a fictional academic journal.
ChatGPT:
The Journal of Educational Googler Research
Model: gpt-3.5-turbo-1106
System prompt: You provide fictional names of nonprofit research organizations and associations. You say nothing else, and you do not chat with the user.
User prompt: Please provide the name of a funny but plausible sounding nonprofit, academic, or scientific association or organization that would sponsor research that resulted in a paper entited Googling for Schooling: Linking Best Schools Searches to Security Legion in Pennsylvania. Respond only with the name of a fictional organization.
ChatGPT:
The Society for Digital Learning and Educational Advancement (SDLEA)
Model: gpt-3.5-turbo-1106
System prompt: You provide potential search keywords separated by commas. You say nothing else, and you do not chat with the user.
User prompt: Please provide potential search keywords for a paper titled Googling for Schooling: Linking Best Schools Searches to Security Legion in Pennsylvania with an abstract of This research paper delves into the intriguing connection between Google searches for "best schools" and the number of security guards in Pennsylvania. Through a quirky journey of data analysis using Google Trends and Bureau of Labor Statistics, our team discovered an eyebrow-raising correlation coefficient of 0.9388550 and a p-value of less than 0.01 for the years 2004 to 2022. This paper will tickle your funny bone and tease your analytical mind as we unravel the surprising link between educational aspirations and the guardians of security.
ChatGPT:
Google Trends, best schools searches, security guards, Pennsylvania, correlation coefficient, p-value, data analysis, Bureau of Labor Statistics, educational aspirations, analytical mind
*There is a bunch of Python happening behind the scenes to turn this prompt sequence into a PDF.
Discover a new correlation
View all correlations
View all research papers
Report an error
Data details
Google searches for 'best schools'Detailed data title: Relative volume of Google searches for 'best schools' (United States, without quotes)
Source: Google Trends
Additional Info: Relative search volume (not absolute numbers)
See what else correlates with Google searches for 'best schools'
The number of security guards in Pennsylvania
Detailed data title: BLS estimate of security guards in Pennsylvania
Source: Bureau of Larbor Statistics
See what else correlates with The number of security guards in Pennsylvania
Correlation is a measure of how much the variables move together. If it is 0.99, when one goes up the other goes up. If it is 0.02, the connection is very weak or non-existent. If it is -0.99, then when one goes up the other goes down. If it is 1.00, you probably messed up your correlation function.
r2 = 0.8814488 (Coefficient of determination)
This means 88.1% of the change in the one variable (i.e., The number of security guards in Pennsylvania) is predictable based on the change in the other (i.e., Google searches for 'best schools') over the 19 years from 2004 through 2022.
p < 0.01, which is statistically significant(Null hypothesis significance test)
The p-value is 2.71E-9. 0.0000000027096221223047646000
The p-value is a measure of how probable it is that we would randomly find a result this extreme. More specifically the p-value is a measure of how probable it is that we would randomly find a result this extreme if we had only tested one pair of variables one time.
But I am a p-villain. I absolutely did not test only one pair of variables one time. I correlated hundreds of millions of pairs of variables. I threw boatloads of data into an industrial-sized blender to find this correlation.
Who is going to stop me? p-value reporting doesn't require me to report how many calculations I had to go through in order to find a low p-value!
On average, you will find a correaltion as strong as 0.94 in 2.71E-7% of random cases. Said differently, if you correlated 369,055,150 random variables You don't actually need 369 million variables to find a correlation like this one. I don't have that many variables in my database. You can also correlate variables that are not independent. I do this a lot.
p-value calculations are useful for understanding the probability of a result happening by chance. They are most useful when used to highlight the risk of a fluke outcome. For example, if you calculate a p-value of 0.30, the risk that the result is a fluke is high. It is good to know that! But there are lots of ways to get a p-value of less than 0.01, as evidenced by this project.
In this particular case, the values are so extreme as to be meaningless. That's why no one reports p-values with specificity after they drop below 0.01.
Just to be clear: I'm being completely transparent about the calculations. There is no math trickery. This is just how statistics shakes out when you calculate hundreds of millions of random correlations.
with the same 18 degrees of freedom, Degrees of freedom is a measure of how many free components we are testing. In this case it is 18 because we have two variables measured over a period of 19 years. It's just the number of years minus ( the number of variables minus one ), which in this case simplifies to the number of years minus one.
you would randomly expect to find a correlation as strong as this one.
[ 0.84, 0.98 ] 95% correlation confidence interval (using the Fisher z-transformation)
The confidence interval is an estimate the range of the value of the correlation coefficient, using the correlation itself as an input. The values are meant to be the low and high end of the correlation coefficient with 95% confidence.
This one is a bit more complciated than the other calculations, but I include it because many people have been pushing for confidence intervals instead of p-value calculations (for example: NEJM. However, if you are dredging data, you can reliably find yourself in the 5%. That's my goal!
All values for the years included above: If I were being very sneaky, I could trim years from the beginning or end of the datasets to increase the correlation on some pairs of variables. I don't do that because there are already plenty of correlations in my database without monkeying with the years.
Still, sometimes one of the variables has more years of data available than the other. This page only shows the overlapping years. To see all the years, click on "See what else correlates with..." link above.
| 2004 | 2005 | 2006 | 2007 | 2008 | 2009 | 2010 | 2011 | 2012 | 2013 | 2014 | 2015 | 2016 | 2017 | 2018 | 2019 | 2020 | 2021 | 2022 | |
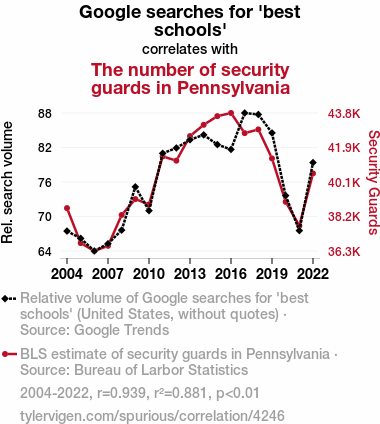
| Google searches for 'best schools' (Rel. search volume) | 67.3333 | 66.0833 | 63.9167 | 65.1667 | 67.5 | 74.9167 | 70.8333 | 80.6667 | 81.5833 | 83 | 83.8333 | 82.1667 | 81.3333 | 87.5833 | 87.3333 | 84.1667 | 73.4167 | 67.4167 | 79.0833 |
| The number of security guards in Pennsylvania (Security Guards) | 38640 | 36750 | 36320 | 36600 | 38270 | 39130 | 38840 | 41440 | 41210 | 42540 | 43150 | 43620 | 43790 | 42700 | 42900 | 41330 | 38980 | 37690 | 40520 |
Why this works
- Data dredging: I have 25,153 variables in my database. I compare all these variables against each other to find ones that randomly match up. That's 632,673,409 correlation calculations! This is called “data dredging.” Instead of starting with a hypothesis and testing it, I instead abused the data to see what correlations shake out. It’s a dangerous way to go about analysis, because any sufficiently large dataset will yield strong correlations completely at random.
- Lack of causal connection: There is probably
Because these pages are automatically generated, it's possible that the two variables you are viewing are in fact causually related. I take steps to prevent the obvious ones from showing on the site (I don't let data about the weather in one city correlate with the weather in a neighboring city, for example), but sometimes they still pop up. If they are related, cool! You found a loophole.
no direct connection between these variables, despite what the AI says above. This is exacerbated by the fact that I used "Years" as the base variable. Lots of things happen in a year that are not related to each other! Most studies would use something like "one person" in stead of "one year" to be the "thing" studied. - Observations not independent: For many variables, sequential years are not independent of each other. If a population of people is continuously doing something every day, there is no reason to think they would suddenly change how they are doing that thing on January 1. A simple
Personally I don't find any p-value calculation to be 'simple,' but you know what I mean.
p-value calculation does not take this into account, so mathematically it appears less probable than it really is.
Try it yourself
You can calculate the values on this page on your own! Try running the Python code to see the calculation results. Step 1: Download and install Python on your computer.Step 2: Open a plaintext editor like Notepad and paste the code below into it.
Step 3: Save the file as "calculate_correlation.py" in a place you will remember, like your desktop. Copy the file location to your clipboard. On Windows, you can right-click the file and click "Properties," and then copy what comes after "Location:" As an example, on my computer the location is "C:\Users\tyler\Desktop"
Step 4: Open a command line window. For example, by pressing start and typing "cmd" and them pressing enter.
Step 5: Install the required modules by typing "pip install numpy", then pressing enter, then typing "pip install scipy", then pressing enter.
Step 6: Navigate to the location where you saved the Python file by using the "cd" command. For example, I would type "cd C:\Users\tyler\Desktop" and push enter.
Step 7: Run the Python script by typing "python calculate_correlation.py"
If you run into any issues, I suggest asking ChatGPT to walk you through installing Python and running the code below on your system. Try this question:
"Walk me through installing Python on my computer to run a script that uses scipy and numpy. Go step-by-step and ask me to confirm before moving on. Start by asking me questions about my operating system so that you know how to proceed. Assume I want the simplest installation with the latest version of Python and that I do not currently have any of the necessary elements installed. Remember to only give me one step per response and confirm I have done it before proceeding."
# These modules make it easier to perform the calculation
import numpy as np
from scipy import stats

# We'll define a function that we can call to return the correlation calculations
def calculate_correlation(array1, array2):

    # Calculate Pearson correlation coefficient and p-value
    correlation, p_value = stats.pearsonr(array1, array2)

    # Calculate R-squared as the square of the correlation coefficient
    r_squared = correlation**2

    return correlation, r_squared, p_value

# These are the arrays for the variables shown on this page, but you can modify them to be any two sets of numbers
array_1 = np.array([67.3333,66.0833,63.9167,65.1667,67.5,74.9167,70.8333,80.6667,81.5833,83,83.8333,82.1667,81.3333,87.5833,87.3333,84.1667,73.4167,67.4167,79.0833,])
array_2 = np.array([38640,36750,36320,36600,38270,39130,38840,41440,41210,42540,43150,43620,43790,42700,42900,41330,38980,37690,40520,])
array_1_name = "Google searches for 'best schools'"
array_2_name = "The number of security guards in Pennsylvania"

# Perform the calculation
print(f"Calculating the correlation between {array_1_name} and {array_2_name}...")
correlation, r_squared, p_value = calculate_correlation(array_1, array_2)

# Print the results
print("Correlation Coefficient:", correlation)
print("R-squared:", r_squared)
print("P-value:", p_value)
Reuseable content
You may re-use the images on this page for any purpose, even commercial purposes, without asking for permission. The only requirement is that you attribute Tyler Vigen. Attribution can take many different forms. If you leave the "tylervigen.com" link in the image, that satisfies it just fine. If you remove it and move it to a footnote, that's fine too. You can also just write "Charts courtesy of Tyler Vigen" at the bottom of an article.You do not need to attribute "the spurious correlations website," and you don't even need to link here if you don't want to. I don't gain anything from pageviews. There are no ads on this site, there is nothing for sale, and I am not for hire.
For the record, I am just one person. Tyler Vigen, he/him/his. I do have degrees, but they should not go after my name unless you want to annoy my wife. If that is your goal, then go ahead and cite me as "Tyler Vigen, A.A. A.A.S. B.A. J.D." Otherwise it is just "Tyler Vigen."
When spoken, my last name is pronounced "vegan," like I don't eat meat.
Full license details.
For more on re-use permissions, or to get a signed release form, see tylervigen.com/permission.
Download images for these variables:
- High resolution line chart
The image linked here is a Scalable Vector Graphic (SVG). It is the highest resolution that is possible to achieve. It scales up beyond the size of the observable universe without pixelating. You do not need to email me asking if I have a higher resolution image. I do not. The physical limitations of our universe prevent me from providing you with an image that is any higher resolution than this one.
If you insert it into a PowerPoint presentation (a tool well-known for managing things that are the scale of the universe), you can right-click > "Ungroup" or "Create Shape" and then edit the lines and text directly. You can also change the colors this way.
Alternatively you can use a tool like Inkscape. - High resolution line chart, optimized for mobile
- Alternative high resolution line chart
- Scatterplot
- Portable line chart (png)
- Portable line chart (png), optimized for mobile
- Line chart for only Google searches for 'best schools'
- Line chart for only The number of security guards in Pennsylvania
- AI-generated correlation image
- The spurious research paper: Googling for Schooling: Linking Best Schools Searches to Security Legion in Pennsylvania
Big thanks for reviewing!
Correlation ID: 4246 · Black Variable ID: 1432 · Red Variable ID: 13690

