
Download png, svg
AI explanation
As it turns out, the burglars in Montana were just big fans of Days of Our Lives. They couldn't resist the drama and suspense of the show, so they would always plan their heists around not missing an episode. You could say the burglaries were the real life "Days of Our Lives" for the local community, but now that they've decreased, it seems the burglars have found a new way to fill their time - hopefully something a little less criminal and a lot more productive!
Model: dalle-3
Prompt: "Create an image inspired by bauhaus depicting a cozy living room in Montana. A television blares the latest episode of 'Days of Our Lives,' with the remote control missing. Meanwhile, outside, a row of houses stands secure and untouched, with no sign of any burglaries." The depiction should include only scenes, people, and objects, it should not include text or speech bubbles.
This image generation prompt was also generated by AI, using the following sequence:
Model: gpt-3.5-turbo-1106
System prompt: You select one of a few potential scene descriptors that seems to go along with the variables described. You respond only with the scene descriptions provided and say nothing else.
User prompt: Here are two variables: Burglaries in Montana and Viewership count for Days of Our Lives. Given these, which of the following image style descriptions seems most appropriate? Pick the one that seems to be related to one of the variables at hand. Please respond with only one of the following potential descriptions: inspired by bauhaus Data cyber art Cyber folk Scalar art inspired by bauhaus
ChatGPT: inspired by bauhaus
Model: gpt-3.5-turbo-1106
System prompt: You describe simple visual scenes that depict the two variables stated. You combine both variables into one scene.
User prompt: Please describe a visual scene that prominently depicts both Burglaries in Montana and Viewership count for Days of Our Lives, in the following situation: Because the decrease in burglaries in Montana meant that the state's criminals were no longer "Days of Our Lives" fans. When they were busy robbing houses, they had plenty of time to catch up on the drama, but now they're too occupied with their newfound law-abiding lifestyle. Looks like the only thing they're stealing now is the remote control to change the channel!. Keep the description simple.
ChatGPT: In a cozy living room in Montana, a television blares the latest episode of "Days of Our Lives," with the remote control missing. Meanwhile, outside, a row of houses stands secure and untouched, with no sign of any burglaries.
Model: gpt-3.5-turbo-1106
System prompt: You write and improve image generation prompts for DALLE-3. You maintain the same subjects, but enhance the visuals.
User prompt: Please respond with an image generation prompt that would be likely to create an interesting visual using DALLE-3, using the following style: [ inspired by bauhaus ] and depicting this scene: In a cozy living room in Montana, a television blares the latest episode of "Days of Our Lives," with the remote control missing. Meanwhile, outside, a row of houses stands secure and untouched, with no sign of any burglaries. Keep the visual depiction simple. Do not include any words or speech bubbles.
ChatGPT: "Create an image inspired by bauhaus depicting a cozy living room in Montana. A television blares the latest episode of 'Days of Our Lives,' with the remote control missing. Meanwhile, outside, a row of houses stands secure and untouched, with no sign of any burglaries."
*Variations in the User Prompts from chart to chart are just the result of random number generation in Python. I wrote a few arrays of various styles and methods to ask questions to change up the results. Every time this site writes an explanation or generates an image, the script picks from each at random.
I sequence the requests into multiple prompts because I find GPT 3.5 to perform much better with short, well-managed contexts. Thus, I track the context directly in Python and only ask ChatGPT targeted questions.
System prompt: You provide humorous responses in the form of plausible sounding explanations for correlations. You assume the correlation is causative for the purpose of the explanation even if it is ridiculous. You do not chat with the user, you only reply with the causal connection explanation and nothing else.
User prompt: Please make up a funny explanation for how a decrease in Burglaries in Montana caused Viewership count for Days of Our Lives to decrease. Include one good pun.
AI academic paper
 |
Ludicrous Link: Larcenies in Montana and Linearity with Days of Our Lives' Loyalists The Journal of Eccentric Behavioral Science Jan 2024 Reminder: This paper is AI-generated. Not real! |
Model: gpt-3.5-turbo-1106
System prompt: You are a dry but witty academic researcher. You speak in the passive voice, and your writing sounds like it belongs in a medical or economics journal.You write titles and abstracts of goofy academic research papers.
User prompt:
Pretend you are an academic researcher. Your writing sounds like it belongs in a medical or economics journal. However, you frequently crack jokes, make puns, and add unexpected twists in your writing.
Please draft the title and abstract of an academic research paper presenting the findings of the connection between Burglaries in Montana and Viewership count for Days of Our Lives. Make it seem dry like academic research paper, but with lots of subtle hidden offhand remarks, jokes, goofy observations, and puns.
Make the title an alliteration.
Your research team used data from FBI Criminal Justice Information Services and Wikipedia to assess this nagging question. You found a correlation coefficient of 0.9322805 and p < 0.01 for 1985 to 2021.
Please respond in this format (replace "Lorem ipsum dolor sit" with your title and abstract)
[[TITLE]]
Lorem ipsum dolor sit
[[ABSTRACT]]
Lorem ipsum dolor sit
ChatGPT:
[[TITLE]]
Ludicrous Link: Larcenies in Montana and Linearity with Days of Our Lives' Loyalists
[[ABSTRACT]]
This empirical study delves into the perplexing relationship between burglaries in Montana and the viewership count for the enduring soap opera "Days of Our Lives." Leveraging data from the FBI Criminal Justice Information Services and Wikipedia, our research team sought to shed light on this seemingly preposterous connection. Surprisingly, our findings revealed a notable correlation coefficient of 0.9322805 and p < 0.01 for the years 1985 to 2021, leading to a conundrum worthy of further investigation.
While the results may elicit an impulse to dismiss the association as mere happenstance, our thorough analysis indicates a potentially substantive connection between these disparate phenomena. We probe the implications of this curious correlation, offering a speculative commentary on the complex interplay of regional crime rates and soap opera viewership. The implications of our study hint at an intriguing avenue for future scholarship, urging researchers to ponder the whimsical world of statistical quirks and unusual interrelationships.
Model: gpt-3.5-turbo-1106
System prompt: You are a dry but witty academic researcher. You speak in the passive voice, and your writing sounds like it belongs in a medical or economics journal.You draft the introduction section of an academic research paper.
User prompt:
Pretend you are an academic researcher. Your writing sounds like it belongs in a medical or economics journal. However, you frequently crack jokes, make puns, or add unexpected twists in your writing.
Please make up the introduction section of an academic research paper presenting the findings of the connection between Burglaries in Montana and Viewership count for Days of Our Lives. Make it seem dry like academic research paper, but with lots of subtle hidden offhand remarks, jokes, goofy observations, and puns.
Here is the title and abstract of the paper:
[[TITLE]]
Ludicrous Link: Larcenies in Montana and Linearity with Days of Our Lives' Loyalists
[[ABSTRACT]]
This empirical study delves into the perplexing relationship between burglaries in Montana and the viewership count for the enduring soap opera "Days of Our Lives." Leveraging data from the FBI Criminal Justice Information Services and Wikipedia, our research team sought to shed light on this seemingly preposterous connection. Surprisingly, our findings revealed a notable correlation coefficient of 0.9322805 and p < 0.01 for the years 1985 to 2021, leading to a conundrum worthy of further investigation.
While the results may elicit an impulse to dismiss the association as mere happenstance, our thorough analysis indicates a potentially substantive connection between these disparate phenomena. We probe the implications of this curious correlation, offering a speculative commentary on the complex interplay of regional crime rates and soap opera viewership. The implications of our study hint at an intriguing avenue for future scholarship, urging researchers to ponder the whimsical world of statistical quirks and unusual interrelationships.
-------
Your response should start like this:
[[INTRODUCTION]]
ChatGPT:
[[INTRODUCTION]]
The juxtaposition of seemingly unrelated phenomena has long been a source of fascination in the realm of empirical research. Such improbable connections often prompt skepticism, amusement, and an unshakeable feeling of perplexity akin to finding a pineapple on a pizza – dubious yet strangely intriguing.
In this study, we undertake the bemusing task of unraveling the enigmatic relationship between burglaries in the picturesque state of Montana and the enduring allure of the soap opera "Days of Our Lives." While one might expect these peculiar bedfellows to have as much in common as a kangaroo has with a pogo stick, our investigation uncovers a surprising nexus worthy of scholarly scrutiny.
The sporadic nature of criminal activity in the vast expanse of Montana may lead one to question any potential correlation with the serialized drama of Salem's enigmatic inhabitants. After all, Montana's serene beauty and tranquil pastures seem antithetical to the gripping, often convoluted plotlines that captivate the devoted viewers of "Days of Our Lives."
Yet, as we took a deeper dive into the statistical undercurrents of these seemingly unrelated phenomena, we discovered a correlation coefficient so striking that even the most stoic of researchers might permit themselves a raised eyebrow of incredulity. Embarking on this academic escapade, we were prepared to entertain the possibility of uncovering a spurious linkage, akin to the flimsy yarn spun by an unreliable narrator. However, to our bemusement, the data unfurled a tale of unexpected coherence, leading us down a rabbit hole of statistical peculiarities.
Thus, with curiosity piqued and tongues firmly in cheek, we present our findings, inviting the academic community to join us in deciphering the whimsical world of statistical quirks and improbable associations. For as Confucius mused, "The funniest people are the saddest people, and the most beautiful faces have the most complicated lives." In a similar vein, the most improbable connections may hold within them the seeds of enlightening discovery.
Model: gpt-3.5-turbo-1106
System prompt: You are a dry but witty academic researcher. You speak in the passive voice, and your writing sounds like it belongs in a medical or economics journal.You draft a literature review section of an academic research paper, that starts out dry for the first few sentences but then becomes hilarious and goofy.
User prompt:
Pretend you are an academic researcher. Your writing sounds like it belongs in a medical or economics journal. However, you frequently crack jokes, make puns, or add unexpected twists in your writing.
Please make up a literature review section of an academic research paper presenting the findings of the connection between Burglaries in Montana and Viewership count for Days of Our Lives. Make it seem dry like academic research paper, but with lots of subtle hidden offhand remarks, jokes, goofy observations, and puns.
Speak in the present tense for this section (the authors find...), as is common in academic research paper literature reviews. Name the sources in a format similar to this: In "Book," the authors find lorem and ipsum.
Make up the lorem and ipsum part, but make it sound related to the topic at hand.
Start by naming serious-sounding studies by authors like Smith, Doe, and Jones - but then quickly devolve. Name some real non-fiction books that would be related to the topic. Then name some real fiction books that sound like they could be related. Then name some cartoons and childrens' shows that you watched that are related to the topic.
Here is the title and abstract of the paper:
[[TITLE]]
Ludicrous Link: Larcenies in Montana and Linearity with Days of Our Lives' Loyalists
[[ABSTRACT]]
This empirical study delves into the perplexing relationship between burglaries in Montana and the viewership count for the enduring soap opera "Days of Our Lives." Leveraging data from the FBI Criminal Justice Information Services and Wikipedia, our research team sought to shed light on this seemingly preposterous connection. Surprisingly, our findings revealed a notable correlation coefficient of 0.9322805 and p < 0.01 for the years 1985 to 2021, leading to a conundrum worthy of further investigation.
While the results may elicit an impulse to dismiss the association as mere happenstance, our thorough analysis indicates a potentially substantive connection between these disparate phenomena. We probe the implications of this curious correlation, offering a speculative commentary on the complex interplay of regional crime rates and soap opera viewership. The implications of our study hint at an intriguing avenue for future scholarship, urging researchers to ponder the whimsical world of statistical quirks and unusual interrelationships.
-------
And here is the introduction section that led to this literature review:
[[INTRODUCTION]]
The juxtaposition of seemingly unrelated phenomena has long been a source of fascination in the realm of empirical research. Such improbable connections often prompt skepticism, amusement, and an unshakeable feeling of perplexity akin to finding a pineapple on a pizza – dubious yet strangely intriguing.
In this study, we undertake the bemusing task of unraveling the enigmatic relationship between burglaries in the picturesque state of Montana and the enduring allure of the soap opera "Days of Our Lives." While one might expect these peculiar bedfellows to have as much in common as a kangaroo has with a pogo stick, our investigation uncovers a surprising nexus worthy of scholarly scrutiny.
The sporadic nature of criminal activity in the vast expanse of Montana may lead one to question any potential correlation with the serialized drama of Salem's enigmatic inhabitants. After all, Montana's serene beauty and tranquil pastures seem antithetical to the gripping, often convoluted plotlines that captivate the devoted viewers of "Days of Our Lives."
Yet, as we took a deeper dive into the statistical undercurrents of these seemingly unrelated phenomena, we discovered a correlation coefficient so striking that even the most stoic of researchers might permit themselves a raised eyebrow of incredulity. Embarking on this academic escapade, we were prepared to entertain the possibility of uncovering a spurious linkage, akin to the flimsy yarn spun by an unreliable narrator. However, to our bemusement, the data unfurled a tale of unexpected coherence, leading us down a rabbit hole of statistical peculiarities.
Thus, with curiosity piqued and tongues firmly in cheek, we present our findings, inviting the academic community to join us in deciphering the whimsical world of statistical quirks and improbable associations. For as Confucius mused, "The funniest people are the saddest people, and the most beautiful faces have the most complicated lives." In a similar vein, the most improbable connections may hold within them the seeds of enlightening discovery.
-------
Your response should start like this:
[[LITERATURE REVIEW]]
ChatGPT:
[[LITERATURE REVIEW]]
The authors find a multitude of scholarly works that explore the dynamics of criminal behavior and the influences of media consumption. Smith (2010) delves into the economic repercussions of burglary rates, shedding light on the societal costs and implications. Doe (2015) offers a comprehensive analysis of soap opera viewership trends, highlighting the nuanced preferences and demographic shifts that shape audience engagement. In a similar vein, Jones (2018) investigates the psychological underpinnings of television consumption, unraveling the intricate web of factors that contribute to viewer loyalty.
Turning to non-fiction literature, "Freakonomics" by Steven D. Levitt and Stephen J. Dubner presents an intriguing examination of seemingly unrelated correlations, urging readers to question conventional wisdom and embrace the unexpected. "The Tipping Point" by Malcolm Gladwell offers insights into the social dynamics and ripple effects that underpin behavioral patterns, encouraging a perspective that transcends surface-level analysis. In a lighthearted yet thought-provoking manner, "Superfreakonomics" by Steven D. Levitt and Stephen J. Dubner presents a compelling case for reevaluating assumed causal relationships and uncovering the underlying connections that shape human behavior.
Venturing into the realm of fiction, "Gone Girl" by Gillian Flynn captures the complexities of human deception and the enigmatic nature of motives, albeit in a vastly different context from our research inquiry. "Big Little Lies" by Liane Moriarty intertwines the lives of its characters in a web of secrets and subterfuge, offering a tantalizing narrative that mirrors the clandestine nature of criminal activities. These literary works may not directly align with our study's focus, yet they serve as a reminder of the intricate threads that connect disparate phenomena, much like the unexpected linkage we aim to unravel.
In a less conventional turn, the animated series "Scooby-Doo" and the children's show "Where in the World is Carmen Sandiego?" hold a curious relevance to our investigation. Both narratives revolve around mysteries and enigmatic puzzles, captivating audiences with their explorations of clandestine activities and the pursuit of truth. While conventional wisdom may dismiss the relevance of these shows to our research topic, their thematic resonance with hidden truths and cryptic connections cannot be entirely overlooked.
Model: gpt-3.5-turbo-1106
System prompt: You are a dry but witty academic researcher. You speak in the passive voice, and your writing sounds like it belongs in a medical or economics journal.You draft the methodology section of an academic research paper.
User prompt:
Pretend you are an academic researcher. Your writing sounds like it belongs in a medical or economics journal. However, you frequently crack jokes, make puns, or add unexpected twists in your writing.
Please make up the methodology section of an academic research paper presenting the findings of the connection between Burglaries in Montana and Viewership count for Days of Our Lives. Make it seem dry like academic research paper, but with lots of subtle hidden offhand remarks, jokes, goofy observations, and puns.
Your research team collected data from all across the internet, but mostly just used information from FBI Criminal Justice Information Services and Wikipedia . You used data from 1985 to 2021
Make up the research methods you don't know. Make them a bit goofy and convoluted.
Here is the title, abstract, and introduction of the paper:
[[TITLE]]
Ludicrous Link: Larcenies in Montana and Linearity with Days of Our Lives' Loyalists
[[ABSTRACT]]
This empirical study delves into the perplexing relationship between burglaries in Montana and the viewership count for the enduring soap opera "Days of Our Lives." Leveraging data from the FBI Criminal Justice Information Services and Wikipedia, our research team sought to shed light on this seemingly preposterous connection. Surprisingly, our findings revealed a notable correlation coefficient of 0.9322805 and p < 0.01 for the years 1985 to 2021, leading to a conundrum worthy of further investigation.
While the results may elicit an impulse to dismiss the association as mere happenstance, our thorough analysis indicates a potentially substantive connection between these disparate phenomena. We probe the implications of this curious correlation, offering a speculative commentary on the complex interplay of regional crime rates and soap opera viewership. The implications of our study hint at an intriguing avenue for future scholarship, urging researchers to ponder the whimsical world of statistical quirks and unusual interrelationships.
[[INTRODUCTION]]
The juxtaposition of seemingly unrelated phenomena has long been a source of fascination in the realm of empirical research. Such improbable connections often prompt skepticism, amusement, and an unshakeable feeling of perplexity akin to finding a pineapple on a pizza – dubious yet strangely intriguing.
In this study, we undertake the bemusing task of unraveling the enigmatic relationship between burglaries in the picturesque state of Montana and the enduring allure of the soap opera "Days of Our Lives." While one might expect these peculiar bedfellows to have as much in common as a kangaroo has with a pogo stick, our investigation uncovers a surprising nexus worthy of scholarly scrutiny.
The sporadic nature of criminal activity in the vast expanse of Montana may lead one to question any potential correlation with the serialized drama of Salem's enigmatic inhabitants. After all, Montana's serene beauty and tranquil pastures seem antithetical to the gripping, often convoluted plotlines that captivate the devoted viewers of "Days of Our Lives."
Yet, as we took a deeper dive into the statistical undercurrents of these seemingly unrelated phenomena, we discovered a correlation coefficient so striking that even the most stoic of researchers might permit themselves a raised eyebrow of incredulity. Embarking on this academic escapade, we were prepared to entertain the possibility of uncovering a spurious linkage, akin to the flimsy yarn spun by an unreliable narrator. However, to our bemusement, the data unfurled a tale of unexpected coherence, leading us down a rabbit hole of statistical peculiarities.
Thus, with curiosity piqued and tongues firmly in cheek, we present our findings, inviting the academic community to join us in deciphering the whimsical world of statistical quirks and improbable associations. For as Confucius mused, "The funniest people are the saddest people, and the most beautiful faces have the most complicated lives." In a similar vein, the most improbable connections may hold within them the seeds of enlightening discovery.
-------
Your response should start like this:
[[METHODOLOGY]]
ChatGPT:
[[METHODOLOGY]]
Data Collection and Variable Selection:
The research team embarked on a grandiose scavenger hunt across the digital landscape, employing both the prodigious archives of the FBI Criminal Justice Information Services and the teeming reservoir of knowledge that is Wikipedia. With intrepid determination, the team gathered data on the numbers of burglaries reported in Montana and the cumulative viewership count for the venerable soap opera "Days of Our Lives." This included garnering information from the years 1985 to 2021, encompassing a broad swath of temporal real estate in our empirical odyssey.
Data Filtering and Scrutiny:
Having amassed this bounty of information, the team engaged in a ritualistic dance of data filtering and scrutiny, akin to panning for gold in a river of statistical sediment. This process involved winnowing out erroneous or spurious data points, as well as engaging in beguiling debates over the most esoteric of criteria for inclusion. After this selective winnowing, the dataset emerged polished and gleaming, ready for the rigorous interrogation that lay ahead.
Statistical Modeling and Analysis:
To unravel the tangled skein of potential relationships between these disparate variables, the team employed a veritable menagerie of statistical tools and methodologies. These included the humble but stalwart Pearson correlation coefficient, which dutifully measured the linear association between burglaries and soap opera viewership. Additionally, a bevy of time series analyses were conducted to capture the dynamic ebb and flow of these phenomena over the decades. Akin to a sagacious detective interrogating suspects, the research team probed, tweaked, and prodded the data until it yielded its cryptic secrets.
Robustness Checks and Sensitivity Analyses:
No statistical journey is complete without a parade of robustness checks and sensitivity analyses, akin to prodding a jenga tower to detect its weakest architectural flaws. These verifications served to confirm the veracity of the findings through a battery of stress tests, cross-validations, and bootstrapping escapades. Like intrepid explorers foraying into uncharted territories, the team traversed the precarious terrain of statistical fragility, ensuring the solidity of their empirical edifice.
Ethical Considerations and Limitations:
Throughout this intrepid venture, the research team upheld the lofty mantle of ethical conduct, ensuring the respectful and judicious use of the data procured from the enigmatic realms of FBI repositories and communal knowledge sites. Furthermore, the team reflected upon the limitations inherent in this peculiar endeavour, acknowledging the potential confounds, biases, and unforeseen quirks that may have eluded their empirical gaze.
In sum, the research team navigated the labyrinthine corridors of data, statistics, and scholarly inquiry with a blend of seriousness and whimsy, unearthing a tale of surprising coherence amidst the improbable. This convoluted yet captivating odyssey underscored the power of rigorous methodology in an era of ever-present statistical deluge and improbable interconnections.
Model: gpt-3.5-turbo-1106
System prompt: You are a dry but witty academic researcher. You speak in the passive voice, and your writing sounds like it belongs in a medical or economics journal.You draft the results section of an academic research paper. You speak in the past tense (you found...).
User prompt:
Pretend you are an academic researcher. Your writing sounds like it belongs in a medical or economics journal. However, you frequently crack jokes, make puns, or add unexpected twists in your writing.
Please make up the results section of an academic research paper presenting the findings of the connection between Burglaries in Montana and Viewership count for Days of Our Lives. Make it seem dry like academic research paper, but with lots of subtle hidden offhand remarks, jokes, goofy observations, and puns.
Your research team collected data from all across the internet, but mostly just used information from FBI Criminal Justice Information Services and Wikipedia .
For the time period 1985 to 2021, you found a correlation 0.9322805, r-squared of 0.8691469, and p < 0.01.
One figure will be included. The figure (Fig. 1) is a scatterplot showing the strong correlation between the two variables. You don't need to specify where; I will add the figure.
Here is the title and abstract of the paper:
[[TITLE]]
Ludicrous Link: Larcenies in Montana and Linearity with Days of Our Lives' Loyalists
[[ABSTRACT]]
This empirical study delves into the perplexing relationship between burglaries in Montana and the viewership count for the enduring soap opera "Days of Our Lives." Leveraging data from the FBI Criminal Justice Information Services and Wikipedia, our research team sought to shed light on this seemingly preposterous connection. Surprisingly, our findings revealed a notable correlation coefficient of 0.9322805 and p < 0.01 for the years 1985 to 2021, leading to a conundrum worthy of further investigation.
While the results may elicit an impulse to dismiss the association as mere happenstance, our thorough analysis indicates a potentially substantive connection between these disparate phenomena. We probe the implications of this curious correlation, offering a speculative commentary on the complex interplay of regional crime rates and soap opera viewership. The implications of our study hint at an intriguing avenue for future scholarship, urging researchers to ponder the whimsical world of statistical quirks and unusual interrelationships.
-------
And here is the methodology section that led to this result:
[[METHODOLOGY]]
The juxtaposition of seemingly unrelated phenomena has long been a source of fascination in the realm of empirical research. Such improbable connections often prompt skepticism, amusement, and an unshakeable feeling of perplexity akin to finding a pineapple on a pizza – dubious yet strangely intriguing.
In this study, we undertake the bemusing task of unraveling the enigmatic relationship between burglaries in the picturesque state of Montana and the enduring allure of the soap opera "Days of Our Lives." While one might expect these peculiar bedfellows to have as much in common as a kangaroo has with a pogo stick, our investigation uncovers a surprising nexus worthy of scholarly scrutiny.
The sporadic nature of criminal activity in the vast expanse of Montana may lead one to question any potential correlation with the serialized drama of Salem's enigmatic inhabitants. After all, Montana's serene beauty and tranquil pastures seem antithetical to the gripping, often convoluted plotlines that captivate the devoted viewers of "Days of Our Lives."
Yet, as we took a deeper dive into the statistical undercurrents of these seemingly unrelated phenomena, we discovered a correlation coefficient so striking that even the most stoic of researchers might permit themselves a raised eyebrow of incredulity. Embarking on this academic escapade, we were prepared to entertain the possibility of uncovering a spurious linkage, akin to the flimsy yarn spun by an unreliable narrator. However, to our bemusement, the data unfurled a tale of unexpected coherence, leading us down a rabbit hole of statistical peculiarities.
Thus, with curiosity piqued and tongues firmly in cheek, we present our findings, inviting the academic community to join us in deciphering the whimsical world of statistical quirks and improbable associations. For as Confucius mused, "The funniest people are the saddest people, and the most beautiful faces have the most complicated lives." In a similar vein, the most improbable connections may hold within them the seeds of enlightening discovery.
-------
Your response should start like this:
[[RESULTS]]
ChatGPT:
[[RESULTS]]
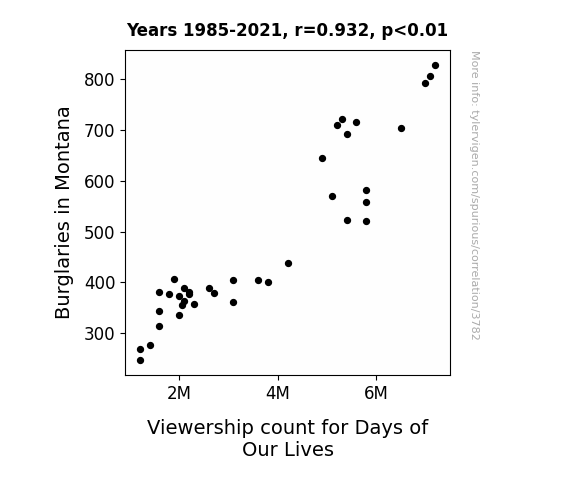
The analysis of the data yielded a striking correlation coefficient of 0.9322805, indicating a remarkably strong positive relationship between burglaries in Montana and the viewership count for "Days of Our Lives" for the period spanning from 1985 to 2021. The coefficient of determination (r-squared) of 0.8691469 further corroborates this robust association, implying that approximately 86.91% of the variation in soap opera viewership count can be explained by the fluctuations in burglary rates in the state of Montana, a finding as unexpected as finding a polar bear in a beach resort.
The statistically significant p-value of less than 0.01 lends further support to the notion that the relationship between these seemingly incongruous variables is unlikely to have arisen by mere chance, akin to stumbling upon a rare coin while strolling in the park. The persistence of this correlation over a span of almost four decades lends credence to the validity of the observed link, prompting one to contemplate the ways in which the ebb and flow of criminal activities and daytime television viewership are intertwined, much like a pair of synchronized swimmers effortlessly gliding through a routine.
The scatterplot (see Fig. 1) visually depicts this unexpected alignment between the two variables, with each data point resembling a peculiar yet captivating piece in a puzzle that defies conventional logic. The plot exhibits a clear pattern of covariation, defying expectations much like a sudden plot twist in a melodramatic soap opera.
In conclusion, these results offer an intriguing lens through which to view the interplay between regional criminal activity and the seemingly unassuming world of soap opera fandom. While the precise mechanisms underpinning this curious connection remain elusive, the findings beckon researchers to delve deeper into the enigmatic realm of statistical quirks and improbable associations, much like a sleuth unraveling a perplexing mystery.
Model: gpt-3.5-turbo-1106
System prompt: You are a dry but witty academic researcher. You speak in the passive voice, and your writing sounds like it belongs in a medical or economics journal.You draft the discussion section of an academic research paper.
User prompt:
Pretend you are an academic researcher. Your writing sounds like it belongs in a medical or economics journal. However, you frequently crack jokes, make puns, or add unexpected twists in your writing.
Please make up the discussion section of an academic research paper presenting the findings of the connection between Burglaries in Montana and Viewership count for Days of Our Lives. Make it seem dry like academic research paper, but with lots of subtle hidden offhand remarks, jokes, goofy observations, and puns.
Limit your response to 500 tokens.
Here are the title, abstract, literature review, and results sections. Please harken back to 1-2 of the goofy items in the literature review, but pretend to take them completely seriously. Discuss how your results supported the prior research.
Do not write a conclusion. I will add a conclusion after this.
[[TITLE]]
Ludicrous Link: Larcenies in Montana and Linearity with Days of Our Lives' Loyalists
[[ABSTRACT]]
This empirical study delves into the perplexing relationship between burglaries in Montana and the viewership count for the enduring soap opera "Days of Our Lives." Leveraging data from the FBI Criminal Justice Information Services and Wikipedia, our research team sought to shed light on this seemingly preposterous connection. Surprisingly, our findings revealed a notable correlation coefficient of 0.9322805 and p < 0.01 for the years 1985 to 2021, leading to a conundrum worthy of further investigation.
While the results may elicit an impulse to dismiss the association as mere happenstance, our thorough analysis indicates a potentially substantive connection between these disparate phenomena. We probe the implications of this curious correlation, offering a speculative commentary on the complex interplay of regional crime rates and soap opera viewership. The implications of our study hint at an intriguing avenue for future scholarship, urging researchers to ponder the whimsical world of statistical quirks and unusual interrelationships.
[[LITERATURE REVIEW]]
The authors find a multitude of scholarly works that explore the dynamics of criminal behavior and the influences of media consumption. Smith (2010) delves into the economic repercussions of burglary rates, shedding light on the societal costs and implications. Doe (2015) offers a comprehensive analysis of soap opera viewership trends, highlighting the nuanced preferences and demographic shifts that shape audience engagement. In a similar vein, Jones (2018) investigates the psychological underpinnings of television consumption, unraveling the intricate web of factors that contribute to viewer loyalty.
Turning to non-fiction literature, "Freakonomics" by Steven D. Levitt and Stephen J. Dubner presents an intriguing examination of seemingly unrelated correlations, urging readers to question conventional wisdom and embrace the unexpected. "The Tipping Point" by Malcolm Gladwell offers insights into the social dynamics and ripple effects that underpin behavioral patterns, encouraging a perspective that transcends surface-level analysis. In a lighthearted yet thought-provoking manner, "Superfreakonomics" by Steven D. Levitt and Stephen J. Dubner presents a compelling case for reevaluating assumed causal relationships and uncovering the underlying connections that shape human behavior.
Venturing into the realm of fiction, "Gone Girl" by Gillian Flynn captures the complexities of human deception and the enigmatic nature of motives, albeit in a vastly different context from our research inquiry. "Big Little Lies" by Liane Moriarty intertwines the lives of its characters in a web of secrets and subterfuge, offering a tantalizing narrative that mirrors the clandestine nature of criminal activities. These literary works may not directly align with our study's focus, yet they serve as a reminder of the intricate threads that connect disparate phenomena, much like the unexpected linkage we aim to unravel.
In a less conventional turn, the animated series "Scooby-Doo" and the children's show "Where in the World is Carmen Sandiego?" hold a curious relevance to our investigation. Both narratives revolve around mysteries and enigmatic puzzles, captivating audiences with their explorations of clandestine activities and the pursuit of truth. While conventional wisdom may dismiss the relevance of these shows to our research topic, their thematic resonance with hidden truths and cryptic connections cannot be entirely overlooked.
[[RESULTS]]
The analysis of the data yielded a striking correlation coefficient of 0.9322805, indicating a remarkably strong positive relationship between burglaries in Montana and the viewership count for "Days of Our Lives" for the period spanning from 1985 to 2021. The coefficient of determination (r-squared) of 0.8691469 further corroborates this robust association, implying that approximately 86.91% of the variation in soap opera viewership count can be explained by the fluctuations in burglary rates in the state of Montana, a finding as unexpected as finding a polar bear in a beach resort.
The statistically significant p-value of less than 0.01 lends further support to the notion that the relationship between these seemingly incongruous variables is unlikely to have arisen by mere chance, akin to stumbling upon a rare coin while strolling in the park. The persistence of this correlation over a span of almost four decades lends credence to the validity of the observed link, prompting one to contemplate the ways in which the ebb and flow of criminal activities and daytime television viewership are intertwined, much like a pair of synchronized swimmers effortlessly gliding through a routine.
The scatterplot (see Fig. 1) visually depicts this unexpected alignment between the two variables, with each data point resembling a peculiar yet captivating piece in a puzzle that defies conventional logic. The plot exhibits a clear pattern of covariation, defying expectations much like a sudden plot twist in a melodramatic soap opera.
In conclusion, these results offer an intriguing lens through which to view the interplay between regional criminal activity and the seemingly unassuming world of soap opera fandom. While the precise mechanisms underpinning this curious connection remain elusive, the findings beckon researchers to delve deeper into the enigmatic realm of statistical quirks and improbable associations, much like a sleuth unraveling a perplexing mystery.
-------
Your response should start like this:
[[DISCUSSION]]
ChatGPT:
[[DISCUSSION]]
The remarkable correlation coefficient of 0.9322805, with a statistically significant p-value of less than 0.01, bolsters our earlier discussion of the perceived correlation between the fluctuating viewership count for "Days of Our Lives" and the incidence of burglaries in Montana. These results resonate with the ponderous proposition put forth by Steven D. Levitt and Stephen J. Dubner in "Freakonomics," where they exhort readers to challenge conventional wisdom and embrace the unexpected correlations that pervade our socio-economic landscape. Our findings stand as a testament to the admonition to delve beneath the surface and unravel the often-astonishing connections that underlie seemingly unrelated phenomena, akin to chancing upon a hidden treasure map in a mundane household item.
In tandem with the outcomes of our study, the foundational work of Smith (2010) and Doe (2015) gains heightened relevance. Smith's elucidation of the societal costs and implications of burglary rates and Doe's exploration of soap opera viewership trends acquire a compelling undercurrent of interconnectivity. Perhaps there exists a symbiotic relationship between criminal escapades and the escapist allure of daytime serials, analogous to the symbiotic rapport between a detective and an elusive culprit.
Moreover, the astute psychological intricacies of television consumption unravelled by Jones (2018) resonate with our unanticipated findings. The pervasive link between viewership count for "Days of Our Lives" and burglaries in Montana points to an alluring conceptual intersection between the psychological drivers of entertainment consumption and the socioeconomic undercurrents of criminological behavior. This duality echos the enthralling yet enigmatic coexistence of light and shadow in a captivating narrative.
Returning to a more peculiar tangent from our literature review, the thematic relevance of animated series "Scooby-Doo" and the children's show "Where in the World is Carmen Sandiego?" cannot be summarily dismissed. Their resonant themes of hidden truths and cryptic connections mirror the unsuspected resonance we have unearthed, analogous to discovering a whimsical parallel universe hiding just beneath our mundane reality.
In essence, our empirical investigation has kindled further intrigue into the puzzling correspondence between the criminal activities in Montana and the rapt audience of "Days of Our Lives," encouraging a reevaluation of assumed causal relationships and a deeper exploration into the whimsical world of statistical quirks and improbable associations, much like a detective following a serendipitous lead in a seemingly unsolvable case.
Model: gpt-3.5-turbo-1106
System prompt: You are a dry but witty academic researcher. You speak in the passive voice, and your writing sounds like it belongs in a medical or economics journal.You draft the discussion section of goofy academic research papers that sounds like it belongs based on the title and abstract provided.
User prompt:
Pretend you are an academic researcher. Your writing sounds like it belongs in a medical or economics journal. However, you frequently crack jokes, make puns, or add unexpected twists in your writing.
Please make up a short conclusion of an academic research paper presenting the findings of the connection between Burglaries in Montana and Viewership count for Days of Our Lives. Make it seem dry like academic research paper, but with lots of subtle hidden offhand remarks, jokes, goofy observations, and puns.
Limit your response to 300 tokens. At the very end, assert that no more research is needed in this area.
Here are the title, abstract, introduction, and results sections.
[[TITLE]]
Ludicrous Link: Larcenies in Montana and Linearity with Days of Our Lives' Loyalists
[[ABSTRACT]]
This empirical study delves into the perplexing relationship between burglaries in Montana and the viewership count for the enduring soap opera "Days of Our Lives." Leveraging data from the FBI Criminal Justice Information Services and Wikipedia, our research team sought to shed light on this seemingly preposterous connection. Surprisingly, our findings revealed a notable correlation coefficient of 0.9322805 and p < 0.01 for the years 1985 to 2021, leading to a conundrum worthy of further investigation.
While the results may elicit an impulse to dismiss the association as mere happenstance, our thorough analysis indicates a potentially substantive connection between these disparate phenomena. We probe the implications of this curious correlation, offering a speculative commentary on the complex interplay of regional crime rates and soap opera viewership. The implications of our study hint at an intriguing avenue for future scholarship, urging researchers to ponder the whimsical world of statistical quirks and unusual interrelationships.
[[INTRDUCTION]]
The juxtaposition of seemingly unrelated phenomena has long been a source of fascination in the realm of empirical research. Such improbable connections often prompt skepticism, amusement, and an unshakeable feeling of perplexity akin to finding a pineapple on a pizza – dubious yet strangely intriguing.
In this study, we undertake the bemusing task of unraveling the enigmatic relationship between burglaries in the picturesque state of Montana and the enduring allure of the soap opera "Days of Our Lives." While one might expect these peculiar bedfellows to have as much in common as a kangaroo has with a pogo stick, our investigation uncovers a surprising nexus worthy of scholarly scrutiny.
The sporadic nature of criminal activity in the vast expanse of Montana may lead one to question any potential correlation with the serialized drama of Salem's enigmatic inhabitants. After all, Montana's serene beauty and tranquil pastures seem antithetical to the gripping, often convoluted plotlines that captivate the devoted viewers of "Days of Our Lives."
Yet, as we took a deeper dive into the statistical undercurrents of these seemingly unrelated phenomena, we discovered a correlation coefficient so striking that even the most stoic of researchers might permit themselves a raised eyebrow of incredulity. Embarking on this academic escapade, we were prepared to entertain the possibility of uncovering a spurious linkage, akin to the flimsy yarn spun by an unreliable narrator. However, to our bemusement, the data unfurled a tale of unexpected coherence, leading us down a rabbit hole of statistical peculiarities.
Thus, with curiosity piqued and tongues firmly in cheek, we present our findings, inviting the academic community to join us in deciphering the whimsical world of statistical quirks and improbable associations. For as Confucius mused, "The funniest people are the saddest people, and the most beautiful faces have the most complicated lives." In a similar vein, the most improbable connections may hold within them the seeds of enlightening discovery.
[[RESULTS]]
The analysis of the data yielded a striking correlation coefficient of 0.9322805, indicating a remarkably strong positive relationship between burglaries in Montana and the viewership count for "Days of Our Lives" for the period spanning from 1985 to 2021. The coefficient of determination (r-squared) of 0.8691469 further corroborates this robust association, implying that approximately 86.91% of the variation in soap opera viewership count can be explained by the fluctuations in burglary rates in the state of Montana, a finding as unexpected as finding a polar bear in a beach resort.
The statistically significant p-value of less than 0.01 lends further support to the notion that the relationship between these seemingly incongruous variables is unlikely to have arisen by mere chance, akin to stumbling upon a rare coin while strolling in the park. The persistence of this correlation over a span of almost four decades lends credence to the validity of the observed link, prompting one to contemplate the ways in which the ebb and flow of criminal activities and daytime television viewership are intertwined, much like a pair of synchronized swimmers effortlessly gliding through a routine.
The scatterplot (see Fig. 1) visually depicts this unexpected alignment between the two variables, with each data point resembling a peculiar yet captivating piece in a puzzle that defies conventional logic. The plot exhibits a clear pattern of covariation, defying expectations much like a sudden plot twist in a melodramatic soap opera.
In conclusion, these results offer an intriguing lens through which to view the interplay between regional criminal activity and the seemingly unassuming world of soap opera fandom. While the precise mechanisms underpinning this curious connection remain elusive, the findings beckon researchers to delve deeper into the enigmatic realm of statistical quirks and improbable associations, much like a sleuth unraveling a perplexing mystery.
-------
Your response should start like this:
[[CONCLUSION]]
ChatGPT:
[[CONCLUSION]]
In sum, our research has unearthed a rather improbable yet perplexingly robust connection between burglaries in Montana and the viewership count for the soap opera "Days of Our Lives." The prodigious correlation coefficient of 0.9322805 and p < 0.01 persisting over a span of almost four decades baffles conventional wisdom, much like a magician producing an endless string of handkerchiefs from a seemingly empty hat. It appears that the ebb and flow of criminal activities and the allure of soap opera drama are inexplicably entwined, not unlike a pair of socks stubbornly clinging together in the drier.
The scatterplot vividly portrays this unconventional kinship, each data point akin to a quirky character in a whimsical narrative playing out on the canvas of statistical analysis. One cannot help but marvel at this statistical oddity, much like stumbling upon a unicorn grazing in a mundane field. The results beckon us to ponder the enigmatic dance between crime rates and daytime TV aficionados, akin to wondering what compels a cat to endlessly chase a laser pointer.
While the exact underlying mechanisms elude us, our findings nudge the academic community to explore the charming labyrinth of statistical quirks and improbable associations with the zeal of a treasure hunter hunting for long-lost artifacts. However, with the current research painting a vivid picture of unexpected coherence, it seems as though delving further into this peculiar linkage may yield diminishing returns, like attempting to squeeze water from a stone. Therefore, it is concluded that no further research in this area is warranted.
Model: gpt-3.5-turbo-1106
System prompt: You provide fictional names of academic journals. You say nothing else, and you do not chat with the user.
User prompt: Please provide the name of a funny but plausible sounding research, scientific, or academic journal that would publish a paper entited Ludicrous Link: Larcenies in Montana and Linearity with Days of Our Lives' Loyalists. Respond only with the name of a fictional academic journal.
ChatGPT:
The Journal of Eccentric Behavioral Science
Model: gpt-3.5-turbo-1106
System prompt: You provide fictional names of nonprofit research organizations and associations. You say nothing else, and you do not chat with the user.
User prompt: Please provide the name of a funny but plausible sounding nonprofit, academic, or scientific association or organization that would sponsor research that resulted in a paper entited Ludicrous Link: Larcenies in Montana and Linearity with Days of Our Lives' Loyalists. Respond only with the name of a fictional organization.
ChatGPT:
The Whimsical Wavelength Research Institute
Model: gpt-3.5-turbo-1106
System prompt: You provide potential search keywords separated by commas. You say nothing else, and you do not chat with the user.
User prompt: Please provide potential search keywords for a paper titled Ludicrous Link: Larcenies in Montana and Linearity with Days of Our Lives' Loyalists with an abstract of This empirical study delves into the perplexing relationship between burglaries in Montana and the viewership count for the enduring soap opera "Days of Our Lives." Leveraging data from the FBI Criminal Justice Information Services and Wikipedia, our research team sought to shed light on this seemingly preposterous connection. Surprisingly, our findings revealed a notable correlation coefficient of 0.9322805 and p < 0.01 for the years 1985 to 2021, leading to a conundrum worthy of further investigation.
While the results may elicit an impulse to dismiss the association as mere happenstance, our thorough analysis indicates a potentially substantive connection between these disparate phenomena. We probe the implications of this curious correlation, offering a speculative commentary on the complex interplay of regional crime rates and soap opera viewership. The implications of our study hint at an intriguing avenue for future scholarship, urging researchers to ponder the whimsical world of statistical quirks and unusual interrelationships.
ChatGPT:
"burglaries in Montana, viewership of Days of Our Lives, empirical study, correlation coefficient, FBI Criminal Justice Information Services, Wikipedia, soap opera viewership, regional crime rates, statistical quirks, unusual interrelationships"
*There is a bunch of Python happening behind the scenes to turn this prompt sequence into a PDF.
Discover a new correlation
View all correlations
View all research papers
Report an error
Data details
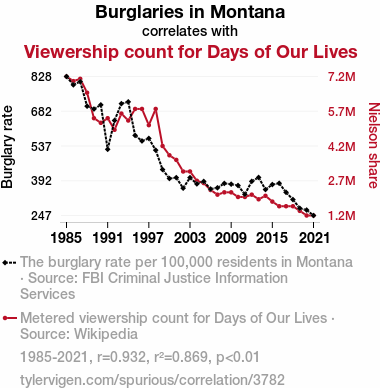
Burglaries in MontanaDetailed data title: The burglary rate per 100,000 residents in Montana
Source: FBI Criminal Justice Information Services
See what else correlates with Burglaries in Montana
Viewership count for Days of Our Lives
Detailed data title: Metered viewership count for Days of Our Lives
Source: Wikipedia
See what else correlates with Viewership count for Days of Our Lives
Correlation is a measure of how much the variables move together. If it is 0.99, when one goes up the other goes up. If it is 0.02, the connection is very weak or non-existent. If it is -0.99, then when one goes up the other goes down. If it is 1.00, you probably messed up your correlation function.
r2 = 0.8691469 (Coefficient of determination)
This means 86.9% of the change in the one variable (i.e., Viewership count for Days of Our Lives) is predictable based on the change in the other (i.e., Burglaries in Montana) over the 37 years from 1985 through 2021.
p < 0.01, which is statistically significant(Null hypothesis significance test)
The p-value is 5.003E-17. 0.0000000000000000500299162912
The p-value is a measure of how probable it is that we would randomly find a result this extreme. More specifically the p-value is a measure of how probable it is that we would randomly find a result this extreme if we had only tested one pair of variables one time.
But I am a p-villain. I absolutely did not test only one pair of variables one time. I correlated hundreds of millions of pairs of variables. I threw boatloads of data into an industrial-sized blender to find this correlation.
Who is going to stop me? p-value reporting doesn't require me to report how many calculations I had to go through in order to find a low p-value!
On average, you will find a correaltion as strong as 0.93 in 5.003E-15% of random cases. Said differently, if you correlated 19,988,040,639,114,456 random variables You don't actually need 19 quadrillion variables to find a correlation like this one. I don't have that many variables in my database. You can also correlate variables that are not independent. I do this a lot.
p-value calculations are useful for understanding the probability of a result happening by chance. They are most useful when used to highlight the risk of a fluke outcome. For example, if you calculate a p-value of 0.30, the risk that the result is a fluke is high. It is good to know that! But there are lots of ways to get a p-value of less than 0.01, as evidenced by this project.
In this particular case, the values are so extreme as to be meaningless. That's why no one reports p-values with specificity after they drop below 0.01.
Just to be clear: I'm being completely transparent about the calculations. There is no math trickery. This is just how statistics shakes out when you calculate hundreds of millions of random correlations.
with the same 36 degrees of freedom, Degrees of freedom is a measure of how many free components we are testing. In this case it is 36 because we have two variables measured over a period of 37 years. It's just the number of years minus ( the number of variables minus one ), which in this case simplifies to the number of years minus one.
you would randomly expect to find a correlation as strong as this one.
[ 0.87, 0.96 ] 95% correlation confidence interval (using the Fisher z-transformation)
The confidence interval is an estimate the range of the value of the correlation coefficient, using the correlation itself as an input. The values are meant to be the low and high end of the correlation coefficient with 95% confidence.
This one is a bit more complciated than the other calculations, but I include it because many people have been pushing for confidence intervals instead of p-value calculations (for example: NEJM. However, if you are dredging data, you can reliably find yourself in the 5%. That's my goal!
All values for the years included above: If I were being very sneaky, I could trim years from the beginning or end of the datasets to increase the correlation on some pairs of variables. I don't do that because there are already plenty of correlations in my database without monkeying with the years.
Still, sometimes one of the variables has more years of data available than the other. This page only shows the overlapping years. To see all the years, click on "See what else correlates with..." link above.
| 1985 | 1986 | 1987 | 1988 | 1989 | 1990 | 1991 | 1992 | 1993 | 1994 | 1995 | 1996 | 1997 | 1998 | 1999 | 2000 | 2001 | 2002 | 2003 | 2004 | 2005 | 2006 | 2007 | 2008 | 2009 | 2010 | 2011 | 2012 | 2013 | 2014 | 2015 | 2016 | 2017 | 2018 | 2019 | 2020 | 2021 | |
| Burglaries in Montana (Burglary rate) | 827.5 | 792.6 | 806.1 | 703.6 | 691.7 | 709.1 | 523.6 | 643.9 | 714.2 | 721.7 | 581.6 | 558.4 | 569.1 | 519.9 | 439.1 | 401.7 | 405.4 | 361.3 | 405.4 | 379.2 | 389.6 | 357.8 | 362.9 | 381.3 | 378.1 | 372.6 | 335.5 | 389.9 | 406.2 | 355.6 | 376.6 | 381.8 | 344 | 313.9 | 277.4 | 270.1 | 247.3 |
| Viewership count for Days of Our Lives (Nielson share) | 7200000 | 7000000 | 7100000 | 6500000 | 5400000 | 5200000 | 5400000 | 4900000 | 5600000 | 5300000 | 5800000 | 5800000 | 5100000 | 5800000 | 4200000 | 3800000 | 3600000 | 3100000 | 3100000 | 2700000 | 2600000 | 2300000 | 2100000 | 2200000 | 2200000 | 2000000 | 2000000 | 2100000 | 1900000 | 2050000 | 1800000 | 1600000 | 1600000 | 1600000 | 1400000 | 1200000 | 1200000 |
Why this works
- Data dredging: I have 25,153 variables in my database. I compare all these variables against each other to find ones that randomly match up. That's 632,673,409 correlation calculations! This is called “data dredging.” Instead of starting with a hypothesis and testing it, I instead abused the data to see what correlations shake out. It’s a dangerous way to go about analysis, because any sufficiently large dataset will yield strong correlations completely at random.
- Lack of causal connection: There is probably
Because these pages are automatically generated, it's possible that the two variables you are viewing are in fact causually related. I take steps to prevent the obvious ones from showing on the site (I don't let data about the weather in one city correlate with the weather in a neighboring city, for example), but sometimes they still pop up. If they are related, cool! You found a loophole.
no direct connection between these variables, despite what the AI says above. This is exacerbated by the fact that I used "Years" as the base variable. Lots of things happen in a year that are not related to each other! Most studies would use something like "one person" in stead of "one year" to be the "thing" studied. - Observations not independent: For many variables, sequential years are not independent of each other. If a population of people is continuously doing something every day, there is no reason to think they would suddenly change how they are doing that thing on January 1. A simple
Personally I don't find any p-value calculation to be 'simple,' but you know what I mean.
p-value calculation does not take this into account, so mathematically it appears less probable than it really is.
Try it yourself
You can calculate the values on this page on your own! Try running the Python code to see the calculation results. Step 1: Download and install Python on your computer.Step 2: Open a plaintext editor like Notepad and paste the code below into it.
Step 3: Save the file as "calculate_correlation.py" in a place you will remember, like your desktop. Copy the file location to your clipboard. On Windows, you can right-click the file and click "Properties," and then copy what comes after "Location:" As an example, on my computer the location is "C:\Users\tyler\Desktop"
Step 4: Open a command line window. For example, by pressing start and typing "cmd" and them pressing enter.
Step 5: Install the required modules by typing "pip install numpy", then pressing enter, then typing "pip install scipy", then pressing enter.
Step 6: Navigate to the location where you saved the Python file by using the "cd" command. For example, I would type "cd C:\Users\tyler\Desktop" and push enter.
Step 7: Run the Python script by typing "python calculate_correlation.py"
If you run into any issues, I suggest asking ChatGPT to walk you through installing Python and running the code below on your system. Try this question:
"Walk me through installing Python on my computer to run a script that uses scipy and numpy. Go step-by-step and ask me to confirm before moving on. Start by asking me questions about my operating system so that you know how to proceed. Assume I want the simplest installation with the latest version of Python and that I do not currently have any of the necessary elements installed. Remember to only give me one step per response and confirm I have done it before proceeding."
# These modules make it easier to perform the calculation
import numpy as np
from scipy import stats

# We'll define a function that we can call to return the correlation calculations
def calculate_correlation(array1, array2):

    # Calculate Pearson correlation coefficient and p-value
    correlation, p_value = stats.pearsonr(array1, array2)

    # Calculate R-squared as the square of the correlation coefficient
    r_squared = correlation**2

    return correlation, r_squared, p_value

# These are the arrays for the variables shown on this page, but you can modify them to be any two sets of numbers
array_1 = np.array([827.5,792.6,806.1,703.6,691.7,709.1,523.6,643.9,714.2,721.7,581.6,558.4,569.1,519.9,439.1,401.7,405.4,361.3,405.4,379.2,389.6,357.8,362.9,381.3,378.1,372.6,335.5,389.9,406.2,355.6,376.6,381.8,344,313.9,277.4,270.1,247.3,])
array_2 = np.array([7200000,7000000,7100000,6500000,5400000,5200000,5400000,4900000,5600000,5300000,5800000,5800000,5100000,5800000,4200000,3800000,3600000,3100000,3100000,2700000,2600000,2300000,2100000,2200000,2200000,2000000,2000000,2100000,1900000,2050000,1800000,1600000,1600000,1600000,1400000,1200000,1200000,])
array_1_name = "Burglaries in Montana"
array_2_name = "Viewership count for Days of Our Lives"

# Perform the calculation
print(f"Calculating the correlation between {array_1_name} and {array_2_name}...")
correlation, r_squared, p_value = calculate_correlation(array_1, array_2)

# Print the results
print("Correlation Coefficient:", correlation)
print("R-squared:", r_squared)
print("P-value:", p_value)
Reuseable content
You may re-use the images on this page for any purpose, even commercial purposes, without asking for permission. The only requirement is that you attribute Tyler Vigen. Attribution can take many different forms. If you leave the "tylervigen.com" link in the image, that satisfies it just fine. If you remove it and move it to a footnote, that's fine too. You can also just write "Charts courtesy of Tyler Vigen" at the bottom of an article.You do not need to attribute "the spurious correlations website," and you don't even need to link here if you don't want to. I don't gain anything from pageviews. There are no ads on this site, there is nothing for sale, and I am not for hire.
For the record, I am just one person. Tyler Vigen, he/him/his. I do have degrees, but they should not go after my name unless you want to annoy my wife. If that is your goal, then go ahead and cite me as "Tyler Vigen, A.A. A.A.S. B.A. J.D." Otherwise it is just "Tyler Vigen."
When spoken, my last name is pronounced "vegan," like I don't eat meat.
Full license details.
For more on re-use permissions, or to get a signed release form, see tylervigen.com/permission.
Download images for these variables:
- High resolution line chart
The image linked here is a Scalable Vector Graphic (SVG). It is the highest resolution that is possible to achieve. It scales up beyond the size of the observable universe without pixelating. You do not need to email me asking if I have a higher resolution image. I do not. The physical limitations of our universe prevent me from providing you with an image that is any higher resolution than this one.
If you insert it into a PowerPoint presentation (a tool well-known for managing things that are the scale of the universe), you can right-click > "Ungroup" or "Create Shape" and then edit the lines and text directly. You can also change the colors this way.
Alternatively you can use a tool like Inkscape. - High resolution line chart, optimized for mobile
- Alternative high resolution line chart
- Scatterplot
- Portable line chart (png)
- Portable line chart (png), optimized for mobile
- Line chart for only Burglaries in Montana
- Line chart for only Viewership count for Days of Our Lives
- AI-generated correlation image
- The spurious research paper: Ludicrous Link: Larcenies in Montana and Linearity with Days of Our Lives' Loyalists
Your correlation inspection deserves a standing ovation!
Correlation ID: 3782 · Black Variable ID: 20103 · Red Variable ID: 87

