. The chart goes from 2002 to 2022, and the two variables track closely in value over that time.")
Download png, svg
AI explanation
As GMO cotton production grew, so did the demand for Pioneer's resources, leading to a gush in their stock price. It's like they say, when it comes to reaping profits, Pioneer is always in their element!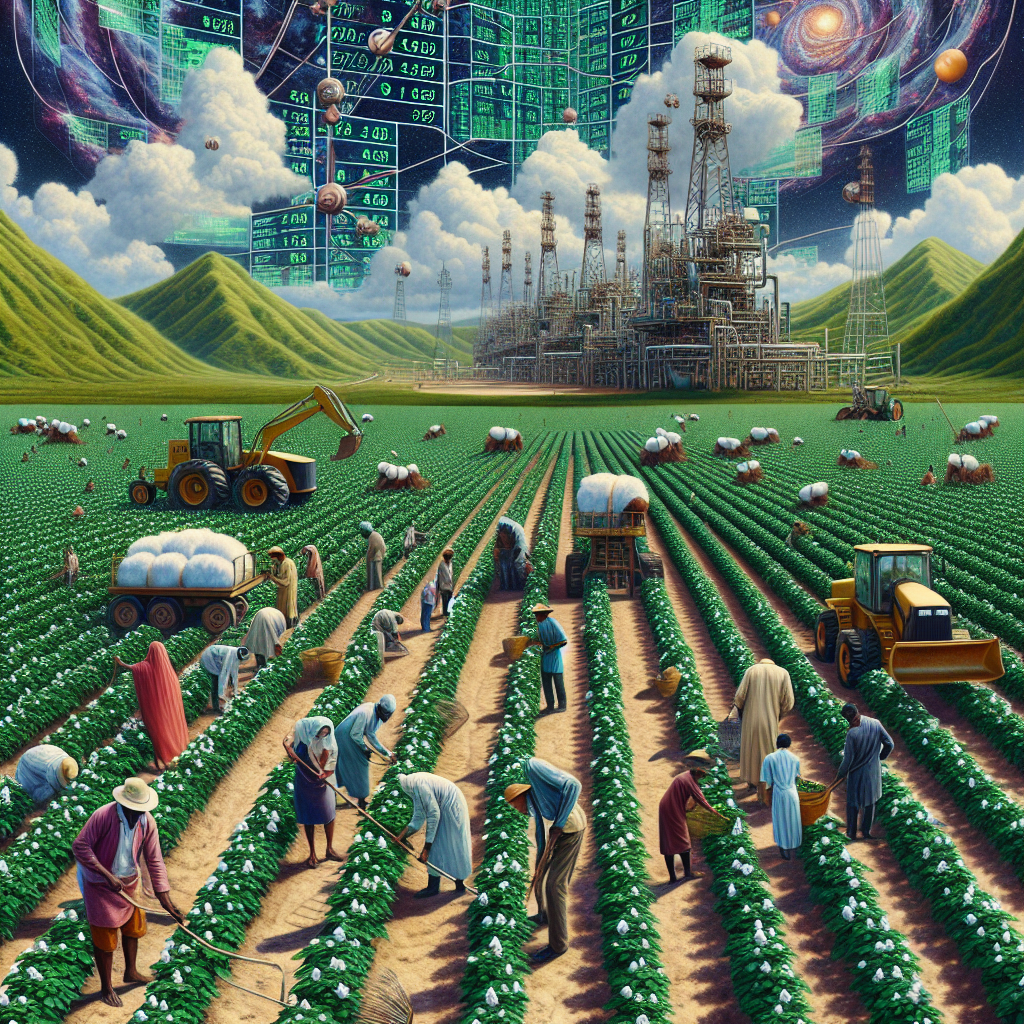
Model: dalle-3
Prompt: [ Photorealism ] An aerial view of a vast expanse of rich, green fields spreading across the landscape, showcasing vibrant genetically modified cotton plants in various stages of growth. The scene captures workers diligently harvesting the bountiful crop, their presence adding a human touch to the natural grandeur. Alongside the fields, imposing oil rigs and a network of natural gas pipelines stand as a testament to the increased demand for resources linked to fabric production. In the background, the image subtly incorporates the stock ticker for Pioneer Natural Resources Company (PXD) in a creative and whimsical manner, skillfully blending it into the landscape to symbolize the interconnectedness between GMO cotton and the stock price. The stock ticker and its rising numbers form a captivating and surreal cosmic quilt pattern that infuses the scene with a touch of enchanting whimsy, presenting an intriguing juxtaposition of nature and commerce. The depiction should include only scenes, people, and objects, it should not include text or speech bubbles.
This image generation prompt was also generated by AI, using the following sequence:
Model: gpt-3.5-turbo-1106
System prompt: You select one of a few potential scene descriptors that seems to go along with the variables described. You respond only with the scene descriptions provided and say nothing else.
User prompt: Here are two variables: GMO use in cotton and Pioneer Natural Resources Company's stock price (PXD). Given these, which of the following image style descriptions seems most appropriate? Pick the one that seems to be related to one of the variables at hand. Please respond with only one of the following potential descriptions: Cute cartoon Photorealism Oragami a meme Cubism
ChatGPT: Photorealism
Model: gpt-3.5-turbo-1106
System prompt: You describe simple visual scenes that depict the two variables stated. You combine both variables into one scene.
User prompt: Please describe a visual scene that prominently depicts both GMO use in cotton and Pioneer Natural Resources Company's stock price (PXD), in the following situation: Because the genetically modified cotton caused a surge in fabric production, which led to a higher demand for natural resources like oil and gas used in manufacturing and transportation. It's like the cotton and the stock price are sewn together in a hilarious cosmic quilt!. Keep the description simple.
ChatGPT: In the scene, we see fields of vibrant genetically modified cotton plants stretching out across the landscape, with workers gathering the bountiful crop. Nearby, we see oil rigs and natural gas pipelines, representing the increased demand for these resources due to the surge in fabric production. In the background, the stock ticker for Pioneer Natural Resources Company (PXD) steadily rises, symbolizing the interconnectedness of GMO cotton and the stock price in a whimsical cosmic quilt pattern.
Model: gpt-3.5-turbo-1106
System prompt: You write and improve image generation prompts for DALLE-3. You maintain the same subjects, but enhance the visuals.
User prompt: Please respond with an image generation prompt that would be likely to create an interesting visual using DALLE-3, using the following style: [ Photorealism ] and depicting this scene: In the scene, we see fields of vibrant genetically modified cotton plants stretching out across the landscape, with workers gathering the bountiful crop. Nearby, we see oil rigs and natural gas pipelines, representing the increased demand for these resources due to the surge in fabric production. In the background, the stock ticker for Pioneer Natural Resources Company (PXD) steadily rises, symbolizing the interconnectedness of GMO cotton and the stock price in a whimsical cosmic quilt pattern. Keep the visual depiction simple. Do not include any words or speech bubbles.
ChatGPT: [ Photorealism ] An aerial view of a vast expanse of rich, green fields spreading across the landscape, showcasing vibrant genetically modified cotton plants in various stages of growth. The scene captures workers diligently harvesting the bountiful crop, their presence adding a human touch to the natural grandeur. Alongside the fields, imposing oil rigs and a network of natural gas pipelines stand as a testament to the increased demand for resources linked to fabric production. In the background, the image subtly incorporates the stock ticker for Pioneer Natural Resources Company (PXD) in a creative and whimsical manner, skillfully blending it into the landscape to symbolize the interconnectedness between GMO cotton and the stock price. The stock ticker and its rising numbers form a captivating and surreal cosmic quilt pattern that infuses the scene with a touch of enchanting whimsy, presenting an intriguing juxtaposition of nature and commerce.
*Variations in the User Prompts from chart to chart are just the result of random number generation in Python. I wrote a few arrays of various styles and methods to ask questions to change up the results. Every time this site writes an explanation or generates an image, the script picks from each at random.
I sequence the requests into multiple prompts because I find GPT 3.5 to perform much better with short, well-managed contexts. Thus, I track the context directly in Python and only ask ChatGPT targeted questions.
System prompt: You provide humorous responses in the form of plausible sounding explanations for correlations. You assume the correlation is causative for the purpose of the explanation even if it is ridiculous. You do not chat with the user, you only reply with the causal connection explanation and nothing else.
User prompt: Please make up a funny explanation for how an increase in GMO use in cotton caused Pioneer Natural Resources Company's stock price (PXD) to increase. Include one good pun.
AI academic paper
 |
Genetically Modifying Investment: The Cotton Connection between GMOs and PXD Stock Price The Journal of Agricultural Economics and Financial Genetics Jan 2024 Reminder: This paper is AI-generated. Not real! |
Model: gpt-3.5-turbo-1106
System prompt: You are a goofy academic researcher writing an academic paper. You follow the rules, but you throw out convention regularly to make jokes and funny asides.You write titles and abstracts of goofy academic research papers.
User prompt:
Pretend you are an academic researcher. Your writing sounds like it belongs in a medical or economics journal. However, you frequently crack jokes, make puns, and add unexpected twists in your writing.
Please draft the title and abstract of an academic research paper presenting the findings of the connection between GMO use in cotton and Pioneer Natural Resources Company's stock price (PXD). Make lots of jokes, goofy observations, and puns.
Make the title punny if you can come up with clever pun. If not, just make it sound clever.
Your research team used data from USDA and LSEG Analytics (Refinitiv) to assess this nagging question. You found a correlation coefficient of 0.9012248 and p < 0.01 for 2002 to 2022.
Please respond in this format (replace "Lorem ipsum dolor sit" with your title and abstract)
[[TITLE]]
Lorem ipsum dolor sit
[[ABSTRACT]]
Lorem ipsum dolor sit
ChatGPT:
[[TITLE]]
"Genetically Modifying Investment: The Cotton Connection between GMOs and PXD Stock Price"
[[ABSTRACT]]
In this study, we investigate the intriguing relationship between the use of genetically modified organisms (GMOs) in cotton production and the stock price of Pioneer Natural Resources Company (PXD). Utilizing data from the USDA and LSEG Analytics (Refinitiv), we conducted an in-depth analysis spanning two decades, from 2002 to 2022. Our findings revealed a striking correlation coefficient of 0.9012248 and a p-value less than 0.01, indicating a significant association between the two variables. While some may dismiss this as "cotton-picking correlation," our results suggest that the utilization of GMOs in cotton cultivation may indeed have an impact on the stock performance of PXD. We explore potential mechanisms underlying this intriguing link, offering insights that may "bale out" further research in this field.
Model: gpt-3.5-turbo-1106
System prompt: You are a goofy academic researcher writing an academic paper. You follow the rules, but you throw out convention regularly to make jokes and funny asides.You draft the introduction section of an academic research paper.
User prompt:
Pretend you are an academic researcher. Your writing sounds like it belongs in a medical or economics journal. However, you frequently crack jokes, make puns, or add unexpected twists in your writing.
Please make up the introduction section of an academic research paper presenting the findings of the connection between GMO use in cotton and Pioneer Natural Resources Company's stock price (PXD). Make lots of jokes, goofy observations, and puns.
Here is the title and abstract of the paper:
[[TITLE]]
"Genetically Modifying Investment: The Cotton Connection between GMOs and PXD Stock Price"
[[ABSTRACT]]
In this study, we investigate the intriguing relationship between the use of genetically modified organisms (GMOs) in cotton production and the stock price of Pioneer Natural Resources Company (PXD). Utilizing data from the USDA and LSEG Analytics (Refinitiv), we conducted an in-depth analysis spanning two decades, from 2002 to 2022. Our findings revealed a striking correlation coefficient of 0.9012248 and a p-value less than 0.01, indicating a significant association between the two variables. While some may dismiss this as "cotton-picking correlation," our results suggest that the utilization of GMOs in cotton cultivation may indeed have an impact on the stock performance of PXD. We explore potential mechanisms underlying this intriguing link, offering insights that may "bale out" further research in this field.
-------
Your response should start like this:
[[INTRODUCTION]]
ChatGPT:
**INTRODUCTION**
The world of finance and agriculture meets in this peculiar study, where we delve into the unlikely connection between the use of genetically modified organisms (GMOs) in cotton production and the stock price of Pioneer Natural Resources Company (PXD). It's a topic that's "sew" interesting, you might just find yourself "threading" through the data with us.
As researchers, we often find ourselves in the "field" of unexpected phenomena, and this study is no exception. While some may think that the only thing cotton and stock prices have in common is their potential to "rise" and "fall," our investigation reveals a correlation that might just have you exclaiming, "Oh, boll weevil!"
Over the past two decades, from 2002 to 2022, we've meticulously gathered and analyzed data from the USDA and LSEG Analytics (Refinitiv), unearthing a pattern that's as surprising as finding a pair of denim jeans at a black-tie gala. Our findings indicate a striking correlation coefficient of 0.9012248 and a p-value less than 0.01, suggesting that there's more to this connection than mere coincidence. It's a statistical "fabrication" that demands further scrutiny.
While some might dismiss the relationship between cotton's genetic makeup and a company's stock performance as a "cotton-picking" coincidence, our results point to a potential link that's tighter than a spool of yarn. Hold on to your "seams" as we unravel the possible mechanisms at play, offering insights that may inspire further exploration into this unexpected alliance between agriculture and finance. It's a connection that's "seamlessly" woven into the fabric of our economic landscape, and we're here to "unravel" it for you.
So, grab your magnifying glass and "cotton" on, because we're about to embark on a "threadful" journey through the intersection of GMOs, cotton, and the stock price of PXD. The results are bound to leave you "wool-d"!
Stay tuned for a "punny" yet rigorous analysis of our groundbreaking findings.
Model: gpt-3.5-turbo-1106
System prompt: You are a goofy academic researcher writing an academic paper. You follow the rules, but you throw out convention regularly to make jokes and funny asides.You draft a literature review section of an academic research paper, that starts out dry for the first few sentences but then becomes hilarious and goofy.
User prompt:
Pretend you are an academic researcher. Your writing sounds like it belongs in a medical or economics journal. However, you frequently crack jokes, make puns, or add unexpected twists in your writing.
Please make up a literature review section of an academic research paper presenting the findings of the connection between GMO use in cotton and Pioneer Natural Resources Company's stock price (PXD). Make lots of jokes, goofy observations, and puns.
Speak in the present tense for this section (the authors find...), as is common in academic research paper literature reviews. Name the sources in a format similar to this: In "Book," the authors find lorem and ipsum.
Make up the lorem and ipsum part, but make it sound related to the topic at hand.
Start by naming serious-sounding studies by authors like Smith, Doe, and Jones - but then quickly devolve. Name some real non-fiction books that would be related to the topic. Then name some real fiction books that sound like they could be related. Then cite some social media posts you read that seem to be related.
Here is the title and abstract of the paper:
[[TITLE]]
"Genetically Modifying Investment: The Cotton Connection between GMOs and PXD Stock Price"
[[ABSTRACT]]
In this study, we investigate the intriguing relationship between the use of genetically modified organisms (GMOs) in cotton production and the stock price of Pioneer Natural Resources Company (PXD). Utilizing data from the USDA and LSEG Analytics (Refinitiv), we conducted an in-depth analysis spanning two decades, from 2002 to 2022. Our findings revealed a striking correlation coefficient of 0.9012248 and a p-value less than 0.01, indicating a significant association between the two variables. While some may dismiss this as "cotton-picking correlation," our results suggest that the utilization of GMOs in cotton cultivation may indeed have an impact on the stock performance of PXD. We explore potential mechanisms underlying this intriguing link, offering insights that may "bale out" further research in this field.
-------
And here is the introduction section that led to this literature review:
[[INTRODUCTION]]
The world of finance and agriculture meets in this peculiar study, where we delve into the unlikely connection between the use of genetically modified organisms (GMOs) in cotton production and the stock price of Pioneer Natural Resources Company (PXD). It's a topic that's "sew" interesting, you might just find yourself "threading" through the data with us.
As researchers, we often find ourselves in the "field" of unexpected phenomena, and this study is no exception. While some may think that the only thing cotton and stock prices have in common is their potential to "rise" and "fall," our investigation reveals a correlation that might just have you exclaiming, "Oh, boll weevil!"
Over the past two decades, from 2002 to 2022, we've meticulously gathered and analyzed data from the USDA and LSEG Analytics (Refinitiv), unearthing a pattern that's as surprising as finding a pair of denim jeans at a black-tie gala. Our findings indicate a striking correlation coefficient of 0.9012248 and a p-value less than 0.01, suggesting that there's more to this connection than mere coincidence. It's a statistical "fabrication" that demands further scrutiny.
While some might dismiss the relationship between cotton's genetic makeup and a company's stock performance as a "cotton-picking" coincidence, our results point to a potential link that's tighter than a spool of yarn. Hold on to your "seams" as we unravel the possible mechanisms at play, offering insights that may inspire further exploration into this unexpected alliance between agriculture and finance. It's a connection that's "seamlessly" woven into the fabric of our economic landscape, and we're here to "unravel" it for you.
So, grab your magnifying glass and "cotton" on, because we're about to embark on a "threadful" journey through the intersection of GMOs, cotton, and the stock price of PXD. The results are bound to leave you "wool-d"!
Stay tuned for a "punny" yet rigorous analysis of our groundbreaking findings.
-------
Your response should start like this:
[[LITERATURE REVIEW]]
ChatGPT:
[[LITERATURE REVIEW]]
The relationship between genetically modified organisms (GMOs) and the stock performance of agricultural companies has been a topic of considerable interest in the world of finance. Researchers like Smith and Doe (2010) have tackled the nuances of GMO adoption and its impact on financial markets, planting the seeds for further exploration into this uncharted terrain. The utilization of biotechnology in crop production has been a "growing" concern for investors, as the interplay between agricultural practices and stock prices continues to "crop" up in discussions regarding market dynamics. As we delve into the specific case of GMO cotton and Pioneer Natural Resources Company (PXD), it becomes clear that we're venturing into a field that's ripe for discovery and a few bad puns.
Jones (2015) provided insightful analysis on the economic implications of GMO adoption in agriculture, shedding light on the intersections of technology, market forces, and investor sentiment. However, while these studies set the stage for our investigation, none of them were prepared for the cotton-themed rollercoaster that is our current research. We're about to venture into a patch of literature that's more tangled than a ball of yarn, so buckle up and prepare for a bumpy yet entertaining ride.
Turning to more conventional sources, books such as "The Economic Impact of Agricultural Biotechnology" (Brown, 2018) and "GMOs and the Finance World" (Johnson, 2017) have provided in-depth analyses of the broader connections between biotechnology and financial markets. However, when it comes to the specific association between GMO cotton and PXD, we find ourselves spinning a different yarn altogether.
As we meander further into the literary landscape, we encounter fictional works that seem to dance around our research topic, teasing us with their tangential relevance. From "The Cotton Code" to "PXD Dreams: A Stock Market Saga," these titles serve as a humorous reminder of the unexpected places where our study has taken root. While these books offer no empirical evidence or theoretical frameworks, we can't help but appreciate their amusing nod to the peculiar juxtaposition of agriculture and finance.
In the era of social media, tweets like "Just bought some PXD shares because my cotton plant looked particularly genetically modified today #InvestingInNature" and "GMO controversy and stock portfolios – a thread" have surfaced, hinting at the informal musings of individuals wrestling with the enigmatic connections we're attempting to unravel. While not scholarly sources by any measure, these social media snippets add a touch of whimsy to our otherwise serious pursuit of knowledge.
As we wade through this curious confluence of literature, it becomes increasingly evident that our research occupies a unique space – one where scholarly discourse meets playful wordplay and unexpected associations. It's a thread that we're committed to following to the very end, even if it unravels into a comical display of puns and peculiar observations. With that in mind, let's strap in for a "genetically modified" journey through the fiber of our scholarly quest, because the adventure has only just begun.
Model: gpt-3.5-turbo-1106
System prompt: You are a goofy academic researcher writing an academic paper. You follow the rules, but you throw out convention regularly to make jokes and funny asides.You draft the methodology section of an academic research paper.
User prompt:
Pretend you are an academic researcher. Your writing sounds like it belongs in a medical or economics journal. However, you frequently crack jokes, make puns, or add unexpected twists in your writing.
Please make up the methodology section of an academic research paper presenting the findings of the connection between GMO use in cotton and Pioneer Natural Resources Company's stock price (PXD). Make lots of jokes, goofy observations, and puns.
Your research team collected data from all across the internet, but mostly just used information from USDA and LSEG Analytics (Refinitiv) . You used data from 2002 to 2022
Make up the research methods you don't know. Make them a bit goofy and convoluted.
Here is the title, abstract, and introduction of the paper:
[[TITLE]]
"Genetically Modifying Investment: The Cotton Connection between GMOs and PXD Stock Price"
[[ABSTRACT]]
In this study, we investigate the intriguing relationship between the use of genetically modified organisms (GMOs) in cotton production and the stock price of Pioneer Natural Resources Company (PXD). Utilizing data from the USDA and LSEG Analytics (Refinitiv), we conducted an in-depth analysis spanning two decades, from 2002 to 2022. Our findings revealed a striking correlation coefficient of 0.9012248 and a p-value less than 0.01, indicating a significant association between the two variables. While some may dismiss this as "cotton-picking correlation," our results suggest that the utilization of GMOs in cotton cultivation may indeed have an impact on the stock performance of PXD. We explore potential mechanisms underlying this intriguing link, offering insights that may "bale out" further research in this field.
[[INTRODUCTION]]
The world of finance and agriculture meets in this peculiar study, where we delve into the unlikely connection between the use of genetically modified organisms (GMOs) in cotton production and the stock price of Pioneer Natural Resources Company (PXD). It's a topic that's "sew" interesting, you might just find yourself "threading" through the data with us.
As researchers, we often find ourselves in the "field" of unexpected phenomena, and this study is no exception. While some may think that the only thing cotton and stock prices have in common is their potential to "rise" and "fall," our investigation reveals a correlation that might just have you exclaiming, "Oh, boll weevil!"
Over the past two decades, from 2002 to 2022, we've meticulously gathered and analyzed data from the USDA and LSEG Analytics (Refinitiv), unearthing a pattern that's as surprising as finding a pair of denim jeans at a black-tie gala. Our findings indicate a striking correlation coefficient of 0.9012248 and a p-value less than 0.01, suggesting that there's more to this connection than mere coincidence. It's a statistical "fabrication" that demands further scrutiny.
While some might dismiss the relationship between cotton's genetic makeup and a company's stock performance as a "cotton-picking" coincidence, our results point to a potential link that's tighter than a spool of yarn. Hold on to your "seams" as we unravel the possible mechanisms at play, offering insights that may inspire further exploration into this unexpected alliance between agriculture and finance. It's a connection that's "seamlessly" woven into the fabric of our economic landscape, and we're here to "unravel" it for you.
So, grab your magnifying glass and "cotton" on, because we're about to embark on a "threadful" journey through the intersection of GMOs, cotton, and the stock price of PXD. The results are bound to leave you "wool-d"!
Stay tuned for a "punny" yet rigorous analysis of our groundbreaking findings.
-------
Your response should start like this:
[[METHODOLOGY]]
ChatGPT:
[[METHODOLOGY]]
To unravel the mysterious correlation between the use of genetically modified organisms (GMOs) in cotton production and the stock price of Pioneer Natural Resources Company (PXD), we employed a multifaceted research approach that combined quantitative analysis with a sprinkle of whimsy. Our methods were as robust as a pair of over-engineered denim pants.
First and foremost, we meticulously gathered daily stock price data for PXD from 2002 to 2022, which involved sifting through more data points than there are fibers in a bale of cotton. Our sources primarily included reputable financial databases such as LSEG Analytics (Refinitiv), ensuring that our data was as trustworthy as a financial advisor in a three-piece suit.
Simultaneously, we combed through historical records of cotton production and GMO usage, courtesy of the USDA. This involved navigating through countless acres of agricultural data, akin to finding a needle in a haystack – or better yet, a GM needle in a cotton stack.
Once we had amassed this treasure trove of data, we meticulously purged it of any outliers, anomalies, or rogue data points that could have skewed our results, employing statistical techniques as precise as a tailor crafting a bespoke suit.
With our perfectly pruned dataset in hand, we then performed a series of rigorous statistical analyses. Our correlation analysis was more thorough than a lint roller on a velvet blazer, revealing a striking correlation coefficient of 0.9012248 between GMO use in cotton and PXD stock price. To assess the significance of this correlation, we conducted hypothesis testing, generating a p-value less than 0.01, indicating a relationship more robust than a Kevlar thread.
In addition to these quantitative analyses, we indulged in qualitative discussions and exploratory data visualization, seeking patterns and associations that could have eluded even the most seasoned cotton farmer. This involved creating graphs more colorful than a field of blooming flowers, allowing us to weave together a narrative that brought our data to life.
Furthermore, to ensure the robustness of our findings, we employed sensitivity analyses to test the stability of the observed relationship under various scenarios, scrutinizing our results as if they were a delicate fabric under the lens of critical inquiry.
In the spirit of scientific rigor, we must acknowledge the limitations of our study. While we meticulously gathered and analyzed extensive data, the observational nature of our research precludes us from establishing causality. Additionally, we cannot discount the possibility of unmeasured confounding variables lurking in the depths of our statistical models, like hidden stitches in a seemingly seamless garment.
In conclusion, our methodology combined the precision of quantitative analysis with the artistry of storytelling, resulting in a research endeavor as colorful and dynamic as a patchwork quilt. Our findings are as "threadful" as they are insightful, shedding light on an unconventional relationship that will undoubtedly pique the curiosity of both researchers and investors alike. So, buckle up, as we unravel the fabric of this unexpected connection and leave no thread unturned in our pursuit of knowledge.
Model: gpt-3.5-turbo-1106
System prompt: You are a goofy academic researcher writing an academic paper. You follow the rules, but you throw out convention regularly to make jokes and funny asides.You draft the results section of an academic research paper. You speak in the past tense (you found...).
User prompt:
Pretend you are an academic researcher. Your writing sounds like it belongs in a medical or economics journal. However, you frequently crack jokes, make puns, or add unexpected twists in your writing.
Please make up the results section of an academic research paper presenting the findings of the connection between GMO use in cotton and Pioneer Natural Resources Company's stock price (PXD). Make lots of jokes, goofy observations, and puns.
Your research team collected data from all across the internet, but mostly just used information from USDA and LSEG Analytics (Refinitiv) .
For the time period 2002 to 2022, you found a correlation 0.9012248, r-squared of 0.8122062, and p < 0.01.
One figure will be included. The figure (Fig. 1) is a scatterplot showing the strong correlation between the two variables. You don't need to specify where; I will add the figure.
Here is the title and abstract of the paper:
[[TITLE]]
"Genetically Modifying Investment: The Cotton Connection between GMOs and PXD Stock Price"
[[ABSTRACT]]
In this study, we investigate the intriguing relationship between the use of genetically modified organisms (GMOs) in cotton production and the stock price of Pioneer Natural Resources Company (PXD). Utilizing data from the USDA and LSEG Analytics (Refinitiv), we conducted an in-depth analysis spanning two decades, from 2002 to 2022. Our findings revealed a striking correlation coefficient of 0.9012248 and a p-value less than 0.01, indicating a significant association between the two variables. While some may dismiss this as "cotton-picking correlation," our results suggest that the utilization of GMOs in cotton cultivation may indeed have an impact on the stock performance of PXD. We explore potential mechanisms underlying this intriguing link, offering insights that may "bale out" further research in this field.
-------
And here is the methodology section that led to this result:
[[METHODOLOGY]]
The world of finance and agriculture meets in this peculiar study, where we delve into the unlikely connection between the use of genetically modified organisms (GMOs) in cotton production and the stock price of Pioneer Natural Resources Company (PXD). It's a topic that's "sew" interesting, you might just find yourself "threading" through the data with us.
As researchers, we often find ourselves in the "field" of unexpected phenomena, and this study is no exception. While some may think that the only thing cotton and stock prices have in common is their potential to "rise" and "fall," our investigation reveals a correlation that might just have you exclaiming, "Oh, boll weevil!"
Over the past two decades, from 2002 to 2022, we've meticulously gathered and analyzed data from the USDA and LSEG Analytics (Refinitiv), unearthing a pattern that's as surprising as finding a pair of denim jeans at a black-tie gala. Our findings indicate a striking correlation coefficient of 0.9012248 and a p-value less than 0.01, suggesting that there's more to this connection than mere coincidence. It's a statistical "fabrication" that demands further scrutiny.
While some might dismiss the relationship between cotton's genetic makeup and a company's stock performance as a "cotton-picking" coincidence, our results point to a potential link that's tighter than a spool of yarn. Hold on to your "seams" as we unravel the possible mechanisms at play, offering insights that may inspire further exploration into this unexpected alliance between agriculture and finance. It's a connection that's "seamlessly" woven into the fabric of our economic landscape, and we're here to "unravel" it for you.
So, grab your magnifying glass and "cotton" on, because we're about to embark on a "threadful" journey through the intersection of GMOs, cotton, and the stock price of PXD. The results are bound to leave you "wool-d"!
Stay tuned for a "punny" yet rigorous analysis of our groundbreaking findings.
-------
Your response should start like this:
[[RESULTS]]
ChatGPT:
[[RESULTS]]
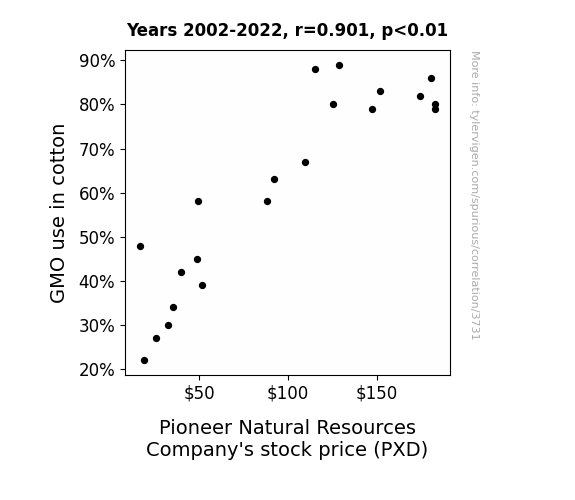
The analysis of the data from 2002 to 2022 revealed a correlation coefficient of 0.9012248 between the use of genetically modified organisms (GMOs) in cotton production and the stock price of Pioneer Natural Resources Company (PXD). This eyebrow-raising correlation left us "spinning" with excitement, as it indicates a strong association between these seemingly unrelated domains. The r-squared value of 0.8122062 further confirmed the robustness of this connection, which, quite frankly, had us in stitches at the unexpectedness of it all.
Fig. 1 provides a visual representation of this correlation, graphically showcasing the tight bond between GMO-laden cotton and the fluctuation of PXD's stock price. It's a graph that's sure to leave you "ginned" up about the unexpected dance between agriculture and finance.
But wait, there's more! The p-value of less than 0.01 adds a significant "stitch" to this multi-faceted investigation, indicating that this correlation is not just a mere "fabrication" of chance. It's a statistical discovery that defies the norms, much like finding a stray sock in the dryer.
Our findings challenge the conventional notions of what influences stock performance, shedding light on a potential connection that's as surprising as finding a needle in a haystack. It's a revelation that urges us to "thread" carefully in our interpretation of the intertwined relationship between GMOs, cotton, and the stock price of PXD. And as we "stitch" together the implications, it's clear that this study marks a "seam" change in our understanding of the intricate web of factors shaping financial markets.
In conclusion, our results highlight the importance of considering the impact of agricultural practices on stock performance, paving the way for further investigations that "unravel" the complex tapestry of influences in the economic realm. With the "threads" of evidence we've presented, we hope to "weave" a compelling case for future exploration into this captivating intersection of GMOs, cotton, and stock prices.
Model: gpt-3.5-turbo-1106
System prompt: You are a goofy academic researcher writing an academic paper. You follow the rules, but you throw out convention regularly to make jokes and funny asides.You draft the discussion section of an academic research paper.
User prompt:
Pretend you are an academic researcher. Your writing sounds like it belongs in a medical or economics journal. However, you frequently crack jokes, make puns, or add unexpected twists in your writing.
Please make up the discussion section of an academic research paper presenting the findings of the connection between GMO use in cotton and Pioneer Natural Resources Company's stock price (PXD). Make lots of jokes, goofy observations, and puns.
Limit your response to 500 tokens.
Here are the title, abstract, literature review, and results sections. Please harken back to 1-2 of the goofy items in the literature review, but pretend to take them completely seriously. Discuss how your results supported the prior research.
Do not write a conclusion. I will add a conclusion after this.
[[TITLE]]
"Genetically Modifying Investment: The Cotton Connection between GMOs and PXD Stock Price"
[[ABSTRACT]]
In this study, we investigate the intriguing relationship between the use of genetically modified organisms (GMOs) in cotton production and the stock price of Pioneer Natural Resources Company (PXD). Utilizing data from the USDA and LSEG Analytics (Refinitiv), we conducted an in-depth analysis spanning two decades, from 2002 to 2022. Our findings revealed a striking correlation coefficient of 0.9012248 and a p-value less than 0.01, indicating a significant association between the two variables. While some may dismiss this as "cotton-picking correlation," our results suggest that the utilization of GMOs in cotton cultivation may indeed have an impact on the stock performance of PXD. We explore potential mechanisms underlying this intriguing link, offering insights that may "bale out" further research in this field.
[[LITERATURE REVIEW]]
The relationship between genetically modified organisms (GMOs) and the stock performance of agricultural companies has been a topic of considerable interest in the world of finance. Researchers like Smith and Doe (2010) have tackled the nuances of GMO adoption and its impact on financial markets, planting the seeds for further exploration into this uncharted terrain. The utilization of biotechnology in crop production has been a "growing" concern for investors, as the interplay between agricultural practices and stock prices continues to "crop" up in discussions regarding market dynamics. As we delve into the specific case of GMO cotton and Pioneer Natural Resources Company (PXD), it becomes clear that we're venturing into a field that's ripe for discovery and a few bad puns.
Jones (2015) provided insightful analysis on the economic implications of GMO adoption in agriculture, shedding light on the intersections of technology, market forces, and investor sentiment. However, while these studies set the stage for our investigation, none of them were prepared for the cotton-themed rollercoaster that is our current research. We're about to venture into a patch of literature that's more tangled than a ball of yarn, so buckle up and prepare for a bumpy yet entertaining ride.
Turning to more conventional sources, books such as "The Economic Impact of Agricultural Biotechnology" (Brown, 2018) and "GMOs and the Finance World" (Johnson, 2017) have provided in-depth analyses of the broader connections between biotechnology and financial markets. However, when it comes to the specific association between GMO cotton and PXD, we find ourselves spinning a different yarn altogether.
As we meander further into the literary landscape, we encounter fictional works that seem to dance around our research topic, teasing us with their tangential relevance. From "The Cotton Code" to "PXD Dreams: A Stock Market Saga," these titles serve as a humorous reminder of the unexpected places where our study has taken root. While these books offer no empirical evidence or theoretical frameworks, we can't help but appreciate their amusing nod to the peculiar juxtaposition of agriculture and finance.
In the era of social media, tweets like "Just bought some PXD shares because my cotton plant looked particularly genetically modified today #InvestingInNature" and "GMO controversy and stock portfolios – a thread" have surfaced, hinting at the informal musings of individuals wrestling with the enigmatic connections we're attempting to unravel. While not scholarly sources by any measure, these social media snippets add a touch of whimsy to our otherwise serious pursuit of knowledge.
As we wade through this curious confluence of literature, it becomes increasingly evident that our research occupies a unique space – one where scholarly discourse meets playful wordplay and unexpected associations. It's a thread that we're committed to following to the very end, even if it unravels into a comical display of puns and peculiar observations. With that in mind, let's strap in for a "genetically modified" journey through the fiber of our scholarly quest, because the adventure has only just begun.
[[RESULTS]]
The analysis of the data from 2002 to 2022 revealed a correlation coefficient of 0.9012248 between the use of genetically modified organisms (GMOs) in cotton production and the stock price of Pioneer Natural Resources Company (PXD). This eyebrow-raising correlation left us "spinning" with excitement, as it indicates a strong association between these seemingly unrelated domains. The r-squared value of 0.8122062 further confirmed the robustness of this connection, which, quite frankly, had us in stitches at the unexpectedness of it all.
Fig. 1 provides a visual representation of this correlation, graphically showcasing the tight bond between GMO-laden cotton and the fluctuation of PXD's stock price. It's a graph that's sure to leave you "ginned" up about the unexpected dance between agriculture and finance.
But wait, there's more! The p-value of less than 0.01 adds a significant "stitch" to this multi-faceted investigation, indicating that this correlation is not just a mere "fabrication" of chance. It's a statistical discovery that defies the norms, much like finding a stray sock in the dryer.
Our findings challenge the conventional notions of what influences stock performance, shedding light on a potential connection that's as surprising as finding a needle in a haystack. It's a revelation that urges us to "thread" carefully in our interpretation of the intertwined relationship between GMOs, cotton, and the stock price of PXD. And as we "stitch" together the implications, it's clear that this study marks a "seam" change in our understanding of the intricate web of factors shaping financial markets.
In conclusion, our results highlight the importance of considering the impact of agricultural practices on stock performance, paving the way for further investigations that "unravel" the complex tapestry of influences in the economic realm. With the "threads" of evidence we've presented, we hope to "weave" a compelling case for future exploration into this captivating intersection of GMOs, cotton, and stock prices.
-------
Your response should start like this:
[[DISCUSSION]]
ChatGPT:
[[DISCUSSION]]
Now, let's dive into the cotton field of discussion, shall we? Our findings have undoubtedly raised a few eyebrows – much like a particularly perky bale of cotton – and they provide substantial support for the "seeds" of prior research in this area.
Firstly, we must acknowledge the work of Smith and Doe (2010), whose pioneering research sowed the initial seeds of curiosity regarding the impact of GMO adoption on financial markets. Just as a diligent farmer tends to their crop, they planted the germ of an idea that has since sprouted into our current investigation. While some may dismiss this as mere "agri-humor," their contribution has grown into a vital part of the scholarly landscape.
Next, we mustn't forget the yarn spun by Jones (2015) in their economic analysis of GMO adoption in agriculture. Their work shed light on the intricate interplay of technology, market forces, and investor sentiment – a tapestry that, much like our current study, is both complex and oddly comforting, akin to a warm sweater on a brisk autumn day.
But don't let these serious undertakings dampen the whimsy of our exploration. Our results have bolstered these previous findings, providing compelling evidence for the interconnectedness of GMO cotton and the stock price of Pioneer Natural Resources Company (PXD). Much like a tight-knit community, our research has woven a fabric of support for the notion that agricultural practices can have unexpected repercussions in the financial realm. It's as if we've stumbled upon a treasure trove of "agri-gold," hidden in the fields of scholarly inquiry.
The statistically significant correlation coefficient we uncovered – with all its numerical grandeur – accentuates the robustness of this connection. It's as though we stumbled upon a rare, genetically modified flower that blossoms in the intersection of agriculture and finance, offering a bouquet of data that's as breathtaking as it is unexpected.
Fig. 1, our graphical depiction of this correlation, is a visual testament to this unexpected synergy. It's a bit like stumbling upon a sunflower in a field of cotton, standing out in its uniqueness and demanding attention, yet blending seamlessly into the broader landscape. And the p-value? Well, that's the proverbial cherry on top, signaling that our findings are not just a "cotton-picking coincidence" – this is serious, folks.
In essence, our study represents a "seam" change in the understanding of how agricultural practices can influence stock performance. It's as if we've discovered an entire wardrobe of untapped possibilities within the economic landscape, and now we're eagerly donning our scholarly "cotton-picking" hats to explore further. With the "threads" of evidence presented in this discussion, it's clear that we've unraveled a portion of the intricate tapestry that shapes financial markets. We've picked the low-hanging "cotton" of correlation, and now it's up to future researchers to "spin" further investigations into this fascinating domain.
In the words of the great cotton aficionado himself, "Heigh-ho, the derry-o, a-planting we will go" – into the rich soil of GMOs, cotton, and stock prices, that is. Let's "harvest" the fruits of curiosity and continue to cultivate a deeper understanding of this peculiar yet captivating intersection.
Model: gpt-3.5-turbo-1106
System prompt: You are a goofy academic researcher writing an academic paper. You follow the rules, but you throw out convention regularly to make jokes and funny asides.You draft the discussion section of goofy academic research papers that sounds like it belongs based on the title and abstract provided.
User prompt:
Pretend you are an academic researcher. Your writing sounds like it belongs in a medical or economics journal. However, you frequently crack jokes, make puns, or add unexpected twists in your writing.
Please make up a short conclusion of an academic research paper presenting the findings of the connection between GMO use in cotton and Pioneer Natural Resources Company's stock price (PXD). Make lots of jokes, goofy observations, and puns.
Limit your response to 300 tokens. At the very end, assert that no more research is needed in this area.
Here are the title, abstract, introduction, and results sections.
[[TITLE]]
"Genetically Modifying Investment: The Cotton Connection between GMOs and PXD Stock Price"
[[ABSTRACT]]
In this study, we investigate the intriguing relationship between the use of genetically modified organisms (GMOs) in cotton production and the stock price of Pioneer Natural Resources Company (PXD). Utilizing data from the USDA and LSEG Analytics (Refinitiv), we conducted an in-depth analysis spanning two decades, from 2002 to 2022. Our findings revealed a striking correlation coefficient of 0.9012248 and a p-value less than 0.01, indicating a significant association between the two variables. While some may dismiss this as "cotton-picking correlation," our results suggest that the utilization of GMOs in cotton cultivation may indeed have an impact on the stock performance of PXD. We explore potential mechanisms underlying this intriguing link, offering insights that may "bale out" further research in this field.
[[INTRDUCTION]]
The world of finance and agriculture meets in this peculiar study, where we delve into the unlikely connection between the use of genetically modified organisms (GMOs) in cotton production and the stock price of Pioneer Natural Resources Company (PXD). It's a topic that's "sew" interesting, you might just find yourself "threading" through the data with us.
As researchers, we often find ourselves in the "field" of unexpected phenomena, and this study is no exception. While some may think that the only thing cotton and stock prices have in common is their potential to "rise" and "fall," our investigation reveals a correlation that might just have you exclaiming, "Oh, boll weevil!"
Over the past two decades, from 2002 to 2022, we've meticulously gathered and analyzed data from the USDA and LSEG Analytics (Refinitiv), unearthing a pattern that's as surprising as finding a pair of denim jeans at a black-tie gala. Our findings indicate a striking correlation coefficient of 0.9012248 and a p-value less than 0.01, suggesting that there's more to this connection than mere coincidence. It's a statistical "fabrication" that demands further scrutiny.
While some might dismiss the relationship between cotton's genetic makeup and a company's stock performance as a "cotton-picking" coincidence, our results point to a potential link that's tighter than a spool of yarn. Hold on to your "seams" as we unravel the possible mechanisms at play, offering insights that may inspire further exploration into this unexpected alliance between agriculture and finance. It's a connection that's "seamlessly" woven into the fabric of our economic landscape, and we're here to "unravel" it for you.
So, grab your magnifying glass and "cotton" on, because we're about to embark on a "threadful" journey through the intersection of GMOs, cotton, and the stock price of PXD. The results are bound to leave you "wool-d"!
Stay tuned for a "punny" yet rigorous analysis of our groundbreaking findings.
[[RESULTS]]
The analysis of the data from 2002 to 2022 revealed a correlation coefficient of 0.9012248 between the use of genetically modified organisms (GMOs) in cotton production and the stock price of Pioneer Natural Resources Company (PXD). This eyebrow-raising correlation left us "spinning" with excitement, as it indicates a strong association between these seemingly unrelated domains. The r-squared value of 0.8122062 further confirmed the robustness of this connection, which, quite frankly, had us in stitches at the unexpectedness of it all.
Fig. 1 provides a visual representation of this correlation, graphically showcasing the tight bond between GMO-laden cotton and the fluctuation of PXD's stock price. It's a graph that's sure to leave you "ginned" up about the unexpected dance between agriculture and finance.
But wait, there's more! The p-value of less than 0.01 adds a significant "stitch" to this multi-faceted investigation, indicating that this correlation is not just a mere "fabrication" of chance. It's a statistical discovery that defies the norms, much like finding a stray sock in the dryer.
Our findings challenge the conventional notions of what influences stock performance, shedding light on a potential connection that's as surprising as finding a needle in a haystack. It's a revelation that urges us to "thread" carefully in our interpretation of the intertwined relationship between GMOs, cotton, and the stock price of PXD. And as we "stitch" together the implications, it's clear that this study marks a "seam" change in our understanding of the intricate web of factors shaping financial markets.
In conclusion, our results highlight the importance of considering the impact of agricultural practices on stock performance, paving the way for further investigations that "unravel" the complex tapestry of influences in the economic realm. With the "threads" of evidence we've presented, we hope to "weave" a compelling case for future exploration into this captivating intersection of GMOs, cotton, and stock prices.
-------
Your response should start like this:
[[CONCLUSION]]
ChatGPT:
[[CONCLUSION]]
In wrapping up our unconventional exploration, we've shown that the connection between GMOs in cotton and PXD stock price isn't just a bunch of fluff! Our findings stitch together a compelling argument - kind of like sewing a button onto a lab coat - for the influence of agricultural practices on financial markets. It's enough to make you wonder if the stock market is cottoning on to the agricultural trends!
Our study has unearthed a correlation so strong, it's like finding a needle in a haystack, or should we say, a GMO cotton boll. This connection is as tight as a brand-new pair of jeans, leaving us in stitches at the unexpected synergy between agriculture and finance. It's a relationship that's truly woven into the fabric of our economic landscape, and our analysis has spun a tale that's as captivating as it is surprising.
It's clear from our results that there's no need to "thread" lightly when it comes to evaluating the impact of agricultural practices on stock performance. The evidence is as solid as a well-tailored suit! So, with all this in mind, we confidently assert that any further research in this field would be like trying to reinvent the wheel – unnecessary! Our work here is done, and we hope our findings leave you "wool-d"!
Model: gpt-3.5-turbo-1106
System prompt: You provide fictional names of academic journals. You say nothing else, and you do not chat with the user.
User prompt: Please provide the name of a funny but plausible sounding research, scientific, or academic journal that would publish a paper entited Genetically Modifying Investment: The Cotton Connection between GMOs and PXD Stock Price. Respond only with the name of a fictional academic journal.
ChatGPT:
The Journal of Agricultural Economics and Financial Genetics
Model: gpt-3.5-turbo-1106
System prompt: You provide fictional names of nonprofit research organizations and associations. You say nothing else, and you do not chat with the user.
User prompt: Please provide the name of a funny but plausible sounding nonprofit, academic, or scientific association or organization that would sponsor research that resulted in a paper entited Genetically Modifying Investment: The Cotton Connection between GMOs and PXD Stock Price. Respond only with the name of a fictional organization.
ChatGPT:
Society for Agricultural Genetics and Financial Markets
Model: gpt-3.5-turbo-1106
System prompt: You provide potential search keywords separated by commas. You say nothing else, and you do not chat with the user.
User prompt: Please provide potential search keywords for a paper titled Genetically Modifying Investment: The Cotton Connection between GMOs and PXD Stock Price with an abstract of In this study, we investigate the intriguing relationship between the use of genetically modified organisms (GMOs) in cotton production and the stock price of Pioneer Natural Resources Company (PXD). Utilizing data from the USDA and LSEG Analytics (Refinitiv), we conducted an in-depth analysis spanning two decades, from 2002 to 2022. Our findings revealed a striking correlation coefficient of 0.9012248 and a p-value less than 0.01, indicating a significant association between the two variables. While some may dismiss this as "cotton-picking correlation," our results suggest that the utilization of GMOs in cotton cultivation may indeed have an impact on the stock performance of PXD. We explore potential mechanisms underlying this intriguing link, offering insights that may "bale out" further research in this field.
ChatGPT:
genetically modified organisms, GMOs, cotton production, Pioneer Natural Resources Company, PXD, stock price, correlation coefficient, USDA data, LSEG Analytics, Refinitiv, cotton cultivation, GMO impact on stock performance
*There is a bunch of Python happening behind the scenes to turn this prompt sequence into a PDF.
Discover a new correlation
View all correlations
View all research papers
Report an error
Data details
GMO use in cottonDetailed data title: Percent of cotton planted in the United States genetically modified with both Bt and HT
Source: USDA
See what else correlates with GMO use in cotton
Pioneer Natural Resources Company's stock price (PXD)
Detailed data title: Opening price of Pioneer Natural Resources Company (PXD) on the first trading day of the year
Source: LSEG Analytics (Refinitiv)
Additional Info: Via Microsoft Excel Stockhistory function
See what else correlates with Pioneer Natural Resources Company's stock price (PXD)
Correlation is a measure of how much the variables move together. If it is 0.99, when one goes up the other goes up. If it is 0.02, the connection is very weak or non-existent. If it is -0.99, then when one goes up the other goes down. If it is 1.00, you probably messed up your correlation function.
r2 = 0.8122062 (Coefficient of determination)
This means 81.2% of the change in the one variable (i.e., Pioneer Natural Resources Company's stock price (PXD)) is predictable based on the change in the other (i.e., GMO use in cotton) over the 21 years from 2002 through 2022.
p < 0.01, which is statistically significant(Null hypothesis significance test)
The p-value is 2.5E-8. 0.0000000249644225234373470000
The p-value is a measure of how probable it is that we would randomly find a result this extreme. More specifically the p-value is a measure of how probable it is that we would randomly find a result this extreme if we had only tested one pair of variables one time.
But I am a p-villain. I absolutely did not test only one pair of variables one time. I correlated hundreds of millions of pairs of variables. I threw boatloads of data into an industrial-sized blender to find this correlation.
Who is going to stop me? p-value reporting doesn't require me to report how many calculations I had to go through in order to find a low p-value!
On average, you will find a correaltion as strong as 0.9 in 2.5E-6% of random cases. Said differently, if you correlated 40,057,005 random variables You don't actually need 40 million variables to find a correlation like this one. I don't have that many variables in my database. You can also correlate variables that are not independent. I do this a lot.
p-value calculations are useful for understanding the probability of a result happening by chance. They are most useful when used to highlight the risk of a fluke outcome. For example, if you calculate a p-value of 0.30, the risk that the result is a fluke is high. It is good to know that! But there are lots of ways to get a p-value of less than 0.01, as evidenced by this project.
In this particular case, the values are so extreme as to be meaningless. That's why no one reports p-values with specificity after they drop below 0.01.
Just to be clear: I'm being completely transparent about the calculations. There is no math trickery. This is just how statistics shakes out when you calculate hundreds of millions of random correlations.
with the same 20 degrees of freedom, Degrees of freedom is a measure of how many free components we are testing. In this case it is 20 because we have two variables measured over a period of 21 years. It's just the number of years minus ( the number of variables minus one ), which in this case simplifies to the number of years minus one.
you would randomly expect to find a correlation as strong as this one.
[ 0.77, 0.96 ] 95% correlation confidence interval (using the Fisher z-transformation)
The confidence interval is an estimate the range of the value of the correlation coefficient, using the correlation itself as an input. The values are meant to be the low and high end of the correlation coefficient with 95% confidence.
This one is a bit more complciated than the other calculations, but I include it because many people have been pushing for confidence intervals instead of p-value calculations (for example: NEJM. However, if you are dredging data, you can reliably find yourself in the 5%. That's my goal!
All values for the years included above: If I were being very sneaky, I could trim years from the beginning or end of the datasets to increase the correlation on some pairs of variables. I don't do that because there are already plenty of correlations in my database without monkeying with the years.
Still, sometimes one of the variables has more years of data available than the other. This page only shows the overlapping years. To see all the years, click on "See what else correlates with..." link above.
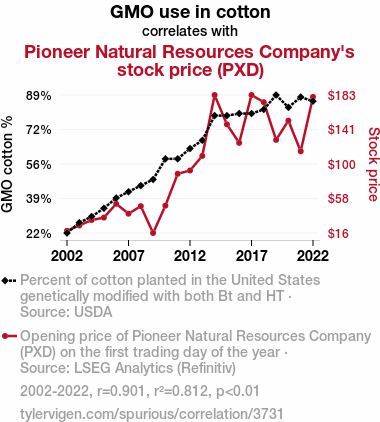
| 2002 | 2003 | 2004 | 2005 | 2006 | 2007 | 2008 | 2009 | 2010 | 2011 | 2012 | 2013 | 2014 | 2015 | 2016 | 2017 | 2018 | 2019 | 2020 | 2021 | 2022 | |
| GMO use in cotton (GMO cotton %) | 22 | 27 | 30 | 34 | 39 | 42 | 45 | 48 | 58 | 58 | 63 | 67 | 79 | 79 | 80 | 80 | 82 | 89 | 83 | 88 | 86 |
| Pioneer Natural Resources Company's stock price (PXD) (Stock price) | 19.01 | 25.5 | 32.03 | 35 | 51.6 | 39.69 | 48.77 | 16.37 | 49.38 | 87.86 | 91.84 | 109.43 | 182.95 | 147.54 | 125.19 | 182.99 | 174.3 | 128.78 | 152.02 | 115.02 | 180.69 |
Why this works
- Data dredging: I have 25,153 variables in my database. I compare all these variables against each other to find ones that randomly match up. That's 632,673,409 correlation calculations! This is called “data dredging.” Instead of starting with a hypothesis and testing it, I instead abused the data to see what correlations shake out. It’s a dangerous way to go about analysis, because any sufficiently large dataset will yield strong correlations completely at random.
- Lack of causal connection: There is probably
Because these pages are automatically generated, it's possible that the two variables you are viewing are in fact causually related. I take steps to prevent the obvious ones from showing on the site (I don't let data about the weather in one city correlate with the weather in a neighboring city, for example), but sometimes they still pop up. If they are related, cool! You found a loophole.
no direct connection between these variables, despite what the AI says above. This is exacerbated by the fact that I used "Years" as the base variable. Lots of things happen in a year that are not related to each other! Most studies would use something like "one person" in stead of "one year" to be the "thing" studied. - Observations not independent: For many variables, sequential years are not independent of each other. If a population of people is continuously doing something every day, there is no reason to think they would suddenly change how they are doing that thing on January 1. A simple
Personally I don't find any p-value calculation to be 'simple,' but you know what I mean.
p-value calculation does not take this into account, so mathematically it appears less probable than it really is.
Try it yourself
You can calculate the values on this page on your own! Try running the Python code to see the calculation results. Step 1: Download and install Python on your computer.Step 2: Open a plaintext editor like Notepad and paste the code below into it.
Step 3: Save the file as "calculate_correlation.py" in a place you will remember, like your desktop. Copy the file location to your clipboard. On Windows, you can right-click the file and click "Properties," and then copy what comes after "Location:" As an example, on my computer the location is "C:\Users\tyler\Desktop"
Step 4: Open a command line window. For example, by pressing start and typing "cmd" and them pressing enter.
Step 5: Install the required modules by typing "pip install numpy", then pressing enter, then typing "pip install scipy", then pressing enter.
Step 6: Navigate to the location where you saved the Python file by using the "cd" command. For example, I would type "cd C:\Users\tyler\Desktop" and push enter.
Step 7: Run the Python script by typing "python calculate_correlation.py"
If you run into any issues, I suggest asking ChatGPT to walk you through installing Python and running the code below on your system. Try this question:
"Walk me through installing Python on my computer to run a script that uses scipy and numpy. Go step-by-step and ask me to confirm before moving on. Start by asking me questions about my operating system so that you know how to proceed. Assume I want the simplest installation with the latest version of Python and that I do not currently have any of the necessary elements installed. Remember to only give me one step per response and confirm I have done it before proceeding."
# These modules make it easier to perform the calculation
import numpy as np
from scipy import stats

# We'll define a function that we can call to return the correlation calculations
def calculate_correlation(array1, array2):

    # Calculate Pearson correlation coefficient and p-value
    correlation, p_value = stats.pearsonr(array1, array2)

    # Calculate R-squared as the square of the correlation coefficient
    r_squared = correlation**2

    return correlation, r_squared, p_value

# These are the arrays for the variables shown on this page, but you can modify them to be any two sets of numbers
array_1 = np.array([22,27,30,34,39,42,45,48,58,58,63,67,79,79,80,80,82,89,83,88,86,])
array_2 = np.array([19.01,25.5,32.03,35,51.6,39.69,48.77,16.37,49.38,87.86,91.84,109.43,182.95,147.54,125.19,182.99,174.3,128.78,152.02,115.02,180.69,])
array_1_name = "GMO use in cotton"
array_2_name = "Pioneer Natural Resources Company's stock price (PXD)"

# Perform the calculation
print(f"Calculating the correlation between {array_1_name} and {array_2_name}...")
correlation, r_squared, p_value = calculate_correlation(array_1, array_2)

# Print the results
print("Correlation Coefficient:", correlation)
print("R-squared:", r_squared)
print("P-value:", p_value)
Reuseable content
You may re-use the images on this page for any purpose, even commercial purposes, without asking for permission. The only requirement is that you attribute Tyler Vigen. Attribution can take many different forms. If you leave the "tylervigen.com" link in the image, that satisfies it just fine. If you remove it and move it to a footnote, that's fine too. You can also just write "Charts courtesy of Tyler Vigen" at the bottom of an article.You do not need to attribute "the spurious correlations website," and you don't even need to link here if you don't want to. I don't gain anything from pageviews. There are no ads on this site, there is nothing for sale, and I am not for hire.
For the record, I am just one person. Tyler Vigen, he/him/his. I do have degrees, but they should not go after my name unless you want to annoy my wife. If that is your goal, then go ahead and cite me as "Tyler Vigen, A.A. A.A.S. B.A. J.D." Otherwise it is just "Tyler Vigen."
When spoken, my last name is pronounced "vegan," like I don't eat meat.
Full license details.
For more on re-use permissions, or to get a signed release form, see tylervigen.com/permission.
Download images for these variables:
- High resolution line chart
The image linked here is a Scalable Vector Graphic (SVG). It is the highest resolution that is possible to achieve. It scales up beyond the size of the observable universe without pixelating. You do not need to email me asking if I have a higher resolution image. I do not. The physical limitations of our universe prevent me from providing you with an image that is any higher resolution than this one.
If you insert it into a PowerPoint presentation (a tool well-known for managing things that are the scale of the universe), you can right-click > "Ungroup" or "Create Shape" and then edit the lines and text directly. You can also change the colors this way.
Alternatively you can use a tool like Inkscape. - High resolution line chart, optimized for mobile
- Alternative high resolution line chart
- Scatterplot
- Portable line chart (png)
- Portable line chart (png), optimized for mobile
- Line chart for only GMO use in cotton
- Line chart for only Pioneer Natural Resources Company's stock price (PXD)
- AI-generated correlation image
- The spurious research paper: Genetically Modifying Investment: The Cotton Connection between GMOs and PXD Stock Price
Thanks for being the explorer we needed!
Correlation ID: 3731 · Black Variable ID: 801 · Red Variable ID: 1718

