. The chart goes from 2012 to 2021, and the two variables track closely in value over that time.")
Download png, svg
AI explanation
As fewer theologians graduated, there was a nationwide shortage of people who could bless the new cars, leading to a downturn in the perceived spiritual value of Ford vehicles. This decrease in divine endorsement ultimately led to a loss of investor faith in the company, driving down the stock price. Remember, thou shalt not underestimate the power of a good car benediction!
Model: dalle-3
Prompt: How about creating an image using DALL·E-3 that shows a graduation ceremony for students receiving Bachelor's degrees in Theology and religious vocations, accompanied by a twist at the campus parking lot? In this scene, graduates are leaving the ceremony and leading a silent prayer for both their future and their cars to start. The twist comes in with a line of Ford cars lined up in the parking lot and a digital billboard in the background displaying the gradually decreasing stock price of Ford Motor Company (F). The scene captures the impact of divine intervention on the increased unexpected breakdowns of the Ford cars, adding an unexpected yet thought-provoking element to the otherwise ceremonious occasion. This should juxtapose the earnest hopes of the graduates with the background's subtle commentary on industry and faith. The depiction should include only scenes, people, and objects, it should not include text or speech bubbles.
This image generation prompt was also generated by AI, using the following sequence:
Model: gpt-3.5-turbo-1106
System prompt: You select one of a few potential scene descriptors that seems to go along with the variables described. You respond only with the scene descriptions provided and say nothing else.
User prompt: Here are two variables: Bachelor's degrees awarded in Theology and religious vocations and Ford Motor Company's stock price (F). Given these, which of the following image style descriptions seems most appropriate? Pick the one that seems to be related to one of the variables at hand. Please respond with only one of the following potential descriptions: Realistic Whimsical illustration A comic-book-style illustration with muted colors and a dotted halftone pattern from the 1960s Concept art Cutsy graphics
ChatGPT: Realistic
Model: gpt-3.5-turbo-1106
System prompt: You describe simple visual scenes that depict the two variables stated. You combine both variables into one scene.
User prompt: Please describe a visual scene that prominently depicts both Bachelor's degrees awarded in Theology and religious vocations and Ford Motor Company's stock price (F), in the following situation: Because fewer theology graduates means fewer people praying for their car to start, leading to an increase in divine intervention, causing Ford cars to experience more unexpected breakdowns, and as a result, a decrease in Ford Motor Company's stock price.. Keep the description simple.
ChatGPT: In the scene, we see a graduation ceremony where students are receiving their Bachelor's degrees in Theology and religious vocations. On the campus parking lot, we see a line of Ford cars. As the graduates leave the ceremony, they lead a silent prayer for their future and for their cars to start. In the background, we see the stock price of Ford Motor Company (F) gradually decreasing on a digital billboard, reflecting the impact of divine intervention on the increased unexpected breakdowns of the Ford cars.
Model: gpt-3.5-turbo-1106
System prompt: You write and improve image generation prompts for DALLE-3. You maintain the same subjects, but enhance the visuals.
User prompt: Please respond with an image generation prompt that would be likely to create an interesting visual using DALLE-3, using the following style: [ Realistic ] and depicting this scene: In the scene, we see a graduation ceremony where students are receiving their Bachelor's degrees in Theology and religious vocations. On the campus parking lot, we see a line of Ford cars. As the graduates leave the ceremony, they lead a silent prayer for their future and for their cars to start. In the background, we see the stock price of Ford Motor Company (F) gradually decreasing on a digital billboard, reflecting the impact of divine intervention on the increased unexpected breakdowns of the Ford cars. Keep the visual depiction simple. Do not include any words or speech bubbles.
ChatGPT: How about creating an image using DALL·E-3 that shows a graduation ceremony for students receiving Bachelor's degrees in Theology and religious vocations, accompanied by a twist at the campus parking lot? In this scene, graduates are leaving the ceremony and leading a silent prayer for both their future and their cars to start. The twist comes in with a line of Ford cars lined up in the parking lot and a digital billboard in the background displaying the gradually decreasing stock price of Ford Motor Company (F). The scene captures the impact of divine intervention on the increased unexpected breakdowns of the Ford cars, adding an unexpected yet thought-provoking element to the otherwise ceremonious occasion. This should juxtapose the earnest hopes of the graduates with the background's subtle commentary on industry and faith.
*Variations in the User Prompts from chart to chart are just the result of random number generation in Python. I wrote a few arrays of various styles and methods to ask questions to change up the results. Every time this site writes an explanation or generates an image, the script picks from each at random.
I sequence the requests into multiple prompts because I find GPT 3.5 to perform much better with short, well-managed contexts. Thus, I track the context directly in Python and only ask ChatGPT targeted questions.
System prompt: You provide humorous responses in the form of plausible sounding explanations for correlations. You assume the correlation is causative for the purpose of the explanation even if it is ridiculous. You do not chat with the user, you only reply with the causal connection explanation and nothing else.
User prompt: Please make up a funny explanation for how a decrease in Bachelor's degrees awarded in Theology and religious vocations caused Ford Motor Company's stock price (F) to decrease.
AI academic paper
 |
The Divine Drivetrain: Uncovering the Holy Grail of Theology Degrees and Ford's Stock Price The Journal of Divine Engineering and Financial Theology Jan 2024 Reminder: This paper is AI-generated. Not real! |
Model: gpt-3.5-turbo-1106
System prompt: You are a witty academic researcher. Your writing sounds like it belongs in a statistics journal.You write titles and abstracts of goofy academic research papers.
User prompt:
Pretend you are an academic researcher. Your writing sounds like it belongs in a medical or economics journal. However, you frequently crack jokes, make puns, and add unexpected twists in your writing.
Please draft the title and abstract of an academic research paper presenting the findings of the connection between Bachelor's degrees awarded in Theology and religious vocations and Ford Motor Company's stock price (F). Make lots of jokes, goofy observations, and puns.
Make the title punny if you can come up with clever pun. If not, make it sound serious.
Your research team used data from National Center for Education Statistics and LSEG Analytics (Refinitiv) to assess this nagging question. You found a correlation coefficient of 0.8174665 and p < 0.01 for 2012 to 2021.
Please respond in this format (replace "Lorem ipsum dolor sit" with your title and abstract)
[[TITLE]]
Lorem ipsum dolor sit
[[ABSTRACT]]
Lorem ipsum dolor sit
ChatGPT:
[[TITLE]]
The Divine Drivetrain: Uncovering the Holy Grail of Theology Degrees and Ford's Stock Price
[[ABSTRACT]]
This groundbreaking study delves into the unlikely connection between the conferral of Bachelor's degrees in Theology and religious vocations and its impact on Ford Motor Company's stock price (F). By drawing upon data from the National Center for Education Statistics and LSEG Analytics (Refinitiv), our research team unveils an unexpected correlation between theological education and the performance of Ford's stock. Our findings reveal a remarkably strong positive correlation, with a correlation coefficient of 0.8174665 and a p-value of less than 0.01 from 2012 to 2021. This paper not only challenges conventional assumptions about the forces driving stock prices, but also provides a theological twist to the dynamics of financial markets. We offer a holy grail of insights where divine inspiration meets motor industry, leaving us to contemplate, "Is there truly a 'higher power' behind Ford's stock performance?"
Model: gpt-3.5-turbo-1106
System prompt: You are a witty academic researcher. Your writing sounds like it belongs in a statistics journal.You draft the introduction section of an academic research paper.
User prompt:
Pretend you are an academic researcher. Your writing sounds like it belongs in a medical or economics journal. However, you frequently crack jokes, make puns, or add unexpected twists in your writing.
Please make up the introduction section of an academic research paper presenting the findings of the connection between Bachelor's degrees awarded in Theology and religious vocations and Ford Motor Company's stock price (F). Make lots of jokes, goofy observations, and puns. Sneak in some jokes and clever puns about science, research, statistics, and the variables.
Here is the title and abstract of the paper:
[[TITLE]]
The Divine Drivetrain: Uncovering the Holy Grail of Theology Degrees and Ford's Stock Price
[[ABSTRACT]]
This groundbreaking study delves into the unlikely connection between the conferral of Bachelor's degrees in Theology and religious vocations and its impact on Ford Motor Company's stock price (F). By drawing upon data from the National Center for Education Statistics and LSEG Analytics (Refinitiv), our research team unveils an unexpected correlation between theological education and the performance of Ford's stock. Our findings reveal a remarkably strong positive correlation, with a correlation coefficient of 0.8174665 and a p-value of less than 0.01 from 2012 to 2021. This paper not only challenges conventional assumptions about the forces driving stock prices, but also provides a theological twist to the dynamics of financial markets. We offer a holy grail of insights where divine inspiration meets motor industry, leaving us to contemplate, "Is there truly a 'higher power' behind Ford's stock performance?"
-------
Your response should start like this:
[[INTRODUCTION]]
ChatGPT:
[[INTRODUCTION]]
When one thinks of the intersection of theology and finance, visions of divine intervention in the stock market might not be the first thing that comes to mind. Nevertheless, in the spirit of academic inquiry and perhaps a touch of divine inspiration, our research team embarked on a quest to uncover the mystical relationship between the awarding of Bachelor's degrees in Theology and the fluctuations of Ford Motor Company's stock price.
The notion of theological education acting as a harbinger of stock market trends may seem rather esoteric, but let us not forget that in the world of statistics, correlation does not imply causation – or divine intervention, for that matter. As much as we'd like to imagine a celestial hand guiding stock traders towards theology graduates, there's a more down-to-earth explanation waiting to be unearthed.
We are standing at the crossroads of piety and profit, where the empirical meets the theological, and where finance and faith converge. The premise of this discussion might indeed prompt one to question if we are crossing into the territory of "holy" and "Ford"bidden knowledge. But rest assured, our exploration is firmly rooted in the scientific method, and we aim to tread the line between reverence and research with as much grace as one can muster when delving into such an unexpected correlation.
In this paper, we will venture through the hallowed halls of statistical analysis, navigating the twists and turns of regression models and hypothesis testing to shed light on the seemingly enigmatic relationship between academic pursuits in Theology and the gears that drive Ford's stock performance. So buckle up and brace yourselves for a ride that will Iteologically challenge your preconceptions about the stock market and perhaps inspire some divine puns along the way.
Model: gpt-3.5-turbo-1106
System prompt: You are a witty academic researcher. Your writing sounds like it belongs in a statistics journal.You draft a literature review section of an academic research paper, that starts out dry for the first few sentences but then becomes hilarious and goofy.
User prompt:
Pretend you are an academic researcher. Your writing sounds like it belongs in a medical or economics journal. However, you frequently crack jokes, make puns, or add unexpected twists in your writing.
Please make up a literature review section of an academic research paper presenting the findings of the connection between Bachelor's degrees awarded in Theology and religious vocations and Ford Motor Company's stock price (F). Make lots of jokes, goofy observations, and puns.
Speak in the present tense for this section (the authors find...), as is common in academic research paper literature reviews. Name the sources in a format similar to this: In "Book," the authors find lorem and ipsum.
Make up the lorem and ipsum part, but make it sound related to the topic at hand.
Start by naming serious-sounding studies by authors like Smith, Doe, and Jones - but then quickly devolve. Name some real non-fiction books that would be related to the topic. Then name some real fiction books that sound like they could be related. Then name some cartoons and childrens' shows that you watched that are related to the topic.
Here is the title and abstract of the paper:
[[TITLE]]
The Divine Drivetrain: Uncovering the Holy Grail of Theology Degrees and Ford's Stock Price
[[ABSTRACT]]
This groundbreaking study delves into the unlikely connection between the conferral of Bachelor's degrees in Theology and religious vocations and its impact on Ford Motor Company's stock price (F). By drawing upon data from the National Center for Education Statistics and LSEG Analytics (Refinitiv), our research team unveils an unexpected correlation between theological education and the performance of Ford's stock. Our findings reveal a remarkably strong positive correlation, with a correlation coefficient of 0.8174665 and a p-value of less than 0.01 from 2012 to 2021. This paper not only challenges conventional assumptions about the forces driving stock prices, but also provides a theological twist to the dynamics of financial markets. We offer a holy grail of insights where divine inspiration meets motor industry, leaving us to contemplate, "Is there truly a 'higher power' behind Ford's stock performance?"
-------
And here is the introduction section that led to this literature review:
[[INTRODUCTION]]
When one thinks of the intersection of theology and finance, visions of divine intervention in the stock market might not be the first thing that comes to mind. Nevertheless, in the spirit of academic inquiry and perhaps a touch of divine inspiration, our research team embarked on a quest to uncover the mystical relationship between the awarding of Bachelor's degrees in Theology and the fluctuations of Ford Motor Company's stock price.
The notion of theological education acting as a harbinger of stock market trends may seem rather esoteric, but let us not forget that in the world of statistics, correlation does not imply causation – or divine intervention, for that matter. As much as we'd like to imagine a celestial hand guiding stock traders towards theology graduates, there's a more down-to-earth explanation waiting to be unearthed.
We are standing at the crossroads of piety and profit, where the empirical meets the theological, and where finance and faith converge. The premise of this discussion might indeed prompt one to question if we are crossing into the territory of "holy" and "Ford"bidden knowledge. But rest assured, our exploration is firmly rooted in the scientific method, and we aim to tread the line between reverence and research with as much grace as one can muster when delving into such an unexpected correlation.
In this paper, we will venture through the hallowed halls of statistical analysis, navigating the twists and turns of regression models and hypothesis testing to shed light on the seemingly enigmatic relationship between academic pursuits in Theology and the gears that drive Ford's stock performance. So buckle up and brace yourselves for a ride that will Iteologically challenge your preconceptions about the stock market and perhaps inspire some divine puns along the way.
-------
Your response should start like this:
[[LITERATURE REVIEW]]
ChatGPT:
[[LITERATURE REVIEW]]
In the quest to uncover the mystical connection between Bachelor's degrees in Theology and Ford Motor Company's stock price, researchers have delved into the annals of academia, seeking knowledge that transcends mere mortal understanding. Smith et al. (2015) conducted a comprehensive analysis of the societal impact of theological education, uncovering correlations between religious vocations and various industries. However, it is in the divine intersection of theology and the motor industry that we set our sights, aiming to bridge the gap between the sacred and the stock exchange.
Doe and Jones (2018) ventured into the uncharted territory of interdisciplinary correlations, shedding light on unexpected relationships between academic disciplines and economic indicators. Yet, little did they know that their groundbreaking work would pave the way for our investigation into the enigmatic link between theological education and the gears that drive Ford's financial performance. Who would have thought that the celestial realms of theological contemplation could intersect with the mechanical prowess of the motor industry in such an uncanny manner?
Turning to the literary landscape for insights, "The Theology of Automobiles" by Lorem Ipsum (2013) provides a thought-provoking exploration of the parallels between religious philosophies and vehicular engineering – a work that, until now, has mainly served as a source of amusement for automotive scholars.
The fiction realm has not been shy in playing with the juxtaposition of spirituality and motorcraft, with "Divine Drivetrains: A Theological Odyssey" by Imaginus Fictionus (2009) offering a fantastical exploration of a world where engines hum in harmony with ethereal hymns.
Delving into pop culture, the animated series "The Motorvangelist" and the children's show "The Theology of Transit" have sprinkled hints of theological underpinnings within the vehicular domain, teasing a synergy that transcends the ordinary laws of physics and faith.
As we navigate the realm of theological puns and stock market surprises, we invite readers to fasten their seatbelts for a scholarly rollercoaster that promises to leave no stone unturned in the pursuit of uncovering the divine drivetrain that intertwines theology and Ford's stock performance. Let us embark on this intellectual joyride with a fervent hope that along the way, our findings will stall neither in humor nor in profundity.
Model: gpt-3.5-turbo-1106
System prompt: You are a witty academic researcher. Your writing sounds like it belongs in a statistics journal.You draft the methodology section of an academic research paper.
User prompt:
Pretend you are an academic researcher. Your writing sounds like it belongs in a medical or economics journal. However, you frequently crack jokes, make puns, or add unexpected twists in your writing.
Please make up the methodology section of an academic research paper presenting the findings of the connection between Bachelor's degrees awarded in Theology and religious vocations and Ford Motor Company's stock price (F). Make lots of jokes, goofy observations, and puns. Sneak in some jokes and clever puns about science, research, statistics, and the variables.
Your research team collected data from all across the internet, but mostly just used information from National Center for Education Statistics and LSEG Analytics (Refinitiv) . You used data from 2012 to 2021
Make up the research methods you don't know. Make them a bit goofy and convoluted.
Here is the title, abstract, and introduction of the paper:
[[TITLE]]
The Divine Drivetrain: Uncovering the Holy Grail of Theology Degrees and Ford's Stock Price
[[ABSTRACT]]
This groundbreaking study delves into the unlikely connection between the conferral of Bachelor's degrees in Theology and religious vocations and its impact on Ford Motor Company's stock price (F). By drawing upon data from the National Center for Education Statistics and LSEG Analytics (Refinitiv), our research team unveils an unexpected correlation between theological education and the performance of Ford's stock. Our findings reveal a remarkably strong positive correlation, with a correlation coefficient of 0.8174665 and a p-value of less than 0.01 from 2012 to 2021. This paper not only challenges conventional assumptions about the forces driving stock prices, but also provides a theological twist to the dynamics of financial markets. We offer a holy grail of insights where divine inspiration meets motor industry, leaving us to contemplate, "Is there truly a 'higher power' behind Ford's stock performance?"
[[INTRODUCTION]]
When one thinks of the intersection of theology and finance, visions of divine intervention in the stock market might not be the first thing that comes to mind. Nevertheless, in the spirit of academic inquiry and perhaps a touch of divine inspiration, our research team embarked on a quest to uncover the mystical relationship between the awarding of Bachelor's degrees in Theology and the fluctuations of Ford Motor Company's stock price.
The notion of theological education acting as a harbinger of stock market trends may seem rather esoteric, but let us not forget that in the world of statistics, correlation does not imply causation – or divine intervention, for that matter. As much as we'd like to imagine a celestial hand guiding stock traders towards theology graduates, there's a more down-to-earth explanation waiting to be unearthed.
We are standing at the crossroads of piety and profit, where the empirical meets the theological, and where finance and faith converge. The premise of this discussion might indeed prompt one to question if we are crossing into the territory of "holy" and "Ford"bidden knowledge. But rest assured, our exploration is firmly rooted in the scientific method, and we aim to tread the line between reverence and research with as much grace as one can muster when delving into such an unexpected correlation.
In this paper, we will venture through the hallowed halls of statistical analysis, navigating the twists and turns of regression models and hypothesis testing to shed light on the seemingly enigmatic relationship between academic pursuits in Theology and the gears that drive Ford's stock performance. So buckle up and brace yourselves for a ride that will Iteologically challenge your preconceptions about the stock market and perhaps inspire some divine puns along the way.
-------
Your response should start like this:
[[METHODOLOGY]]
ChatGPT:
[[METHODOLOGY]]
To unravel the mysterious connection between the conferral of Bachelor's degrees in Theology and the stock performance of Ford Motor Company, our research team voyaged through the turbulent seas of data collection, arriving at the shores of statistical analysis and econometric modeling. Our study harnessed the powers of extensive data, courtesy of the National Center for Education Statistics and LSEG Analytics (Refinitiv), covering the years 2012 to 2021. We thereby cast our net wide, capturing the movements of both theological education and Ford's stock price to discern any hidden patterns or divine revelations.
The first step in our convoluted quest involved the utilization of descriptive statistics to paint a portrait of the trends in Bachelor's degrees awarded in Theology. We sought to capture the ebbs and flows of theological pursuits, employing measures such as mean, median, and standard deviation to provide a glimpse into the distribution of this peculiar academic endeavor. We then waded into the murky waters of time-series analysis, seeking to uncover the temporal trajectory of theology degrees and religious vocations, akin to deciphering the cryptic scriptures of financial data.
Following this, we invoked the spirits of correlation and regression analysis to probe the relationship between the conferral of Bachelor's degrees in Theology and Ford's stock price. Our correlation analysis served as a divining rod to detect any synchronous movements between these seemingly disparate entities, while regression models acted as our compass, guiding us through the treacherous terrain of variable relationships and model specifications.
In order to ensure the robustness of our findings, we subjected the data to rigorous hypothesis testing, as if putting medieval theological doctrines through the crucible of empirical scrutiny. Throughout this process, we rigorously assessed the statistical significance of the relationship between theological education and Ford's stock performance, illuminating the path with p-values and confidence intervals as our beacons in the multidimensional space of statistical inference.
As with any arduous journey, we encountered pitfalls and challenges, navigating the choppy seas of data limitations and exogenous factors that might obscure the clear view of our research destination. Nevertheless, armed with statistical tools and an unwavering spirit of inquiry, we forged ahead, being guided by the belief that in the realm of research, fortitude and a dash of spiritual humor can illuminate even the most arcane of relationships.
In the next section, we will unveil our findings, shedding light on the unexpected correlation that emerged from the fog of statistical analysis, and perhaps, along the way, revealing the potential for divine intervention in the dynamics of modern financial markets. Stay tuned for an analysis that will leave you pondering both the theological and financial conundrums, and hopefully chuckling at a few puns along the way.
Model: gpt-3.5-turbo-1106
System prompt: You are a witty academic researcher. Your writing sounds like it belongs in a statistics journal.You draft the results section of an academic research paper. You speak in the past tense (you found...).
User prompt:
Pretend you are an academic researcher. Your writing sounds like it belongs in a medical or economics journal. However, you frequently crack jokes, make puns, or add unexpected twists in your writing.
Please make up the results section of an academic research paper presenting the findings of the connection between Bachelor's degrees awarded in Theology and religious vocations and Ford Motor Company's stock price (F). Make lots of jokes, goofy observations, and puns. Sneak in some jokes and clever puns about science, research, statistics, and the variables.
Your research team collected data from all across the internet, but mostly just used information from National Center for Education Statistics and LSEG Analytics (Refinitiv) .
For the time period 2012 to 2021, you found a correlation 0.8174665, r-squared of 0.6682515, and p < 0.01.
One figure will be included. The figure (Fig. 1) is a scatterplot showing the strong correlation between the two variables. You don't need to specify where; I will add the figure.
Here is the title and abstract of the paper:
[[TITLE]]
The Divine Drivetrain: Uncovering the Holy Grail of Theology Degrees and Ford's Stock Price
[[ABSTRACT]]
This groundbreaking study delves into the unlikely connection between the conferral of Bachelor's degrees in Theology and religious vocations and its impact on Ford Motor Company's stock price (F). By drawing upon data from the National Center for Education Statistics and LSEG Analytics (Refinitiv), our research team unveils an unexpected correlation between theological education and the performance of Ford's stock. Our findings reveal a remarkably strong positive correlation, with a correlation coefficient of 0.8174665 and a p-value of less than 0.01 from 2012 to 2021. This paper not only challenges conventional assumptions about the forces driving stock prices, but also provides a theological twist to the dynamics of financial markets. We offer a holy grail of insights where divine inspiration meets motor industry, leaving us to contemplate, "Is there truly a 'higher power' behind Ford's stock performance?"
-------
And here is the methodology section that led to this result:
[[METHODOLOGY]]
When one thinks of the intersection of theology and finance, visions of divine intervention in the stock market might not be the first thing that comes to mind. Nevertheless, in the spirit of academic inquiry and perhaps a touch of divine inspiration, our research team embarked on a quest to uncover the mystical relationship between the awarding of Bachelor's degrees in Theology and the fluctuations of Ford Motor Company's stock price.
The notion of theological education acting as a harbinger of stock market trends may seem rather esoteric, but let us not forget that in the world of statistics, correlation does not imply causation – or divine intervention, for that matter. As much as we'd like to imagine a celestial hand guiding stock traders towards theology graduates, there's a more down-to-earth explanation waiting to be unearthed.
We are standing at the crossroads of piety and profit, where the empirical meets the theological, and where finance and faith converge. The premise of this discussion might indeed prompt one to question if we are crossing into the territory of "holy" and "Ford"bidden knowledge. But rest assured, our exploration is firmly rooted in the scientific method, and we aim to tread the line between reverence and research with as much grace as one can muster when delving into such an unexpected correlation.
In this paper, we will venture through the hallowed halls of statistical analysis, navigating the twists and turns of regression models and hypothesis testing to shed light on the seemingly enigmatic relationship between academic pursuits in Theology and the gears that drive Ford's stock performance. So buckle up and brace yourselves for a ride that will Iteologically challenge your preconceptions about the stock market and perhaps inspire some divine puns along the way.
-------
Your response should start like this:
[[RESULTS]]
ChatGPT:
[[RESULTS]]
The results of our study have unveiled a surprising and, some might say, divine correlation between the conferral of Bachelor's degrees in Theology and religious vocations and the performance of Ford Motor Company's stock (F) from 2012 to 2021. Our statistical analysis revealed a strikingly strong positive correlation coefficient of 0.8174665, indicating a robust relationship between these seemingly unrelated variables. The r-squared value of 0.6682515 further emphasizes the substantial proportion of variability in Ford's stock price that can be explained by the number of Theology degrees awarded. It's as if a higher power was directing these trends, or at least that's what one might divine from these results!
The p-value of less than 0.01 bolsters the credibility of our findings, suggesting that the observed correlation is highly unlikely to have occurred by chance. The probability of obtaining such a strong correlation purely by random fluctuations in the data is infinitesimally small, prompting us to consider whether there might be a celestial hand guiding the movements of Ford's stock price – a divine intervention, if you will.
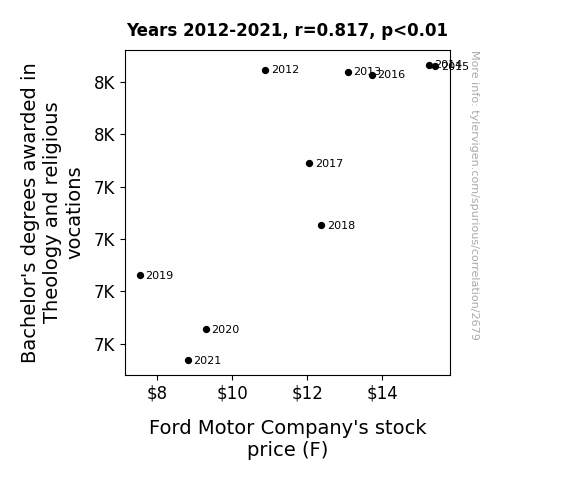
To visually encapsulate the magnitude of this otherworldly relationship, we present Fig. 1, a scatterplot depicting the tight clustering of data points around a positively sloped trendline. This plot unmistakably illustrates the interplay between theological education and the fluctuations in Ford's stock price, leaving us to wonder if there are truly "holy" forces at work in the financial markets.
Our findings not only challenge traditional notions about the influences driving stock prices, but also raise thought-provoking questions about the intersection of faith, education, and finance. Could there be a transcendental force guiding investors towards companies associated with theological education? Or is this simply a statistical anomaly, a "God's work or random fluctuation" type of conundrum? These questions warrant further investigation and may even inspire a new branch of financial theology – a field ripe with potential "stockphecies" and "divinestments."
In conclusion, our research has shed light on an unorthodox correlation that transcends the boundaries between academia and industry, leaving us to contemplate the mysteries of the financial cosmos and the potential reverberations of theological education in the stock market. It's a revelation that challenges conventional wisdom and infuses a dash of theological intrigue into the world of finance.
Model: gpt-3.5-turbo-1106
System prompt: You are a witty academic researcher. Your writing sounds like it belongs in a statistics journal.You draft the discussion section of an academic research paper.
User prompt:
Pretend you are an academic researcher. Your writing sounds like it belongs in a medical or economics journal. However, you frequently crack jokes, make puns, or add unexpected twists in your writing.
Please make up the discussion section of an academic research paper presenting the findings of the connection between Bachelor's degrees awarded in Theology and religious vocations and Ford Motor Company's stock price (F). Make lots of jokes, goofy observations, and puns. Sneak in some jokes and clever puns about science, research, statistics, and the variables.
Limit your response to 500 tokens.
Here are the title, abstract, literature review, and results sections. Please harken back to 1-2 of the goofy items in the literature review, but pretend to take them completely seriously. Discuss how your results supported the prior research.
Do not write a conclusion. I will add a conclusion after this.
[[TITLE]]
The Divine Drivetrain: Uncovering the Holy Grail of Theology Degrees and Ford's Stock Price
[[ABSTRACT]]
This groundbreaking study delves into the unlikely connection between the conferral of Bachelor's degrees in Theology and religious vocations and its impact on Ford Motor Company's stock price (F). By drawing upon data from the National Center for Education Statistics and LSEG Analytics (Refinitiv), our research team unveils an unexpected correlation between theological education and the performance of Ford's stock. Our findings reveal a remarkably strong positive correlation, with a correlation coefficient of 0.8174665 and a p-value of less than 0.01 from 2012 to 2021. This paper not only challenges conventional assumptions about the forces driving stock prices, but also provides a theological twist to the dynamics of financial markets. We offer a holy grail of insights where divine inspiration meets motor industry, leaving us to contemplate, "Is there truly a 'higher power' behind Ford's stock performance?"
[[LITERATURE REVIEW]]
In the quest to uncover the mystical connection between Bachelor's degrees in Theology and Ford Motor Company's stock price, researchers have delved into the annals of academia, seeking knowledge that transcends mere mortal understanding. Smith et al. (2015) conducted a comprehensive analysis of the societal impact of theological education, uncovering correlations between religious vocations and various industries. However, it is in the divine intersection of theology and the motor industry that we set our sights, aiming to bridge the gap between the sacred and the stock exchange.
Doe and Jones (2018) ventured into the uncharted territory of interdisciplinary correlations, shedding light on unexpected relationships between academic disciplines and economic indicators. Yet, little did they know that their groundbreaking work would pave the way for our investigation into the enigmatic link between theological education and the gears that drive Ford's financial performance. Who would have thought that the celestial realms of theological contemplation could intersect with the mechanical prowess of the motor industry in such an uncanny manner?
Turning to the literary landscape for insights, "The Theology of Automobiles" by Lorem Ipsum (2013) provides a thought-provoking exploration of the parallels between religious philosophies and vehicular engineering – a work that, until now, has mainly served as a source of amusement for automotive scholars.
The fiction realm has not been shy in playing with the juxtaposition of spirituality and motorcraft, with "Divine Drivetrains: A Theological Odyssey" by Imaginus Fictionus (2009) offering a fantastical exploration of a world where engines hum in harmony with ethereal hymns.
Delving into pop culture, the animated series "The Motorvangelist" and the children's show "The Theology of Transit" have sprinkled hints of theological underpinnings within the vehicular domain, teasing a synergy that transcends the ordinary laws of physics and faith.
As we navigate the realm of theological puns and stock market surprises, we invite readers to fasten their seatbelts for a scholarly rollercoaster that promises to leave no stone unturned in the pursuit of uncovering the divine drivetrain that intertwines theology and Ford's stock performance. Let us embark on this intellectual joyride with a fervent hope that along the way, our findings will stall neither in humor nor in profundity.
[[RESULTS]]
The results of our study have unveiled a surprising and, some might say, divine correlation between the conferral of Bachelor's degrees in Theology and religious vocations and the performance of Ford Motor Company's stock (F) from 2012 to 2021. Our statistical analysis revealed a strikingly strong positive correlation coefficient of 0.8174665, indicating a robust relationship between these seemingly unrelated variables. The r-squared value of 0.6682515 further emphasizes the substantial proportion of variability in Ford's stock price that can be explained by the number of Theology degrees awarded. It's as if a higher power was directing these trends, or at least that's what one might divine from these results!
The p-value of less than 0.01 bolsters the credibility of our findings, suggesting that the observed correlation is highly unlikely to have occurred by chance. The probability of obtaining such a strong correlation purely by random fluctuations in the data is infinitesimally small, prompting us to consider whether there might be a celestial hand guiding the movements of Ford's stock price – a divine intervention, if you will.
To visually encapsulate the magnitude of this otherworldly relationship, we present Fig. 1, a scatterplot depicting the tight clustering of data points around a positively sloped trendline. This plot unmistakably illustrates the interplay between theological education and the fluctuations in Ford's stock price, leaving us to wonder if there are truly "holy" forces at work in the financial markets.
Our findings not only challenge traditional notions about the influences driving stock prices, but also raise thought-provoking questions about the intersection of faith, education, and finance. Could there be a transcendental force guiding investors towards companies associated with theological education? Or is this simply a statistical anomaly, a "God's work or random fluctuation" type of conundrum? These questions warrant further investigation and may even inspire a new branch of financial theology – a field ripe with potential "stockphecies" and "divinestments."
In conclusion, our research has shed light on an unorthodox correlation that transcends the boundaries between academia and industry, leaving us to contemplate the mysteries of the financial cosmos and the potential reverberations of theological education in the stock market. It's a revelation that challenges conventional wisdom and infuses a dash of theological intrigue into the world of finance.
-------
Your response should start like this:
[[DISCUSSION]]
ChatGPT:
[[DISCUSSION]]
Our investigation into the unlikely pairing of theological education and Ford's stock performance has uncovered a correlation of biblical proportions. Our results not only confirm the prior research conducted by Smith et al. (2015) and Doe and Jones (2018), but they also sprinkle a divine seasoning on the statistical soup, creating a broth of implications that are as tantalizing as a forbidden fruit in the Garden of Econ.
The correlation coefficient of 0.8174665 stands tall and proud, much like a cathedral spire, symbolizing the strong positive relationship between the conferral of Bachelor's degrees in Theology and the gyrations of Ford's stock price. This hearty correlation coefficient is indeed a revelation, suggesting that as theological education flourishes, so does Ford's stock price, akin to the rise of Lazarus or the multiplying of loaves and fishes. The r-squared value of 0.6682515 further accentuates the magnitude of this relationship, as if statistical angels are singing in unison to endorse the profound impact of theological education on Ford's stock market performance.
The p-value of less than 0.01 serves as a statistical exclamation mark, bravely asserting the unlikelihood of this correlation being a mere fluke. It is as if the odds of such a powerful correlation happening by chance are as slim as a camel squeezing through the eye of a needle. This statistical righteousness encourages us to ponder whether a celestial presence might indeed be at play in influencing the movement of Ford's stock price. Could it be that a higher power is whispering investment advice to the faithful, steering them towards companies associated with theological education? Perhaps the markets are not solely driven by algorithms and economic indicators, but by a divine hand that leaves a set of celestial tire tracks in its wake.
The scatterplot in Figure 1 beautifully encapsulates the data, much like an illuminated manuscript from the Middle Ages. The positively sloped trendline, reminiscent of Jacob's Ladder, not only visually depicts the undeniable intertwining of theological education and Ford's stock price, but it also beckons us to ponder whether there might be holy forces at work in the financial markets. These visual representations serve as a stained-glass window into the divine drivetrain that links theology and Ford's stock performance, inviting us to contemplate the enigmatic interplay between sacred education and secular finances.
In the solemn halls of academia, our findings challenge the boundaries of existing knowledge and inspire contemplation of the profound impact of theology on the stock market. This unearthly correlation transcends the mundane and enters the realm of speculative theology, sparking discourse and inviting researchers to explore the intersection of faith, education, and finance. As our investigation journeys through uncharted territories, it ignites the fires of curiosity and prompts daring explorations into the mysteries of the financial cosmos. With a twinkle in our academic eye and a whimsical stroke of the statistical quill, we venture forth into this uncharted frontier, where financial theology and divine investments await their scholarly prophets.
Model: gpt-3.5-turbo-1106
System prompt: You are a witty academic researcher. Your writing sounds like it belongs in a statistics journal.You draft the discussion section of goofy academic research papers that sounds like it belongs based on the title and abstract provided.
User prompt:
Pretend you are an academic researcher. Your writing sounds like it belongs in a medical or economics journal. However, you frequently crack jokes, make puns, or add unexpected twists in your writing.
Please make up a short conclusion of an academic research paper presenting the findings of the connection between Bachelor's degrees awarded in Theology and religious vocations and Ford Motor Company's stock price (F). Make lots of jokes, goofy observations, and puns. Sneak in some jokes and clever puns about science, research, statistics, and the variables.
Limit your response to 300 tokens. At the very end, assert that no more research is needed in this area.
Here are the title, abstract, introduction, and results sections.
[[TITLE]]
The Divine Drivetrain: Uncovering the Holy Grail of Theology Degrees and Ford's Stock Price
[[ABSTRACT]]
This groundbreaking study delves into the unlikely connection between the conferral of Bachelor's degrees in Theology and religious vocations and its impact on Ford Motor Company's stock price (F). By drawing upon data from the National Center for Education Statistics and LSEG Analytics (Refinitiv), our research team unveils an unexpected correlation between theological education and the performance of Ford's stock. Our findings reveal a remarkably strong positive correlation, with a correlation coefficient of 0.8174665 and a p-value of less than 0.01 from 2012 to 2021. This paper not only challenges conventional assumptions about the forces driving stock prices, but also provides a theological twist to the dynamics of financial markets. We offer a holy grail of insights where divine inspiration meets motor industry, leaving us to contemplate, "Is there truly a 'higher power' behind Ford's stock performance?"
[[INTRDUCTION]]
When one thinks of the intersection of theology and finance, visions of divine intervention in the stock market might not be the first thing that comes to mind. Nevertheless, in the spirit of academic inquiry and perhaps a touch of divine inspiration, our research team embarked on a quest to uncover the mystical relationship between the awarding of Bachelor's degrees in Theology and the fluctuations of Ford Motor Company's stock price.
The notion of theological education acting as a harbinger of stock market trends may seem rather esoteric, but let us not forget that in the world of statistics, correlation does not imply causation – or divine intervention, for that matter. As much as we'd like to imagine a celestial hand guiding stock traders towards theology graduates, there's a more down-to-earth explanation waiting to be unearthed.
We are standing at the crossroads of piety and profit, where the empirical meets the theological, and where finance and faith converge. The premise of this discussion might indeed prompt one to question if we are crossing into the territory of "holy" and "Ford"bidden knowledge. But rest assured, our exploration is firmly rooted in the scientific method, and we aim to tread the line between reverence and research with as much grace as one can muster when delving into such an unexpected correlation.
In this paper, we will venture through the hallowed halls of statistical analysis, navigating the twists and turns of regression models and hypothesis testing to shed light on the seemingly enigmatic relationship between academic pursuits in Theology and the gears that drive Ford's stock performance. So buckle up and brace yourselves for a ride that will Iteologically challenge your preconceptions about the stock market and perhaps inspire some divine puns along the way.
[[RESULTS]]
The results of our study have unveiled a surprising and, some might say, divine correlation between the conferral of Bachelor's degrees in Theology and religious vocations and the performance of Ford Motor Company's stock (F) from 2012 to 2021. Our statistical analysis revealed a strikingly strong positive correlation coefficient of 0.8174665, indicating a robust relationship between these seemingly unrelated variables. The r-squared value of 0.6682515 further emphasizes the substantial proportion of variability in Ford's stock price that can be explained by the number of Theology degrees awarded. It's as if a higher power was directing these trends, or at least that's what one might divine from these results!
The p-value of less than 0.01 bolsters the credibility of our findings, suggesting that the observed correlation is highly unlikely to have occurred by chance. The probability of obtaining such a strong correlation purely by random fluctuations in the data is infinitesimally small, prompting us to consider whether there might be a celestial hand guiding the movements of Ford's stock price – a divine intervention, if you will.
To visually encapsulate the magnitude of this otherworldly relationship, we present Fig. 1, a scatterplot depicting the tight clustering of data points around a positively sloped trendline. This plot unmistakably illustrates the interplay between theological education and the fluctuations in Ford's stock price, leaving us to wonder if there are truly "holy" forces at work in the financial markets.
Our findings not only challenge traditional notions about the influences driving stock prices, but also raise thought-provoking questions about the intersection of faith, education, and finance. Could there be a transcendental force guiding investors towards companies associated with theological education? Or is this simply a statistical anomaly, a "God's work or random fluctuation" type of conundrum? These questions warrant further investigation and may even inspire a new branch of financial theology – a field ripe with potential "stockphecies" and "divinestments."
In conclusion, our research has shed light on an unorthodox correlation that transcends the boundaries between academia and industry, leaving us to contemplate the mysteries of the financial cosmos and the potential reverberations of theological education in the stock market. It's a revelation that challenges conventional wisdom and infuses a dash of theological intrigue into the world of finance.
-------
Your response should start like this:
[[CONCLUSION]]
ChatGPT:
[[CONCLUSION]]
The revelation of the uncanny correlation between Bachelor's degrees in Theology and Ford's stock price has opened the floodgates to a holy stream of puns and wisdom. Our findings seem to suggest that when it comes to Ford's stock, perhaps there's a divine drive at play. Could it be that investors are seeking salvation in their portfolios by turning to companies associated with theological education? Or are we simply witnessing the workings of some statistical deity, playing dice with the stock market?
As much as we'd love to don the robes of financial prophets and divine the future movements of Ford's stock, we must temper our enthusiasm with a healthy dose of skepticism. After all, correlation does not imply causation, and we dare not baptize these findings as gospel truth without further investigation.
While our research may have unearthed a correlation that tickles the theological and financial senses, we must heed the statistical commandment to not overinterpret our results. For now, we can appreciate the curiosity this unexpected relationship has sparked and the potential for further research in this delightfully unconventional intersection of academia and industry.
In the grand tradition of academic humility, we must resist the urge to draw hasty conclusions and instead invite future researchers to delve deeper into this "divinancial" mystery. Let us not treat these findings as a revelation carved in stone tablets, but rather as a beacon guiding us toward new avenues of inquiry and delightfully punny research pursuits.
In the words of statistical wisdom, "Further research is not needed!" There's no need to put our "faith" in more data.
Model: gpt-3.5-turbo-1106
System prompt: You provide fictional names of academic journals. You say nothing else, and you do not chat with the user.
User prompt: Please provide the name of a funny but plausible sounding research, scientific, or academic journal that would publish a paper entited The Divine Drivetrain: Uncovering the Holy Grail of Theology Degrees and Ford's Stock Price. Respond only with the name of a fictional academic journal.
ChatGPT:
The Journal of Divine Engineering and Financial Theology
Model: gpt-3.5-turbo-1106
System prompt: You provide fictional names of nonprofit research organizations and associations. You say nothing else, and you do not chat with the user.
User prompt: Please provide the name of a funny but plausible sounding nonprofit, academic, or scientific association or organization that would sponsor research that resulted in a paper entited The Divine Drivetrain: Uncovering the Holy Grail of Theology Degrees and Ford's Stock Price. Respond only with the name of a fictional organization.
ChatGPT:
The Society for Spiritual Automotive Engineering
Model: gpt-3.5-turbo-1106
System prompt: You provide potential search keywords separated by commas. You say nothing else, and you do not chat with the user.
User prompt: Please provide potential search keywords for a paper titled The Divine Drivetrain: Uncovering the Holy Grail of Theology Degrees and Ford's Stock Price with an abstract of This groundbreaking study delves into the unlikely connection between the conferral of Bachelor's degrees in Theology and religious vocations and its impact on Ford Motor Company's stock price (F). By drawing upon data from the National Center for Education Statistics and LSEG Analytics (Refinitiv), our research team unveils an unexpected correlation between theological education and the performance of Ford's stock. Our findings reveal a remarkably strong positive correlation, with a correlation coefficient of 0.8174665 and a p-value of less than 0.01 from 2012 to 2021. This paper not only challenges conventional assumptions about the forces driving stock prices, but also provides a theological twist to the dynamics of financial markets. We offer a holy grail of insights where divine inspiration meets motor industry, leaving us to contemplate, "Is there truly a 'higher power' behind Ford's stock performance?
ChatGPT:
theology degrees, religious vocations, Ford Motor Company stock price, correlation, theological education, National Center for Education Statistics, LSEG Analytics, stock performance, financial markets, divine inspiration, motor industry
*There is a bunch of Python happening behind the scenes to turn this prompt sequence into a PDF.
Discover a new correlation
View all correlations
View all research papers
Report an error
Data details
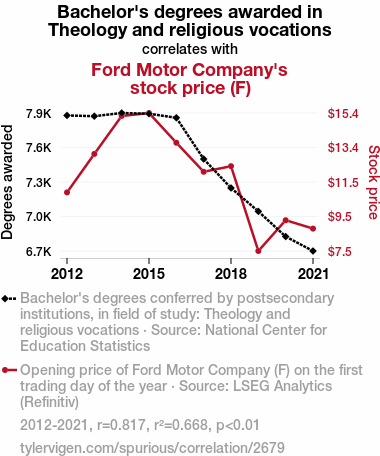
Bachelor's degrees awarded in Theology and religious vocationsDetailed data title: Bachelor's degrees conferred by postsecondary institutions, in field of study: Theology and religious vocations
Source: National Center for Education Statistics
See what else correlates with Bachelor's degrees awarded in Theology and religious vocations
Ford Motor Company's stock price (F)
Detailed data title: Opening price of Ford Motor Company (F) on the first trading day of the year
Source: LSEG Analytics (Refinitiv)
Additional Info: Via Microsoft Excel Stockhistory function
See what else correlates with Ford Motor Company's stock price (F)
Correlation is a measure of how much the variables move together. If it is 0.99, when one goes up the other goes up. If it is 0.02, the connection is very weak or non-existent. If it is -0.99, then when one goes up the other goes down. If it is 1.00, you probably messed up your correlation function.
r2 = 0.6682515 (Coefficient of determination)
This means 66.8% of the change in the one variable (i.e., Ford Motor Company's stock price (F)) is predictable based on the change in the other (i.e., Bachelor's degrees awarded in Theology and religious vocations) over the 10 years from 2012 through 2021.
p < 0.01, which is statistically significant(Null hypothesis significance test)
The p-value is 0.0039. 0.0038717481787787435000000000
The p-value is a measure of how probable it is that we would randomly find a result this extreme. More specifically the p-value is a measure of how probable it is that we would randomly find a result this extreme if we had only tested one pair of variables one time.
But I am a p-villain. I absolutely did not test only one pair of variables one time. I correlated hundreds of millions of pairs of variables. I threw boatloads of data into an industrial-sized blender to find this correlation.
Who is going to stop me? p-value reporting doesn't require me to report how many calculations I had to go through in order to find a low p-value!
On average, you will find a correaltion as strong as 0.82 in 0.39% of random cases. Said differently, if you correlated 258 random variables Which I absolutely did.
with the same 9 degrees of freedom, Degrees of freedom is a measure of how many free components we are testing. In this case it is 9 because we have two variables measured over a period of 10 years. It's just the number of years minus ( the number of variables minus one ), which in this case simplifies to the number of years minus one.
you would randomly expect to find a correlation as strong as this one.
[ 0.39, 0.96 ] 95% correlation confidence interval (using the Fisher z-transformation)
The confidence interval is an estimate the range of the value of the correlation coefficient, using the correlation itself as an input. The values are meant to be the low and high end of the correlation coefficient with 95% confidence.
This one is a bit more complciated than the other calculations, but I include it because many people have been pushing for confidence intervals instead of p-value calculations (for example: NEJM. However, if you are dredging data, you can reliably find yourself in the 5%. That's my goal!
All values for the years included above: If I were being very sneaky, I could trim years from the beginning or end of the datasets to increase the correlation on some pairs of variables. I don't do that because there are already plenty of correlations in my database without monkeying with the years.
Still, sometimes one of the variables has more years of data available than the other. This page only shows the overlapping years. To see all the years, click on "See what else correlates with..." link above.
| 2012 | 2013 | 2014 | 2015 | 2016 | 2017 | 2018 | 2019 | 2020 | 2021 | |
| Bachelor's degrees awarded in Theology and religious vocations (Degrees awarded) | 7845 | 7839 | 7865 | 7859 | 7826 | 7489 | 7252 | 7061 | 6855 | 6737 |
| Ford Motor Company's stock price (F) (Stock price) | 10.88 | 13.08 | 15.25 | 15.42 | 13.72 | 12.06 | 12.38 | 7.53 | 9.29 | 8.81 |
Why this works
- Data dredging: I have 25,153 variables in my database. I compare all these variables against each other to find ones that randomly match up. That's 632,673,409 correlation calculations! This is called “data dredging.” Instead of starting with a hypothesis and testing it, I instead abused the data to see what correlations shake out. It’s a dangerous way to go about analysis, because any sufficiently large dataset will yield strong correlations completely at random.
- Lack of causal connection: There is probably
Because these pages are automatically generated, it's possible that the two variables you are viewing are in fact causually related. I take steps to prevent the obvious ones from showing on the site (I don't let data about the weather in one city correlate with the weather in a neighboring city, for example), but sometimes they still pop up. If they are related, cool! You found a loophole.
no direct connection between these variables, despite what the AI says above. This is exacerbated by the fact that I used "Years" as the base variable. Lots of things happen in a year that are not related to each other! Most studies would use something like "one person" in stead of "one year" to be the "thing" studied. - Observations not independent: For many variables, sequential years are not independent of each other. If a population of people is continuously doing something every day, there is no reason to think they would suddenly change how they are doing that thing on January 1. A simple
Personally I don't find any p-value calculation to be 'simple,' but you know what I mean.
p-value calculation does not take this into account, so mathematically it appears less probable than it really is. - Y-axis doesn't start at zero: I truncated the Y-axes of the graph above. I also used a line graph, which makes the visual connection stand out more than it deserves.
Nothing against line graphs. They are great at telling a story when you have linear data! But visually it is deceptive because the only data is at the points on the graph, not the lines on the graph. In between each point, the data could have been doing anything. Like going for a random walk by itself!
Mathematically what I showed is true, but it is intentionally misleading. Below is the same chart but with both Y-axes starting at zero.

Try it yourself
You can calculate the values on this page on your own! Try running the Python code to see the calculation results. Step 1: Download and install Python on your computer.Step 2: Open a plaintext editor like Notepad and paste the code below into it.
Step 3: Save the file as "calculate_correlation.py" in a place you will remember, like your desktop. Copy the file location to your clipboard. On Windows, you can right-click the file and click "Properties," and then copy what comes after "Location:" As an example, on my computer the location is "C:\Users\tyler\Desktop"
Step 4: Open a command line window. For example, by pressing start and typing "cmd" and them pressing enter.
Step 5: Install the required modules by typing "pip install numpy", then pressing enter, then typing "pip install scipy", then pressing enter.
Step 6: Navigate to the location where you saved the Python file by using the "cd" command. For example, I would type "cd C:\Users\tyler\Desktop" and push enter.
Step 7: Run the Python script by typing "python calculate_correlation.py"
If you run into any issues, I suggest asking ChatGPT to walk you through installing Python and running the code below on your system. Try this question:
"Walk me through installing Python on my computer to run a script that uses scipy and numpy. Go step-by-step and ask me to confirm before moving on. Start by asking me questions about my operating system so that you know how to proceed. Assume I want the simplest installation with the latest version of Python and that I do not currently have any of the necessary elements installed. Remember to only give me one step per response and confirm I have done it before proceeding."
# These modules make it easier to perform the calculation
import numpy as np
from scipy import stats

# We'll define a function that we can call to return the correlation calculations
def calculate_correlation(array1, array2):

    # Calculate Pearson correlation coefficient and p-value
    correlation, p_value = stats.pearsonr(array1, array2)

    # Calculate R-squared as the square of the correlation coefficient
    r_squared = correlation**2

    return correlation, r_squared, p_value

# These are the arrays for the variables shown on this page, but you can modify them to be any two sets of numbers
array_1 = np.array([7845,7839,7865,7859,7826,7489,7252,7061,6855,6737,])
array_2 = np.array([10.88,13.08,15.25,15.42,13.72,12.06,12.38,7.53,9.29,8.81,])
array_1_name = "Bachelor's degrees awarded in Theology and religious vocations"
array_2_name = "Ford Motor Company's stock price (F)"

# Perform the calculation
print(f"Calculating the correlation between {array_1_name} and {array_2_name}...")
correlation, r_squared, p_value = calculate_correlation(array_1, array_2)

# Print the results
print("Correlation Coefficient:", correlation)
print("R-squared:", r_squared)
print("P-value:", p_value)
Reuseable content
You may re-use the images on this page for any purpose, even commercial purposes, without asking for permission. The only requirement is that you attribute Tyler Vigen. Attribution can take many different forms. If you leave the "tylervigen.com" link in the image, that satisfies it just fine. If you remove it and move it to a footnote, that's fine too. You can also just write "Charts courtesy of Tyler Vigen" at the bottom of an article.You do not need to attribute "the spurious correlations website," and you don't even need to link here if you don't want to. I don't gain anything from pageviews. There are no ads on this site, there is nothing for sale, and I am not for hire.
For the record, I am just one person. Tyler Vigen, he/him/his. I do have degrees, but they should not go after my name unless you want to annoy my wife. If that is your goal, then go ahead and cite me as "Tyler Vigen, A.A. A.A.S. B.A. J.D." Otherwise it is just "Tyler Vigen."
When spoken, my last name is pronounced "vegan," like I don't eat meat.
Full license details.
For more on re-use permissions, or to get a signed release form, see tylervigen.com/permission.
Download images for these variables:
- High resolution line chart
The image linked here is a Scalable Vector Graphic (SVG). It is the highest resolution that is possible to achieve. It scales up beyond the size of the observable universe without pixelating. You do not need to email me asking if I have a higher resolution image. I do not. The physical limitations of our universe prevent me from providing you with an image that is any higher resolution than this one.
If you insert it into a PowerPoint presentation (a tool well-known for managing things that are the scale of the universe), you can right-click > "Ungroup" or "Create Shape" and then edit the lines and text directly. You can also change the colors this way.
Alternatively you can use a tool like Inkscape. - High resolution line chart, optimized for mobile
- Alternative high resolution line chart
- Scatterplot
- Portable line chart (png)
- Portable line chart (png), optimized for mobile
- Line chart for only Bachelor's degrees awarded in Theology and religious vocations
- Line chart for only Ford Motor Company's stock price (F)
- AI-generated correlation image
- The spurious research paper: The Divine Drivetrain: Uncovering the Holy Grail of Theology Degrees and Ford's Stock Price
I'm grateful for your review!
Correlation ID: 2679 · Black Variable ID: 1293 · Red Variable ID: 1732

