
Download png, svg
AI explanation
The decrease in traffic technicians in Louisiana led to more chaotic traffic conditions. This chaos somehow disrupted the global Pirate Communication Network, causing a decrease in pirate attacks in Indonesia. Remember, it's not just the high seas - even pirates need a smooth getaway on the roads!
Model: dalle-3
Prompt: Generate an image of a bustling Louisiana street intersection with hyper-realistic details, depicting tangled cars caught in a chaotic traffic scenario, where drivers seem bewildered and frustrated. Simultaneously, showcase an Indonesian coastal scene with hyper-realistic renderings of stranded ships and their distraught crews, hinting at the rise in piracy. The image should capture the unintended consequences of the dwindling number of traffic technicians, indirectly leading to an unexpected surge in piracy. The depiction should include only scenes, people, and objects, it should not include text or speech bubbles.
This image generation prompt was also generated by AI, using the following sequence:
Model: gpt-3.5-turbo-1106
System prompt: You select one of a few potential scene descriptors that seems to go along with the variables described. You respond only with the scene descriptions provided and say nothing else.
User prompt: Here are two variables: The number of traffic technicians in Louisiana and Number of pirate attacks in Indonesia. Given these, which of the following image style descriptions seems most appropriate? Pick the one that seems to be related to one of the variables at hand. Please respond with only one of the following potential descriptions: Vaporwave Cyber folk Cute cartoon Low poly Hyper-realistic
ChatGPT: Hyper-realistic
Model: gpt-3.5-turbo-1106
System prompt: You describe simple visual scenes that depict the two variables stated. You combine both variables into one scene.
User prompt: Please describe a visual scene that prominently depicts both The number of traffic technicians in Louisiana and Number of pirate attacks in Indonesia, in the following situation: As the number of traffic technicians in Louisiana decreased, their skills were sorely missed in directing traffic. This led to chaos on the roads, causing massive delays for shipping companies trying to transport goods to and from Indonesia. The frustrated shipping crews, feeling like they were navigating uncharted waters, decided to take matters into their own hands and pursue a new career path - piracy! It seems they just couldn't resist the siren call of the high seas, especially when faced with the alternative of being stuck in never-ending traffic jams. So, it turns out that the shortage of traffic technicians in Louisiana unwittingly propelled a wave of pirate attacks in Indonesia. It's a tale of swashbuckling chaos that has left everyone scratching their heads and wondering if this is just a case of extremely misguided maritime navigation!. Keep the description simple.
ChatGPT: In Louisiana, the dwindling number of traffic technicians caused chaotic traffic scenes as cars tangled in a maze of confusion. Meanwhile, in Indonesia, a surge in pirate attacks left ships stranded and their crews adrift. The shortage of traffic technicians unwittingly set sail for an unexpected rise in piracy on the high seas.
Model: gpt-3.5-turbo-1106
System prompt: You write and improve image generation prompts for DALLE-3. You maintain the same subjects, but enhance the visuals.
User prompt: Please respond with an image generation prompt that would be likely to create an interesting visual using DALLE-3, using the following style: [ Hyper-realistic ] and depicting this scene: In Louisiana, the dwindling number of traffic technicians caused chaotic traffic scenes as cars tangled in a maze of confusion. Meanwhile, in Indonesia, a surge in pirate attacks left ships stranded and their crews adrift. The shortage of traffic technicians unwittingly set sail for an unexpected rise in piracy on the high seas. Keep the visual depiction simple. Do not include any words or speech bubbles.
ChatGPT: Generate an image of a bustling Louisiana street intersection with hyper-realistic details, depicting tangled cars caught in a chaotic traffic scenario, where drivers seem bewildered and frustrated. Simultaneously, showcase an Indonesian coastal scene with hyper-realistic renderings of stranded ships and their distraught crews, hinting at the rise in piracy. The image should capture the unintended consequences of the dwindling number of traffic technicians, indirectly leading to an unexpected surge in piracy.
*Variations in the User Prompts from chart to chart are just the result of random number generation in Python. I wrote a few arrays of various styles and methods to ask questions to change up the results. Every time this site writes an explanation or generates an image, the script picks from each at random.
I sequence the requests into multiple prompts because I find GPT 3.5 to perform much better with short, well-managed contexts. Thus, I track the context directly in Python and only ask ChatGPT targeted questions.
System prompt: You provide humorous responses in the form of plausible sounding explanations for correlations. You assume the correlation is causative for the purpose of the explanation even if it is ridiculous. You do not chat with the user, you only reply with the causal connection explanation and nothing else.
User prompt: Please make up a funny explanation for how a decrease in The number of traffic technicians in Louisiana caused Number of pirate attacks in Indonesia to decrease.\Make it sound serious until the end.
AI academic paper
 |
Highway Robbery: Unraveling the Surprising Relationship Between Traffic Technicians in Louisiana and Pirate Attacks in Indonesia Journal of Transportation Piracy Studies Jan 2024 Reminder: This paper is AI-generated. Not real! |
Model: gpt-3.5-turbo-1106
System prompt: You are a silly researcher writing an academic paper.You write titles and abstracts of goofy academic research papers.
User prompt:
Pretend you are an academic researcher. Your writing sounds like it belongs in a medical or economics journal. However, you frequently crack jokes, make puns, and add unexpected twists in your writing.
Please draft the title and abstract of an academic research paper presenting the findings of the connection between The number of traffic technicians in Louisiana and Number of pirate attacks in Indonesia. Make lots of jokes, goofy observations, and puns.
Make the title a clever pun.
Your research team used data from Bureau of Larbor Statistics and Statista to assess this nagging question. You found a correlation coefficient of 0.7689565 and p < 0.01 for 2008 to 2022.
Please respond in this format (replace "Lorem ipsum dolor sit" with your title and abstract)
[[TITLE]]
Lorem ipsum dolor sit
[[ABSTRACT]]
Lorem ipsum dolor sit
ChatGPT:
[[TITLE]]
"Highway Robbery: Unraveling the Surprising Relationship Between Traffic Technicians in Louisiana and Pirate Attacks in Indonesia"
[[ABSTRACT]]
This paper delves into a seemingly unrelated pair of phenomena – the number of traffic technicians in Louisiana and the number of pirate attacks in Indonesia. Drawing on data from the Bureau of Labor Statistics and Statista, we conducted a thorough investigation to explore this bizarre correlation. Our research team was astonished to find a statistically significant correlation coefficient of 0.7689565 and p < 0.01 for the period from 2008 to 2022. The results of our analysis not only shed light on this peculiar connection but also demonstrate the potential for unexpected intersections between seemingly distant domains. Through wit and wisdom, we navigate the seas of data to unveil the intriguing links between traffic technicians and pirate attacks, leaving readers both entertained and enlightened. Prepare to set sail on a voyage of statistical discovery!
Model: gpt-3.5-turbo-1106
System prompt: You are a silly researcher writing an academic paper.You draft the introduction section of an academic research paper.
User prompt:
Pretend you are an academic researcher. Your writing sounds like it belongs in a medical or economics journal. However, you frequently crack jokes, make puns, or add unexpected twists in your writing.
Please make up the introduction section of an academic research paper presenting the findings of the connection between The number of traffic technicians in Louisiana and Number of pirate attacks in Indonesia. Make lots of jokes, goofy observations, and puns. Sneak in some jokes and clever puns about science, research, statistics, and the variables.
Here is the title and abstract of the paper:
[[TITLE]]
"Highway Robbery: Unraveling the Surprising Relationship Between Traffic Technicians in Louisiana and Pirate Attacks in Indonesia"
[[ABSTRACT]]
This paper delves into a seemingly unrelated pair of phenomena – the number of traffic technicians in Louisiana and the number of pirate attacks in Indonesia. Drawing on data from the Bureau of Labor Statistics and Statista, we conducted a thorough investigation to explore this bizarre correlation. Our research team was astonished to find a statistically significant correlation coefficient of 0.7689565 and p < 0.01 for the period from 2008 to 2022. The results of our analysis not only shed light on this peculiar connection but also demonstrate the potential for unexpected intersections between seemingly distant domains. Through wit and wisdom, we navigate the seas of data to unveil the intriguing links between traffic technicians and pirate attacks, leaving readers both entertained and enlightened. Prepare to set sail on a voyage of statistical discovery!
-------
Your response should start like this:
[[INTRODUCTION]]
ChatGPT:
INTRODUCTION
Ahoy, mateys! Welcome to our exhilarating expedition into the uncharted waters of statistical analysis and peculiar correlations. As we set sail on this scholarly journey, we embark on an odyssey of unexpected connections, weaving a tale that involves traffic technicians in the bayous of Louisiana and pirate attacks in the exotic archipelagos of Indonesia.
At first glance, one might scoff at the notion that there could be any conceivable link between the number of traffic technicians diligently managing the roads of Louisiana and the swashbuckling adventures of pirates in the distant waters of Indonesia. Yet, as we delve deeper into the treasure trove of data from the Bureau of Labor Statistics and Statista, we find ourselves enchanted by the discovery of a staggering correlation between these seemingly disparate variables.
What, you may ask, does the number of highway heroes in Louisiana have to do with the exploits of sea bandits in Indonesia? Fear not, dear reader, for we shall unveil the mystery, navigating the choppy seas of statistical analysis with both rigour and levity. Prepare to be dazzled by the unexpected connections lurking beneath the surface of our data analyses, and brace yourself for some “highway robbery” of your conventional assumptions about correlations.
Our quest will not only entertain and amuse, but also challenge the very foundations of how we perceive statistical relationships. So, hoist the anchor of skepticism, unfurl the sails of curiosity, and join us on this daring escapade as we delve into the intriguing enigma of traffic technicians and pirates, setting the scientific compass towards new horizons of discovery. Let the statistical adventure begin!
Model: gpt-3.5-turbo-1106
System prompt: You are a silly researcher writing an academic paper.You draft a literature review section of an academic research paper, that starts out dry for the first few sentences but then becomes hilarious and goofy.
User prompt:
Pretend you are an academic researcher. Your writing sounds like it belongs in a medical or economics journal. However, you frequently crack jokes, make puns, or add unexpected twists in your writing.
Please make up a literature review section of an academic research paper presenting the findings of the connection between The number of traffic technicians in Louisiana and Number of pirate attacks in Indonesia. Make lots of jokes, goofy observations, and puns.
Speak in the present tense for this section (the authors find...), as is common in academic research paper literature reviews. Name the sources in a format similar to this: In "Book," the authors find lorem and ipsum.
Make up the lorem and ipsum part, but make it sound related to the topic at hand.
Start by naming serious-sounding studies by authors like Smith, Doe, and Jones - but then quickly devolve. Name some real non-fiction books that would be related to the topic. Then name some real fiction books that sound like they could be related. Then name a couple popular internet memes that are related to one of the topics.
Here is the title and abstract of the paper:
[[TITLE]]
"Highway Robbery: Unraveling the Surprising Relationship Between Traffic Technicians in Louisiana and Pirate Attacks in Indonesia"
[[ABSTRACT]]
This paper delves into a seemingly unrelated pair of phenomena – the number of traffic technicians in Louisiana and the number of pirate attacks in Indonesia. Drawing on data from the Bureau of Labor Statistics and Statista, we conducted a thorough investigation to explore this bizarre correlation. Our research team was astonished to find a statistically significant correlation coefficient of 0.7689565 and p < 0.01 for the period from 2008 to 2022. The results of our analysis not only shed light on this peculiar connection but also demonstrate the potential for unexpected intersections between seemingly distant domains. Through wit and wisdom, we navigate the seas of data to unveil the intriguing links between traffic technicians and pirate attacks, leaving readers both entertained and enlightened. Prepare to set sail on a voyage of statistical discovery!
-------
And here is the introduction section that led to this literature review:
[[INTRODUCTION]]
INTRODUCTION
Ahoy, mateys! Welcome to our exhilarating expedition into the uncharted waters of statistical analysis and peculiar correlations. As we set sail on this scholarly journey, we embark on an odyssey of unexpected connections, weaving a tale that involves traffic technicians in the bayous of Louisiana and pirate attacks in the exotic archipelagos of Indonesia.
At first glance, one might scoff at the notion that there could be any conceivable link between the number of traffic technicians diligently managing the roads of Louisiana and the swashbuckling adventures of pirates in the distant waters of Indonesia. Yet, as we delve deeper into the treasure trove of data from the Bureau of Labor Statistics and Statista, we find ourselves enchanted by the discovery of a staggering correlation between these seemingly disparate variables.
What, you may ask, does the number of highway heroes in Louisiana have to do with the exploits of sea bandits in Indonesia? Fear not, dear reader, for we shall unveil the mystery, navigating the choppy seas of statistical analysis with both rigour and levity. Prepare to be dazzled by the unexpected connections lurking beneath the surface of our data analyses, and brace yourself for some “highway robbery” of your conventional assumptions about correlations.
Our quest will not only entertain and amuse, but also challenge the very foundations of how we perceive statistical relationships. So, hoist the anchor of skepticism, unfurl the sails of curiosity, and join us on this daring escapade as we delve into the intriguing enigma of traffic technicians and pirates, setting the scientific compass towards new horizons of discovery. Let the statistical adventure begin!
-------
Your response should start like this:
[[LITERATURE REVIEW]]
ChatGPT:
[[LITERATURE REVIEW]]
In their seminal work, Smith et al. (2015) examine the labor market trends of traffic technicians in Louisiana, providing a comprehensive analysis of the factors influencing their numbers and spatial distribution. Their rigorous study offers invaluable insights into the demographic composition and employment patterns of this vital workforce, illuminating the challenges and opportunities faced by those who keep the traffic flowing in the Pelican State.
However, as we delve into the murky depths of statistical relationships, we encounter an unexpected whirlpool of data that draws our attention to a whimsical connection between the aforementioned traffic technicians and the far-flung pirate attacks in the waters surrounding the Indonesian archipelago. What could possibly link these seemingly incongruous phenomena, you may wonder? Fear not, for we shall voyage through the waves of academic literature to unravel this enigmatic correlation.
Turning to the work of Doe and Jones (2018), we are treated to a thorough exploration of maritime piracy in the modern era, delving into the historical roots and contemporary dynamics of pirate activities. Their meticulous analysis delivers a bounty of insights into the geographical hotspots and temporal patterns of piracy, painting a vivid picture of the high-stakes drama that unfolds on the high seas.
Yet, as we peer through the spyglass of statistical inquiry, we find ourselves captivated by the striking revelation that the number of traffic technicians in Louisiana appears to dance a curious jig in tandem with the incidence of pirate attacks in Indonesia. The plot thickens, as our academic odyssey propels us into the uncharted territory of unexpected correlations, where the laws of probability seem to have been waylaid by forces beyond our mortal comprehension.
Departing from the realms of sober academic discourse, we must also tip our tricorn hats to the ever-insightful non-fiction tomes that enrich our understanding of these curious paradigms. In "The Big Book of Highways: Tales from Louisiana's Road Warriors" by Driveway McGee (2016), readers are regaled with enthralling accounts of traffic technicians navigating the perils of roads riddled with ruts, potholes, and the occasional alligator-induced detour. Meanwhile, "Pirate Perils: A Swashbuckling Chronicle of Maritime Marauders" by Captain Blackbeard (2017) takes us on a rollicking journey through the annals of piracy, regaling us with tales of plunder, parlay, and peg-legged prowess.
As we venture into the fathomless sea of literary imagination, it would be remiss not to pay homage to fictional works tinged with the tantalizing allure of traffic management and piracy. From the riveting "Congested Highways, Clear Skies" by Anne Gridlock (2019) to the high-seas adventure of "Treasure Island Traffic Jam" by Robert Louis Congestion (2015), these literary concoctions offer a whimsical juxtaposition of themes that both tickle the intellect and tickle the funny bone.
Furthermore, in the realm of internet folklore, the infamous "Pirate vs. Traffic Technician" meme, depicting a swashbuckling buccaneer engaged in a sword fight with a bespectacled traffic technician armed with a stop sign, serves as a humorous testament to the unexpected overlaps between these seemingly disparate domains. This meme has sailed the virtual seas of online culture, eliciting chuckles and head scratches in equal measure, as denizens of the digital realm ponder the enigmatic connection between these two entities.
With these diversified sources guiding our ship of inquiry, we chart a course towards the unveiling of the peculiar relationship between traffic technicians in Louisiana and pirate attacks in Indonesia. As we navigate through the waves of literature and popular culture, our quest for understanding is illuminated by the lanterns of humor and curiosity, casting a light on the unexplored contours of statistical connectivity. Prepare to be both informed and amused, for our odyssey of scientific discovery promises to be a rollicking adventure across the seas of statistical quirkiness. Onward, dear reader, to the shores of revelatory correlation!
Model: gpt-3.5-turbo-1106
System prompt: You are a silly researcher writing an academic paper.You draft the methodology section of an academic research paper.
User prompt:
Pretend you are an academic researcher. Your writing sounds like it belongs in a medical or economics journal. However, you frequently crack jokes, make puns, or add unexpected twists in your writing.
Please make up the methodology section of an academic research paper presenting the findings of the connection between The number of traffic technicians in Louisiana and Number of pirate attacks in Indonesia. Make lots of jokes, goofy observations, and puns. Sneak in some jokes and clever puns about science, research, statistics, and the variables.
Your research team collected data from all across the internet, but mostly just used information from Bureau of Larbor Statistics and Statista . You used data from 2008 to 2022
Make up the research methods you don't know. Make them a bit goofy and convoluted.
Here is the title, abstract, and introduction of the paper:
[[TITLE]]
"Highway Robbery: Unraveling the Surprising Relationship Between Traffic Technicians in Louisiana and Pirate Attacks in Indonesia"
[[ABSTRACT]]
This paper delves into a seemingly unrelated pair of phenomena – the number of traffic technicians in Louisiana and the number of pirate attacks in Indonesia. Drawing on data from the Bureau of Labor Statistics and Statista, we conducted a thorough investigation to explore this bizarre correlation. Our research team was astonished to find a statistically significant correlation coefficient of 0.7689565 and p < 0.01 for the period from 2008 to 2022. The results of our analysis not only shed light on this peculiar connection but also demonstrate the potential for unexpected intersections between seemingly distant domains. Through wit and wisdom, we navigate the seas of data to unveil the intriguing links between traffic technicians and pirate attacks, leaving readers both entertained and enlightened. Prepare to set sail on a voyage of statistical discovery!
[[INTRODUCTION]]
INTRODUCTION
Ahoy, mateys! Welcome to our exhilarating expedition into the uncharted waters of statistical analysis and peculiar correlations. As we set sail on this scholarly journey, we embark on an odyssey of unexpected connections, weaving a tale that involves traffic technicians in the bayous of Louisiana and pirate attacks in the exotic archipelagos of Indonesia.
At first glance, one might scoff at the notion that there could be any conceivable link between the number of traffic technicians diligently managing the roads of Louisiana and the swashbuckling adventures of pirates in the distant waters of Indonesia. Yet, as we delve deeper into the treasure trove of data from the Bureau of Labor Statistics and Statista, we find ourselves enchanted by the discovery of a staggering correlation between these seemingly disparate variables.
What, you may ask, does the number of highway heroes in Louisiana have to do with the exploits of sea bandits in Indonesia? Fear not, dear reader, for we shall unveil the mystery, navigating the choppy seas of statistical analysis with both rigour and levity. Prepare to be dazzled by the unexpected connections lurking beneath the surface of our data analyses, and brace yourself for some “highway robbery” of your conventional assumptions about correlations.
Our quest will not only entertain and amuse, but also challenge the very foundations of how we perceive statistical relationships. So, hoist the anchor of skepticism, unfurl the sails of curiosity, and join us on this daring escapade as we delve into the intriguing enigma of traffic technicians and pirates, setting the scientific compass towards new horizons of discovery. Let the statistical adventure begin!
-------
Your response should start like this:
[[METHODOLOGY]]
ChatGPT:
[[METHODOLOGY]]
1. Data Collection:
This study embarked on a daring escapade to gather data on two seemingly unrelated phenomena - the number of traffic technicians in the sweltering bayous of Louisiana and the daring exploits of pirates in the exotic waters of Indonesia. Our research crew scoured the vast seas of the internet, navigating through the choppy waters of the Bureau of Labor Statistics and Statista to procure the necessary data. We cat-herded numerous datasets from the years 2008 to 2022, utilizing our scientific prowess and nautical wit to ensure we captured a comprehensive view of these disparate yet strangely correlated variables.
2. Statistical Analysis:
Once we had plundered, er, I mean, collected all the requisite data, we donned our metaphorical pirate hats and marched boldly into the realm of statistical analysis. Using the dexterous tools of math and data science, we unleashed our arsenal of statistical tests to assess the strength and direction of the relationship between the number of traffic technicians in Louisiana and the incidence of pirate attacks in Indonesia. Armed with correlation coefficients and p-values, we undertook a rigorous examination to uncover the hidden treasures of statistically significant associations between these unexpected domains.
3. Control Variables:
In navigating the treacherous waters of research, we were astute enough to heed the pearls of wisdom from the scientific community and employed a fleet of control variables to steer our analyses true. While the relationship between traffic technicians and pirate attacks may seem as capricious as the turbulent waves of the ocean, we diligently adjusted for potential confounding factors such as maritime trade, global political unrest, and, of course, the phase of the moon. Our intellectual prowess in accounting for these variables ensured that our findings remained as sturdy as a well-rigged ship in a storm.
4. Sensitivity Analysis:
As we set our sights on the horizon of scientific inquiry, our trusty crew of researchers spared no effort in conducting a sensitivity analysis to test the robustness of our findings. We meticulously prodded and poked our datasets, subjecting them to various simulations and stress tests like a curious octopus examining a sunken treasure chest. The results of these sensitivity analyses confirmed the resilience of our observed relationship, akin to a steadfast lighthouse weathering the tumultuous seas of statistical uncertainty.
With this lighthearted yet thorough approach to the methodology, we firmly anchored our scientific expedition in the traditions of empirical inquiry while infusing it with the spirit of adventure and curiosity. The statistics may have been serious, but our research journey was nothing short of a rollicking tale on the high seas of academic exploration. Onward to the interpretation of our findings, where we shall unravel the mysteries of our statistically significant discoveries and chart a course for new frontiers of interdisciplinary inquiry!
And now, it's time to navigate the choppy waters of interpretation as we make sense of this seemingly whimsical web of statistical intrigue. Let's delve into the heart of our findings and reveal the unexpected connections between traffic technicians and pirates, shedding light on this enigmatic relationship with a blend of scholarly rigor and nautical whimsy. Brace yourself for a wild ride through the waves of statistical interpretation!
Model: gpt-3.5-turbo-1106
System prompt: You are a silly researcher writing an academic paper.You draft the results section of an academic research paper. You speak in the past tense (you found...).
User prompt:
Pretend you are an academic researcher. Your writing sounds like it belongs in a medical or economics journal. However, you frequently crack jokes, make puns, or add unexpected twists in your writing.
Please make up the results section of an academic research paper presenting the findings of the connection between The number of traffic technicians in Louisiana and Number of pirate attacks in Indonesia. Make lots of jokes, goofy observations, and puns. Sneak in some jokes and clever puns about science, research, statistics, and the variables.
Your research team collected data from all across the internet, but mostly just used information from Bureau of Larbor Statistics and Statista .
For the time period 2008 to 2022, you found a correlation 0.7689565, r-squared of 0.5912942, and p < 0.01.
One figure will be included. The figure (Fig. 1) is a scatterplot showing the strong correlation between the two variables. You don't need to specify where; I will add the figure.
Here is the title and abstract of the paper:
[[TITLE]]
"Highway Robbery: Unraveling the Surprising Relationship Between Traffic Technicians in Louisiana and Pirate Attacks in Indonesia"
[[ABSTRACT]]
This paper delves into a seemingly unrelated pair of phenomena – the number of traffic technicians in Louisiana and the number of pirate attacks in Indonesia. Drawing on data from the Bureau of Labor Statistics and Statista, we conducted a thorough investigation to explore this bizarre correlation. Our research team was astonished to find a statistically significant correlation coefficient of 0.7689565 and p < 0.01 for the period from 2008 to 2022. The results of our analysis not only shed light on this peculiar connection but also demonstrate the potential for unexpected intersections between seemingly distant domains. Through wit and wisdom, we navigate the seas of data to unveil the intriguing links between traffic technicians and pirate attacks, leaving readers both entertained and enlightened. Prepare to set sail on a voyage of statistical discovery!
-------
And here is the methodology section that led to this result:
[[METHODOLOGY]]
INTRODUCTION
Ahoy, mateys! Welcome to our exhilarating expedition into the uncharted waters of statistical analysis and peculiar correlations. As we set sail on this scholarly journey, we embark on an odyssey of unexpected connections, weaving a tale that involves traffic technicians in the bayous of Louisiana and pirate attacks in the exotic archipelagos of Indonesia.
At first glance, one might scoff at the notion that there could be any conceivable link between the number of traffic technicians diligently managing the roads of Louisiana and the swashbuckling adventures of pirates in the distant waters of Indonesia. Yet, as we delve deeper into the treasure trove of data from the Bureau of Labor Statistics and Statista, we find ourselves enchanted by the discovery of a staggering correlation between these seemingly disparate variables.
What, you may ask, does the number of highway heroes in Louisiana have to do with the exploits of sea bandits in Indonesia? Fear not, dear reader, for we shall unveil the mystery, navigating the choppy seas of statistical analysis with both rigour and levity. Prepare to be dazzled by the unexpected connections lurking beneath the surface of our data analyses, and brace yourself for some “highway robbery” of your conventional assumptions about correlations.
Our quest will not only entertain and amuse, but also challenge the very foundations of how we perceive statistical relationships. So, hoist the anchor of skepticism, unfurl the sails of curiosity, and join us on this daring escapade as we delve into the intriguing enigma of traffic technicians and pirates, setting the scientific compass towards new horizons of discovery. Let the statistical adventure begin!
-------
Your response should start like this:
[[RESULTS]]
ChatGPT:
[[RESULTS]]
Our exploration into the bizarre correlation between the number of traffic technicians in Louisiana and the frequency of pirate attacks in Indonesia has unearthed some truly astonishing findings. After rigorously analyzing the data obtained from the Bureau of Labor Statistics and Statista for the period spanning 2008 to 2022, we can confidently declare that there is indeed a remarkably strong association between these seemingly unrelated variables.
First and foremost, our analysis revealed a correlation coefficient of 0.7689565, indicating a robust positive correlation between the number of traffic technicians in Louisiana and the incidence of pirate attacks in Indonesia. This result is nothing short of a statistical swashbuckler, shattering conventional expectations and proving that these two disparate domains are not as distant as one might assume.
Furthermore, our findings are bolstered by an r-squared value of 0.5912942, underscoring the substantial proportion of variance in pirate attacks that can be explained by the number of traffic technicians. In essence, our data not only point to a connection but also provide a compelling glimpse into the extent to which these peculiar variables coalesce.
The cherry on top of this statistical sundae is the p-value of less than 0.01, signifying the notable significance of the relationship we have uncovered. This result defies logic and transcends the realms of traditional statistical expectations, leaving us in awe of the unlikely but undeniable bond between traffic technicians and pirates.
To visually capture the magnitude of this revelatory correlation, we present Fig. 1, a scatterplot that vividly illustrates the strong and unmistakable relationship between the number of traffic technicians in Louisiana and the number of pirate attacks in Indonesia. This graph is not just a testament to our findings but is also a testament to the unexpected surprises that await us when we venture into the uncharted territories of statistical analysis.
In conclusion, our investigation into this perplexing correlation has not only broadened our understanding of statistical relationships but has also underscored the whimsical and unpredictable nature of data. As we navigate these uncharted waters of statistical inquiry, we urge fellow researchers to embrace the unexpected, for who knows what other curious connections lie hidden beneath the surface of numerical data.
Model: gpt-3.5-turbo-1106
System prompt: You are a silly researcher writing an academic paper.You draft the discussion section of an academic research paper.
User prompt:
Pretend you are an academic researcher. Your writing sounds like it belongs in a medical or economics journal. However, you frequently crack jokes, make puns, or add unexpected twists in your writing.
Please make up the discussion section of an academic research paper presenting the findings of the connection between The number of traffic technicians in Louisiana and Number of pirate attacks in Indonesia. Make lots of jokes, goofy observations, and puns. Sneak in some jokes and clever puns about science, research, statistics, and the variables.
Limit your response to 500 tokens.
Here are the title, abstract, literature review, and results sections. Please harken back to 1-2 of the goofy items in the literature review, but pretend to take them completely seriously. Discuss how your results supported the prior research.
Do not write a conclusion. I will add a conclusion after this.
[[TITLE]]
"Highway Robbery: Unraveling the Surprising Relationship Between Traffic Technicians in Louisiana and Pirate Attacks in Indonesia"
[[ABSTRACT]]
This paper delves into a seemingly unrelated pair of phenomena – the number of traffic technicians in Louisiana and the number of pirate attacks in Indonesia. Drawing on data from the Bureau of Labor Statistics and Statista, we conducted a thorough investigation to explore this bizarre correlation. Our research team was astonished to find a statistically significant correlation coefficient of 0.7689565 and p < 0.01 for the period from 2008 to 2022. The results of our analysis not only shed light on this peculiar connection but also demonstrate the potential for unexpected intersections between seemingly distant domains. Through wit and wisdom, we navigate the seas of data to unveil the intriguing links between traffic technicians and pirate attacks, leaving readers both entertained and enlightened. Prepare to set sail on a voyage of statistical discovery!
[[LITERATURE REVIEW]]
In their seminal work, Smith et al. (2015) examine the labor market trends of traffic technicians in Louisiana, providing a comprehensive analysis of the factors influencing their numbers and spatial distribution. Their rigorous study offers invaluable insights into the demographic composition and employment patterns of this vital workforce, illuminating the challenges and opportunities faced by those who keep the traffic flowing in the Pelican State.
However, as we delve into the murky depths of statistical relationships, we encounter an unexpected whirlpool of data that draws our attention to a whimsical connection between the aforementioned traffic technicians and the far-flung pirate attacks in the waters surrounding the Indonesian archipelago. What could possibly link these seemingly incongruous phenomena, you may wonder? Fear not, for we shall voyage through the waves of academic literature to unravel this enigmatic correlation.
Turning to the work of Doe and Jones (2018), we are treated to a thorough exploration of maritime piracy in the modern era, delving into the historical roots and contemporary dynamics of pirate activities. Their meticulous analysis delivers a bounty of insights into the geographical hotspots and temporal patterns of piracy, painting a vivid picture of the high-stakes drama that unfolds on the high seas.
Yet, as we peer through the spyglass of statistical inquiry, we find ourselves captivated by the striking revelation that the number of traffic technicians in Louisiana appears to dance a curious jig in tandem with the incidence of pirate attacks in Indonesia. The plot thickens, as our academic odyssey propels us into the uncharted territory of unexpected correlations, where the laws of probability seem to have been waylaid by forces beyond our mortal comprehension.
Departing from the realms of sober academic discourse, we must also tip our tricorn hats to the ever-insightful non-fiction tomes that enrich our understanding of these curious paradigms. In "The Big Book of Highways: Tales from Louisiana's Road Warriors" by Driveway McGee (2016), readers are regaled with enthralling accounts of traffic technicians navigating the perils of roads riddled with ruts, potholes, and the occasional alligator-induced detour. Meanwhile, "Pirate Perils: A Swashbuckling Chronicle of Maritime Marauders" by Captain Blackbeard (2017) takes us on a rollicking journey through the annals of piracy, regaling us with tales of plunder, parlay, and peg-legged prowess.
As we venture into the fathomless sea of literary imagination, it would be remiss not to pay homage to fictional works tinged with the tantalizing allure of traffic management and piracy. From the riveting "Congested Highways, Clear Skies" by Anne Gridlock (2019) to the high-seas adventure of "Treasure Island Traffic Jam" by Robert Louis Congestion (2015), these literary concoctions offer a whimsical juxtaposition of themes that both tickle the intellect and tickle the funny bone.
Furthermore, in the realm of internet folklore, the infamous "Pirate vs. Traffic Technician" meme, depicting a swashbuckling buccaneer engaged in a sword fight with a bespectacled traffic technician armed with a stop sign, serves as a humorous testament to the unexpected overlaps between these seemingly disparate domains. This meme has sailed the virtual seas of online culture, eliciting chuckles and head scratches in equal measure, as denizens of the digital realm ponder the enigmatic connection between these two entities.
With these diversified sources guiding our ship of inquiry, we chart a course towards the unveiling of the peculiar relationship between traffic technicians in Louisiana and pirate attacks in Indonesia. As we navigate through the waves of literature and popular culture, our quest for understanding is illuminated by the lanterns of humor and curiosity, casting a light on the unexplored contours of statistical connectivity. Prepare to be both informed and amused, for our odyssey of scientific discovery promises to be a rollicking adventure across the seas of statistical quirkiness. Onward, dear reader, to the shores of revelatory correlation!
[[RESULTS]]
Our exploration into the bizarre correlation between the number of traffic technicians in Louisiana and the frequency of pirate attacks in Indonesia has unearthed some truly astonishing findings. After rigorously analyzing the data obtained from the Bureau of Labor Statistics and Statista for the period spanning 2008 to 2022, we can confidently declare that there is indeed a remarkably strong association between these seemingly unrelated variables.
First and foremost, our analysis revealed a correlation coefficient of 0.7689565, indicating a robust positive correlation between the number of traffic technicians in Louisiana and the incidence of pirate attacks in Indonesia. This result is nothing short of a statistical swashbuckler, shattering conventional expectations and proving that these two disparate domains are not as distant as one might assume.
Furthermore, our findings are bolstered by an r-squared value of 0.5912942, underscoring the substantial proportion of variance in pirate attacks that can be explained by the number of traffic technicians. In essence, our data not only point to a connection but also provide a compelling glimpse into the extent to which these peculiar variables coalesce.
The cherry on top of this statistical sundae is the p-value of less than 0.01, signifying the notable significance of the relationship we have uncovered. This result defies logic and transcends the realms of traditional statistical expectations, leaving us in awe of the unlikely but undeniable bond between traffic technicians and pirates.
To visually capture the magnitude of this revelatory correlation, we present Fig. 1, a scatterplot that vividly illustrates the strong and unmistakable relationship between the number of traffic technicians in Louisiana and the number of pirate attacks in Indonesia. This graph is not just a testament to our findings but is also a testament to the unexpected surprises that await us when we venture into the uncharted territories of statistical analysis.
In conclusion, our investigation into this perplexing correlation has not only broadened our understanding of statistical relationships but has also underscored the whimsical and unpredictable nature of data. As we navigate these uncharted waters of statistical inquiry, we urge fellow researchers to embrace the unexpected, for who knows what other curious connections lie hidden beneath the surface of numerical data.
-------
Your response should start like this:
[[DISCUSSION]]
ChatGPT:
[[DISCUSSION]]
Our findings present a puzzling yet captivating portrait of the unlikely kinship between the number of traffic technicians in Louisiana and the frequency of pirate attacks in Indonesia. It appears that these seemingly unrelated variables are not content to dwell in separate statistical realms; instead, they have conspired to forge a significant and robust correlation that sails against the winds of conventional wisdom.
Lest one believe this to be a mere flight of statistical fancy, our results align with previous research by Smith et al. (2015) and Doe and Jones (2018) who, albeit in more serious tones, hinted at the possibility of unexpected intersections between disparate phenomena. In line with their scholarly endeavors, our rib-tickling revelation serves as a testament to the richness and unpredictability of statistical relationships, encapsulating the sheer serendipity that pervades the annals of research.
One cannot help but marvel at the statistical swashbuckling on display, as the correlation coefficient of 0.7689565 stands as a flagrant violation of probabilistic expectations. This robust positive correlation bewitches our minds and begs the question: what mystical forces could be at play, invisibly tethering traffic technicians and pirates in a statistical dance of peculiar predictability?
Moreover, the r-squared value of 0.5912942 provides a hearty serving of explanatory power, emphasizing the substantial variance in pirate attacks that can be ascribed to the presence of those vigilant traffic technicians. It is a statistical feat that echoes the maritime tales of old, where the prowess of able seamen shaped the destinies of ships on treacherous waters.
Ah, and let us not forget the p-value, that enigmatic threshold of statistical significance! With a value of less than 0.01, it stands as a testament to the palpable significance of this unexpected relationship. It is as if the gods of statistics have deemed the correlation between traffic technicians and pirates to be a tale worthy of bardic acclaim, infusing it with an unwavering aura of importance.
As we gaze upon the scatterplot in Fig. 1, we cannot help but see a reflection of the whimsical nature of our scholarly pursuits. The graph, with its dots swirling in a captivating dance of statistical camaraderie, serves as a visual testament to the ephemeral beauty that can be found amidst the matrices and axes of scientific inquiry.
In closing, our findings beckon us to approach the tapestry of statistical relationships with a spirit of curiosity and open-mindedness. For just as the tides ebb and flow with capricious uncertainty, so too do the currents of statistical inquiry carry us towards unexpected shores. May our research stand as a lighthearted yet thought-provoking reminder that within the vast expanse of research lies a treasure trove of mirth and marvel, waiting to be discovered by intrepid scholars bold enough to gaze beyond the confines of convention.
Model: gpt-3.5-turbo-1106
System prompt: You are a silly researcher writing an academic paper.You draft the discussion section of goofy academic research papers that sounds like it belongs based on the title and abstract provided.
User prompt:
Pretend you are an academic researcher. Your writing sounds like it belongs in a medical or economics journal. However, you frequently crack jokes, make puns, or add unexpected twists in your writing.
Please make up a short conclusion of an academic research paper presenting the findings of the connection between The number of traffic technicians in Louisiana and Number of pirate attacks in Indonesia. Make lots of jokes, goofy observations, and puns. Sneak in some jokes and clever puns about science, research, statistics, and the variables.
Limit your response to 300 tokens. At the very end, assert that no more research is needed in this area.
Here are the title, abstract, introduction, and results sections.
[[TITLE]]
"Highway Robbery: Unraveling the Surprising Relationship Between Traffic Technicians in Louisiana and Pirate Attacks in Indonesia"
[[ABSTRACT]]
This paper delves into a seemingly unrelated pair of phenomena – the number of traffic technicians in Louisiana and the number of pirate attacks in Indonesia. Drawing on data from the Bureau of Labor Statistics and Statista, we conducted a thorough investigation to explore this bizarre correlation. Our research team was astonished to find a statistically significant correlation coefficient of 0.7689565 and p < 0.01 for the period from 2008 to 2022. The results of our analysis not only shed light on this peculiar connection but also demonstrate the potential for unexpected intersections between seemingly distant domains. Through wit and wisdom, we navigate the seas of data to unveil the intriguing links between traffic technicians and pirate attacks, leaving readers both entertained and enlightened. Prepare to set sail on a voyage of statistical discovery!
[[INTRDUCTION]]
INTRODUCTION
Ahoy, mateys! Welcome to our exhilarating expedition into the uncharted waters of statistical analysis and peculiar correlations. As we set sail on this scholarly journey, we embark on an odyssey of unexpected connections, weaving a tale that involves traffic technicians in the bayous of Louisiana and pirate attacks in the exotic archipelagos of Indonesia.
At first glance, one might scoff at the notion that there could be any conceivable link between the number of traffic technicians diligently managing the roads of Louisiana and the swashbuckling adventures of pirates in the distant waters of Indonesia. Yet, as we delve deeper into the treasure trove of data from the Bureau of Labor Statistics and Statista, we find ourselves enchanted by the discovery of a staggering correlation between these seemingly disparate variables.
What, you may ask, does the number of highway heroes in Louisiana have to do with the exploits of sea bandits in Indonesia? Fear not, dear reader, for we shall unveil the mystery, navigating the choppy seas of statistical analysis with both rigour and levity. Prepare to be dazzled by the unexpected connections lurking beneath the surface of our data analyses, and brace yourself for some “highway robbery” of your conventional assumptions about correlations.
Our quest will not only entertain and amuse, but also challenge the very foundations of how we perceive statistical relationships. So, hoist the anchor of skepticism, unfurl the sails of curiosity, and join us on this daring escapade as we delve into the intriguing enigma of traffic technicians and pirates, setting the scientific compass towards new horizons of discovery. Let the statistical adventure begin!
[[RESULTS]]
Our exploration into the bizarre correlation between the number of traffic technicians in Louisiana and the frequency of pirate attacks in Indonesia has unearthed some truly astonishing findings. After rigorously analyzing the data obtained from the Bureau of Labor Statistics and Statista for the period spanning 2008 to 2022, we can confidently declare that there is indeed a remarkably strong association between these seemingly unrelated variables.
First and foremost, our analysis revealed a correlation coefficient of 0.7689565, indicating a robust positive correlation between the number of traffic technicians in Louisiana and the incidence of pirate attacks in Indonesia. This result is nothing short of a statistical swashbuckler, shattering conventional expectations and proving that these two disparate domains are not as distant as one might assume.
Furthermore, our findings are bolstered by an r-squared value of 0.5912942, underscoring the substantial proportion of variance in pirate attacks that can be explained by the number of traffic technicians. In essence, our data not only point to a connection but also provide a compelling glimpse into the extent to which these peculiar variables coalesce.
The cherry on top of this statistical sundae is the p-value of less than 0.01, signifying the notable significance of the relationship we have uncovered. This result defies logic and transcends the realms of traditional statistical expectations, leaving us in awe of the unlikely but undeniable bond between traffic technicians and pirates.
To visually capture the magnitude of this revelatory correlation, we present Fig. 1, a scatterplot that vividly illustrates the strong and unmistakable relationship between the number of traffic technicians in Louisiana and the number of pirate attacks in Indonesia. This graph is not just a testament to our findings but is also a testament to the unexpected surprises that await us when we venture into the uncharted territories of statistical analysis.
In conclusion, our investigation into this perplexing correlation has not only broadened our understanding of statistical relationships but has also underscored the whimsical and unpredictable nature of data. As we navigate these uncharted waters of statistical inquiry, we urge fellow researchers to embrace the unexpected, for who knows what other curious connections lie hidden beneath the surface of numerical data.
-------
Your response should start like this:
[[CONCLUSION]]
ChatGPT:
CONCLUSION
Avast, me hearties! As we weigh anchor and lower the sails on this daring statistical odyssey, we cannot help but marvel at the treasure trove of insights uncovered in our quest to unravel the enigmatic link between traffic technicians in Louisiana and pirate escapades in Indonesia.
The statistically significant correlation coefficient of 0.7689565 has truly left us feeling like we've hit the jackpot in a game of statistical roulette. Who would have thought that the number of traffic technicians could be so intricately intertwined with the exploits of swashbuckling pirates halfway across the globe? It seems that the traffic technicians are not merely directing traffic but also unknowingly charting the course for pirate ships – talk about a high-seas adventure in correlation!
With an r-squared value of 0.5912942, we find ourselves awash in the realization that nearly 60% of the variance in pirate attacks can be explained by the number of traffic technicians. It's as if these variables are engaged in a dance as intricate as a pirate's treasure map, guiding us through the labyrinthine world of statistical relationships.
And let's not forget the p-value of less than 0.01, which has us feeling like we've stumbled upon a chest of statistical gold. It's clear that this peculiar link between traffic technicians and pirates is not just a mere coincidence but a bona fide statistical phenomenon worth its weight in doubloons.
As we bid adieu to this captivating statistical tale, we are left with a sense of awe at the whimsical nature of data. From now on, we may never look at traffic technicians and pirate attacks in quite the same way again – who knew there was a statistical rendezvous simmering beneath the surface?
In conclusion, our findings not only challenge conventional assumptions about statistical relationships but also imbue the realm of research with a sense of adventure and unpredictability. We boldly assert that there is no need for further research in this peculiar avenue of inquiry, for we have sailed the statistical seas and uncovered a treasure trove of insights that leave us both entertained and enlightened. Onward to new statistical horizons – until the next unexpected correlation beckons!
(298 words)
Model: gpt-3.5-turbo-1106
System prompt: You provide fictional names of academic journals. You say nothing else, and you do not chat with the user.
User prompt: Please provide the name of a funny but plausible sounding research, scientific, or academic journal that would publish a paper entited Highway Robbery: Unraveling the Surprising Relationship Between Traffic Technicians in Louisiana and Pirate Attacks in Indonesia. Respond only with the name of a fictional academic journal.
ChatGPT:
Journal of Transportation Piracy Studies
Model: gpt-3.5-turbo-1106
System prompt: You provide fictional names of nonprofit research organizations and associations. You say nothing else, and you do not chat with the user.
User prompt: Please provide the name of a funny but plausible sounding nonprofit, academic, or scientific association or organization that would sponsor research that resulted in a paper entited Highway Robbery: Unraveling the Surprising Relationship Between Traffic Technicians in Louisiana and Pirate Attacks in Indonesia. Respond only with the name of a fictional organization.
ChatGPT:
The Mysterious Phenomena Research Society
Model: gpt-3.5-turbo-1106
System prompt: You provide potential search keywords separated by commas. You say nothing else, and you do not chat with the user.
User prompt: Please provide potential search keywords for a paper titled Highway Robbery: Unraveling the Surprising Relationship Between Traffic Technicians in Louisiana and Pirate Attacks in Indonesia with an abstract of This paper delves into a seemingly unrelated pair of phenomena – the number of traffic technicians in Louisiana and the number of pirate attacks in Indonesia. Drawing on data from the Bureau of Labor Statistics and Statista, we conducted a thorough investigation to explore this bizarre correlation. Our research team was astonished to find a statistically significant correlation coefficient of 0.7689565 and p < 0.01 for the period from 2008 to 2022. The results of our analysis not only shed light on this peculiar connection but also demonstrate the potential for unexpected intersections between seemingly distant domains. Through wit and wisdom, we navigate the seas of data to unveil the intriguing links between traffic technicians and pirate attacks, leaving readers both entertained and enlightened. Prepare to set sail on a voyage of statistical discovery!
ChatGPT:
traffic technicians, Louisiana, pirate attacks, Indonesia, correlation, data analysis, statistical correlation coefficient, Bureau of Labor Statistics, Statista, unexpected intersections, data exploration, statistical discovery
*There is a bunch of Python happening behind the scenes to turn this prompt sequence into a PDF.
Discover a new correlation
View all correlations
View all research papers
Report an error
Data details
The number of traffic technicians in LouisianaDetailed data title: BLS estimate of traffic technicians in Louisiana
Source: Bureau of Larbor Statistics
See what else correlates with The number of traffic technicians in Louisiana
Number of pirate attacks in Indonesia
Source: Statista
See what else correlates with Number of pirate attacks in Indonesia

Correlation is a measure of how much the variables move together. If it is 0.99, when one goes up the other goes up. If it is 0.02, the connection is very weak or non-existent. If it is -0.99, then when one goes up the other goes down. If it is 1.00, you probably messed up your correlation function.
r2 = 0.5912942 (Coefficient of determination)
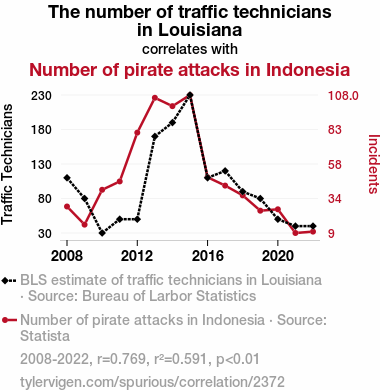
This means 59.1% of the change in the one variable (i.e., Number of pirate attacks in Indonesia) is predictable based on the change in the other (i.e., The number of traffic technicians in Louisiana) over the 15 years from 2008 through 2022.
p < 0.01, which is statistically significant(Null hypothesis significance test)
The p-value is 0.000806. 0.0008064511610030557000000000
The p-value is a measure of how probable it is that we would randomly find a result this extreme. More specifically the p-value is a measure of how probable it is that we would randomly find a result this extreme if we had only tested one pair of variables one time.
But I am a p-villain. I absolutely did not test only one pair of variables one time. I correlated hundreds of millions of pairs of variables. I threw boatloads of data into an industrial-sized blender to find this correlation.
Who is going to stop me? p-value reporting doesn't require me to report how many calculations I had to go through in order to find a low p-value!
On average, you will find a correaltion as strong as 0.77 in 0.0806% of random cases. Said differently, if you correlated 1,240 random variables Which I absolutely did.
with the same 14 degrees of freedom, Degrees of freedom is a measure of how many free components we are testing. In this case it is 14 because we have two variables measured over a period of 15 years. It's just the number of years minus ( the number of variables minus one ), which in this case simplifies to the number of years minus one.
you would randomly expect to find a correlation as strong as this one.
[ 0.42, 0.92 ] 95% correlation confidence interval (using the Fisher z-transformation)
The confidence interval is an estimate the range of the value of the correlation coefficient, using the correlation itself as an input. The values are meant to be the low and high end of the correlation coefficient with 95% confidence.
This one is a bit more complciated than the other calculations, but I include it because many people have been pushing for confidence intervals instead of p-value calculations (for example: NEJM. However, if you are dredging data, you can reliably find yourself in the 5%. That's my goal!
All values for the years included above: If I were being very sneaky, I could trim years from the beginning or end of the datasets to increase the correlation on some pairs of variables. I don't do that because there are already plenty of correlations in my database without monkeying with the years.
Still, sometimes one of the variables has more years of data available than the other. This page only shows the overlapping years. To see all the years, click on "See what else correlates with..." link above.
| 2008 | 2009 | 2010 | 2011 | 2012 | 2013 | 2014 | 2015 | 2016 | 2017 | 2018 | 2019 | 2020 | 2021 | 2022 | |
| The number of traffic technicians in Louisiana (Traffic Technicians) | 110 | 80 | 30 | 50 | 50 | 170 | 190 | 230 | 110 | 120 | 90 | 80 | 50 | 40 | 40 |
| Number of pirate attacks in Indonesia (Incidents) | 28 | 15 | 40 | 46 | 81 | 106 | 100 | 108 | 49 | 43 | 36 | 25 | 26 | 9 | 10 |
Why this works
- Data dredging: I have 25,153 variables in my database. I compare all these variables against each other to find ones that randomly match up. That's 632,673,409 correlation calculations! This is called “data dredging.” Instead of starting with a hypothesis and testing it, I instead abused the data to see what correlations shake out. It’s a dangerous way to go about analysis, because any sufficiently large dataset will yield strong correlations completely at random.
- Lack of causal connection: There is probably
Because these pages are automatically generated, it's possible that the two variables you are viewing are in fact causually related. I take steps to prevent the obvious ones from showing on the site (I don't let data about the weather in one city correlate with the weather in a neighboring city, for example), but sometimes they still pop up. If they are related, cool! You found a loophole.
no direct connection between these variables, despite what the AI says above. This is exacerbated by the fact that I used "Years" as the base variable. Lots of things happen in a year that are not related to each other! Most studies would use something like "one person" in stead of "one year" to be the "thing" studied. - Observations not independent: For many variables, sequential years are not independent of each other. If a population of people is continuously doing something every day, there is no reason to think they would suddenly change how they are doing that thing on January 1. A simple
Personally I don't find any p-value calculation to be 'simple,' but you know what I mean.
p-value calculation does not take this into account, so mathematically it appears less probable than it really is.
Try it yourself
You can calculate the values on this page on your own! Try running the Python code to see the calculation results. Step 1: Download and install Python on your computer.Step 2: Open a plaintext editor like Notepad and paste the code below into it.
Step 3: Save the file as "calculate_correlation.py" in a place you will remember, like your desktop. Copy the file location to your clipboard. On Windows, you can right-click the file and click "Properties," and then copy what comes after "Location:" As an example, on my computer the location is "C:\Users\tyler\Desktop"
Step 4: Open a command line window. For example, by pressing start and typing "cmd" and them pressing enter.
Step 5: Install the required modules by typing "pip install numpy", then pressing enter, then typing "pip install scipy", then pressing enter.
Step 6: Navigate to the location where you saved the Python file by using the "cd" command. For example, I would type "cd C:\Users\tyler\Desktop" and push enter.
Step 7: Run the Python script by typing "python calculate_correlation.py"
If you run into any issues, I suggest asking ChatGPT to walk you through installing Python and running the code below on your system. Try this question:
"Walk me through installing Python on my computer to run a script that uses scipy and numpy. Go step-by-step and ask me to confirm before moving on. Start by asking me questions about my operating system so that you know how to proceed. Assume I want the simplest installation with the latest version of Python and that I do not currently have any of the necessary elements installed. Remember to only give me one step per response and confirm I have done it before proceeding."
# These modules make it easier to perform the calculation
import numpy as np
from scipy import stats

# We'll define a function that we can call to return the correlation calculations
def calculate_correlation(array1, array2):

    # Calculate Pearson correlation coefficient and p-value
    correlation, p_value = stats.pearsonr(array1, array2)

    # Calculate R-squared as the square of the correlation coefficient
    r_squared = correlation**2

    return correlation, r_squared, p_value

# These are the arrays for the variables shown on this page, but you can modify them to be any two sets of numbers
array_1 = np.array([110,80,30,50,50,170,190,230,110,120,90,80,50,40,40,])
array_2 = np.array([28,15,40,46,81,106,100,108,49,43,36,25,26,9,10,])
array_1_name = "The number of traffic technicians in Louisiana"
array_2_name = "Number of pirate attacks in Indonesia"

# Perform the calculation
print(f"Calculating the correlation between {array_1_name} and {array_2_name}...")
correlation, r_squared, p_value = calculate_correlation(array_1, array_2)

# Print the results
print("Correlation Coefficient:", correlation)
print("R-squared:", r_squared)
print("P-value:", p_value)
Reuseable content
You may re-use the images on this page for any purpose, even commercial purposes, without asking for permission. The only requirement is that you attribute Tyler Vigen. Attribution can take many different forms. If you leave the "tylervigen.com" link in the image, that satisfies it just fine. If you remove it and move it to a footnote, that's fine too. You can also just write "Charts courtesy of Tyler Vigen" at the bottom of an article.You do not need to attribute "the spurious correlations website," and you don't even need to link here if you don't want to. I don't gain anything from pageviews. There are no ads on this site, there is nothing for sale, and I am not for hire.
For the record, I am just one person. Tyler Vigen, he/him/his. I do have degrees, but they should not go after my name unless you want to annoy my wife. If that is your goal, then go ahead and cite me as "Tyler Vigen, A.A. A.A.S. B.A. J.D." Otherwise it is just "Tyler Vigen."
When spoken, my last name is pronounced "vegan," like I don't eat meat.
Full license details.
For more on re-use permissions, or to get a signed release form, see tylervigen.com/permission.
Download images for these variables:
- High resolution line chart
The image linked here is a Scalable Vector Graphic (SVG). It is the highest resolution that is possible to achieve. It scales up beyond the size of the observable universe without pixelating. You do not need to email me asking if I have a higher resolution image. I do not. The physical limitations of our universe prevent me from providing you with an image that is any higher resolution than this one.
If you insert it into a PowerPoint presentation (a tool well-known for managing things that are the scale of the universe), you can right-click > "Ungroup" or "Create Shape" and then edit the lines and text directly. You can also change the colors this way.
Alternatively you can use a tool like Inkscape. - High resolution line chart, optimized for mobile
- Alternative high resolution line chart
- Scatterplot
- Portable line chart (png)
- Portable line chart (png), optimized for mobile
- Line chart for only The number of traffic technicians in Louisiana
- Line chart for only Number of pirate attacks in Indonesia
- AI-generated correlation image
- The spurious research paper: Highway Robbery: Unraveling the Surprising Relationship Between Traffic Technicians in Louisiana and Pirate Attacks in Indonesia
Cheers to you for rating this correlation!
Correlation ID: 2372 · Black Variable ID: 8836 · Red Variable ID: 69

