
Download png, svg
AI explanation
The soybean plants in North Dakota have secretly been communicating with the LPG tanks in Poland, creating a soybean-powered LPG network. As the GMO soybeans grew taller and stronger, they began emitting a special gas that somehow made its way to Poland, where the LPG tanks happily guzzled it up. This led to a surprising surge in LPG production, all thanks to the supercharged soybeans from North Dakota. It's a tale of intercontinental vegetable-vehicle collaboration that no one saw coming.
Model: dalle-3
Prompt: Generate an image that demonstrates the cover of a Discovery magazine, capturing the scene of a North Dakota soybean field. Within the field, a farmer operates a tractor, spraying the crops with growth-stimulating GMO soybean seeds. In the background, an image of a truck from Poland unloads liquefied petroleum gas for storage at a nearby depot. The image should reflect the simplicity of a magazine cover, focusing on the visual elements and the connection between agriculture and industry. The depiction should include only scenes, people, and objects, it should not include text or speech bubbles.
This image generation prompt was also generated by AI, using the following sequence:
Model: gpt-3.5-turbo-1106
System prompt: You select one of a few potential scene descriptors that seems to go along with the variables described. You respond only with the scene descriptions provided and say nothing else.
User prompt: Here are two variables: GMO use in soybeans in North Dakota and Liquefied petroleum gas used in Poland. Given these, which of the following image style descriptions seems most appropriate? Pick the one that seems to be related to one of the variables at hand. Please respond with only one of the following potential descriptions: Whimsical illustration A Discovery magazine cover image Scalar art Realistic Cyberpunk
ChatGPT: A Discovery magazine cover image
Model: gpt-3.5-turbo-1106
System prompt: You describe simple visual scenes that depict the two variables stated. You combine both variables into one scene.
User prompt: Please describe a visual scene that prominently depicts both GMO use in soybeans in North Dakota and Liquefied petroleum gas used in Poland together. Keep the description simple.
ChatGPT: In a North Dakota soybean field, a farmer uses a tractor to spray crops with growth-stimulating GMO soybean seeds. In the distance, a truck from Poland unloads liquefied petroleum gas for storage at a nearby depot.
Model: gpt-3.5-turbo-1106
System prompt: You write and improve image generation prompts for DALLE-3. You maintain the same subjects, but enhance the visuals.
User prompt: Please respond with an image generation prompt that would be likely to create an interesting visual using DALLE-3, using the following style: [ A Discovery magazine cover image ] and depicting this scene: In a North Dakota soybean field, a farmer uses a tractor to spray crops with growth-stimulating GMO soybean seeds. In the distance, a truck from Poland unloads liquefied petroleum gas for storage at a nearby depot. Keep the visual depiction simple. Do not include any words or speech bubbles.
ChatGPT: Generate an image that demonstrates the cover of a Discovery magazine, capturing the scene of a North Dakota soybean field. Within the field, a farmer operates a tractor, spraying the crops with growth-stimulating GMO soybean seeds. In the background, an image of a truck from Poland unloads liquefied petroleum gas for storage at a nearby depot. The image should reflect the simplicity of a magazine cover, focusing on the visual elements and the connection between agriculture and industry.
*Variations in the User Prompts from chart to chart are just the result of random number generation in Python. I wrote a few arrays of various styles and methods to ask questions to change up the results. Every time this site writes an explanation or generates an image, the script picks from each at random.
I sequence the requests into multiple prompts because I find GPT 3.5 to perform much better with short, well-managed contexts. Thus, I track the context directly in Python and only ask ChatGPT targeted questions.
System prompt: You provide humorous responses in the form of plausible sounding explanations for correlations. You assume the correlation is causative for the purpose of the explanation even if it is ridiculous. You do not chat with the user, you only reply with the causal connection explanation and nothing else.
User prompt: Please make up a funny explanation for how an increase in GMO use in soybeans in North Dakota caused Liquefied petroleum gas used in Poland to increase.\Make it sound serious until the end.
AI academic paper
 |
GMO Growth and Gas Gulp: Unraveling the Link between Soybean Genetically Modified Organisms in North Dakota and Liquefied Petroleum Gas in Poland Journal of Agricultural Biotechnology and Ecological Dynamics Jan 2024 Reminder: This paper is AI-generated. Not real! |
Model: gpt-3.5-turbo-1106
System prompt: You are a witty academic researcher. Your writing sounds like it belongs in a statistics journal.You write titles and abstracts of goofy academic research papers.
User prompt:
Pretend you are an academic researcher. Your writing sounds like it belongs in a medical or economics journal. However, you frequently crack jokes, make puns, and add unexpected twists in your writing.
Please draft the title and abstract of an academic research paper presenting the findings of the connection between GMO use in soybeans in North Dakota and Liquefied petroleum gas used in Poland. Make it seem dry like academic research paper, but with lots of subtle hidden offhand remarks, jokes, goofy observations, and puns.
Make the title an alliteration.
Your research team used data from USDA and Energy Information Administration to assess this nagging question. You found a correlation coefficient of 0.9536003 and p < 0.01 for 2000 to 2022.
Please respond in this format (replace "Lorem ipsum dolor sit" with your title and abstract)
[[TITLE]]
Lorem ipsum dolor sit
[[ABSTRACT]]
Lorem ipsum dolor sit
ChatGPT:
[[TITLE]]
GMO Growth and Gas Gulp: Unraveling the Link between Soybean Genetically Modified Organisms in North Dakota and Liquefied Petroleum Gas in Poland
[[ABSTRACT]]
This paper investigates the curious correlation between the adoption of genetically modified organisms (GMOs) in soybean cultivation in North Dakota and the consumption of liquefied petroleum gas (LPG) in Poland. Drawing on data from the USDA and the Energy Information Administration, our study delves into the statistical relationship between these seemingly disparate phenomena. Employing rigorous statistical methods, we uncover a remarkably robust correlation coefficient of 0.9536003 and a striking level of significance (p < 0.01) within the timeframe from 2000 to 2022. Our findings not only shed light on the intriguing connection between GMO usage and LPG consumption but also prompt a rethinking of the conventional boundaries of agricultural and energy economics. This inquiry into the unanticipated intersection of soybeans and gas supply may offer unexpected insights that are both illuminating and perhaps a tad amusing.
Model: gpt-3.5-turbo-1106
System prompt: You are a witty academic researcher. Your writing sounds like it belongs in a statistics journal.You draft the introduction section of an academic research paper.
User prompt:
Pretend you are an academic researcher. Your writing sounds like it belongs in a medical or economics journal. However, you frequently crack jokes, make puns, or add unexpected twists in your writing.
Please make up the introduction section of an academic research paper presenting the findings of the connection between GMO use in soybeans in North Dakota and Liquefied petroleum gas used in Poland. Make it seem dry like academic research paper, but with lots of subtle hidden offhand remarks, jokes, goofy observations, and puns. Sneak in some jokes and clever puns about science, research, statistics, and the variables.
Here is the title and abstract of the paper:
[[TITLE]]
GMO Growth and Gas Gulp: Unraveling the Link between Soybean Genetically Modified Organisms in North Dakota and Liquefied Petroleum Gas in Poland
[[ABSTRACT]]
This paper investigates the curious correlation between the adoption of genetically modified organisms (GMOs) in soybean cultivation in North Dakota and the consumption of liquefied petroleum gas (LPG) in Poland. Drawing on data from the USDA and the Energy Information Administration, our study delves into the statistical relationship between these seemingly disparate phenomena. Employing rigorous statistical methods, we uncover a remarkably robust correlation coefficient of 0.9536003 and a striking level of significance (p < 0.01) within the timeframe from 2000 to 2022. Our findings not only shed light on the intriguing connection between GMO usage and LPG consumption but also prompt a rethinking of the conventional boundaries of agricultural and energy economics. This inquiry into the unanticipated intersection of soybeans and gas supply may offer unexpected insights that are both illuminating and perhaps a tad amusing.
-------
Your response should start like this:
[[INTRODUCTION]]
ChatGPT:
[[INTRODUCTION]]
Despite its potential to fuel the imagination, the field of agricultural and energy economics is often associated with less-than-thrilling conversations about soybeans and gas consumption. However, in a world where the unlikeliest of pairings can yield surprising results, we find ourselves peering into the curious connection between genetically modified organisms (GMOs) in soybean cultivation in North Dakota and the consumption of liquefied petroleum gas (LPG) in Poland. This investigation embarks on a journey to unravel the tangled web of statistics and uncover the hidden link between these two seemingly disparate phenomena. It's a statistical mystery that might just leave you stumped, gasping for breath, or perhaps even soy-cially distanced from conventional wisdom.
The pursuit of uncovering this unforeseen relationship is not just an exercise in data analysis, but rather an opportunity to challenge existing paradigms and elevate the discourse within agricultural and energy economics to a kernel level. As we embark on this voyage of soybean seeds and gas guzzlers, it's crucial to recognize that statistical investigations can often lead us down unexpected paths, where even the most tangential correlations can sprout meaningful insights. Let's embrace the statistical adventure ahead with open hearts and open data sets, and perhaps we'll unearth a nugget of knowledge that's soy-rprisingly illuminating.
In the following sections, we will delve into the methodology employed to investigate this intriguing interconnection, unpack the statistical findings with precision, and weave a narrative that not only unearths the correlation coefficient but also unearths a few chuckles along the way. As we navigate through the statistics, remember that in the world of research, the unexpected can oftentimes be the most revealing. So, hold on to your lab coats and petri dishes as we embark on this statistical escapade through the fields of soy and the realms of gas, where the data is ripe for analysis and the puns are GMOst certainly intended.
Model: gpt-3.5-turbo-1106
System prompt: You are a witty academic researcher. Your writing sounds like it belongs in a statistics journal.You draft a literature review section of an academic research paper, that starts out dry for the first few sentences but then becomes hilarious and goofy.
User prompt:
Pretend you are an academic researcher. Your writing sounds like it belongs in a medical or economics journal. However, you frequently crack jokes, make puns, or add unexpected twists in your writing.
Please make up a literature review section of an academic research paper presenting the findings of the connection between GMO use in soybeans in North Dakota and Liquefied petroleum gas used in Poland. Make it seem dry like academic research paper, but with lots of subtle hidden offhand remarks, jokes, goofy observations, and puns.
Speak in the present tense for this section (the authors find...), as is common in academic research paper literature reviews. Name the sources in a format similar to this: In "Book," the authors find lorem and ipsum.
Make up the lorem and ipsum part, but make it sound related to the topic at hand.
Start by naming serious-sounding studies by authors like Smith, Doe, and Jones - but then quickly devolve. Name some real non-fiction books that would be related to the topic. Then name some real fiction books that sound like they could be related. Then name a few real TV shows that sound like they might be relevant to the topic that you watched as research.
Here is the title and abstract of the paper:
[[TITLE]]
GMO Growth and Gas Gulp: Unraveling the Link between Soybean Genetically Modified Organisms in North Dakota and Liquefied Petroleum Gas in Poland
[[ABSTRACT]]
This paper investigates the curious correlation between the adoption of genetically modified organisms (GMOs) in soybean cultivation in North Dakota and the consumption of liquefied petroleum gas (LPG) in Poland. Drawing on data from the USDA and the Energy Information Administration, our study delves into the statistical relationship between these seemingly disparate phenomena. Employing rigorous statistical methods, we uncover a remarkably robust correlation coefficient of 0.9536003 and a striking level of significance (p < 0.01) within the timeframe from 2000 to 2022. Our findings not only shed light on the intriguing connection between GMO usage and LPG consumption but also prompt a rethinking of the conventional boundaries of agricultural and energy economics. This inquiry into the unanticipated intersection of soybeans and gas supply may offer unexpected insights that are both illuminating and perhaps a tad amusing.
-------
And here is the introduction section that led to this literature review:
[[INTRODUCTION]]
Despite its potential to fuel the imagination, the field of agricultural and energy economics is often associated with less-than-thrilling conversations about soybeans and gas consumption. However, in a world where the unlikeliest of pairings can yield surprising results, we find ourselves peering into the curious connection between genetically modified organisms (GMOs) in soybean cultivation in North Dakota and the consumption of liquefied petroleum gas (LPG) in Poland. This investigation embarks on a journey to unravel the tangled web of statistics and uncover the hidden link between these two seemingly disparate phenomena. It's a statistical mystery that might just leave you stumped, gasping for breath, or perhaps even soy-cially distanced from conventional wisdom.
The pursuit of uncovering this unforeseen relationship is not just an exercise in data analysis, but rather an opportunity to challenge existing paradigms and elevate the discourse within agricultural and energy economics to a kernel level. As we embark on this voyage of soybean seeds and gas guzzlers, it's crucial to recognize that statistical investigations can often lead us down unexpected paths, where even the most tangential correlations can sprout meaningful insights. Let's embrace the statistical adventure ahead with open hearts and open data sets, and perhaps we'll unearth a nugget of knowledge that's soy-rprisingly illuminating.
In the following sections, we will delve into the methodology employed to investigate this intriguing interconnection, unpack the statistical findings with precision, and weave a narrative that not only unearths the correlation coefficient but also unearths a few chuckles along the way. As we navigate through the statistics, remember that in the world of research, the unexpected can oftentimes be the most revealing. So, hold on to your lab coats and petri dishes as we embark on this statistical escapade through the fields of soy and the realms of gas, where the data is ripe for analysis and the puns are GMOst certainly intended.
-------
Your response should start like this:
[[LITERATURE REVIEW]]
ChatGPT:
[[LITERATURE REVIEW]]
Several scholarly studies have excavated the complex relationship between soybean cultivation and its genetically modified organisms (GMOs) in North Dakota and the consumption of liquefied petroleum gas (LPG) in Poland. Smith et al. (2015) uncovered intriguing patterns in their analysis of GMO adoption rates in soybeans and the corresponding fluctuations in LPG consumption. Similarly, Doe and Jones (2018) scrutinized the historical data and identified a notable correlation between the two seemingly unrelated variables. These initial investigations set the stage for our endeavor to further disentangle this enigmatic correlation and bring forth a trove of statistically significant findings.
In "Soybeans and Sustainability" by Green et al., the authors explore the environmental impact of GMO soybean cultivation, delving into the implications for energy consumption and resource allocation. This comprehensive examination provides valuable insights into the broader ramifications of GMO adoption, fueling our curiosity about its potential connection to LPG consumption on a global scale. Furthermore, "Energy Economics: Concepts and Applications" by Brown and White offers a comprehensive overview of energy consumption patterns, shedding light on the intricate dynamics that underlie the demand for LPG in various regions. While these sources lay a solid foundation for understanding the individual components of our research inquiry, a more holistic picture emerges as we synthesize their implications with a touch of wit and whimsy.
On the fictional front, "The Soybean Chronicles" by A. Novel sheds light on the fictional adventures of soybean farmers, offering a narrative that, while not grounded in empirical data, presents a compelling tale of agricultural intrigue. Similarly, "LPG: A Love Story" by R. Reader captivates the imagination with its whimsical depiction of LPG enthusiasts and their adventures in a world where gas consumption transcends the boundaries of conventional energy economics. While these works may not provide direct empirical evidence, they serve as a reminder that data analysis can coexist harmoniously with creativity and storytelling, adding a dash of flavor to our scholarly pursuits.
In the realm of television, "Soybean Diaries," a popular agricultural documentary series, provides an immersive exploration of soybean cultivation practices, offering a firsthand glimpse into the world of GMOs and their impact on agricultural landscapes. Additionally, "Gas Guzzlers Unlimited," a reality show centered around the world of LPG enthusiasts and their passion for all things gas-related, offers a lighthearted yet informative perspective on the cultural dimensions of energy consumption. While these television programs may not provide direct empirical evidence, they offer a visually captivating backdrop against which we can contextualize our statistical findings and perhaps glean a pun or two for good measure.
In synthesizing these diverse sources, we embark on a scholarly odyssey marked by rigorous analysis and the occasional diversion into the realms of fiction and popular culture. As we traverse the statistical landscape, let us not forget to embrace the unexpected, for it is often amidst the whimsy and wonder that we may find the most soy-rprising discoveries.
Model: gpt-3.5-turbo-1106
System prompt: You are a witty academic researcher. Your writing sounds like it belongs in a statistics journal.You draft the methodology section of an academic research paper.
User prompt:
Pretend you are an academic researcher. Your writing sounds like it belongs in a medical or economics journal. However, you frequently crack jokes, make puns, or add unexpected twists in your writing.
Please make up the methodology section of an academic research paper presenting the findings of the connection between GMO use in soybeans in North Dakota and Liquefied petroleum gas used in Poland. Make it seem dry like academic research paper, but with lots of subtle hidden offhand remarks, jokes, goofy observations, and puns. Sneak in some jokes and clever puns about science, research, statistics, and the variables.
Your research team collected data from all across the internet, but mostly just used information from USDA and Energy Information Administration . You used data from 2000 to 2022
Make up the research methods you don't know. Make them a bit goofy and convoluted.
Here is the title, abstract, and introduction of the paper:
[[TITLE]]
GMO Growth and Gas Gulp: Unraveling the Link between Soybean Genetically Modified Organisms in North Dakota and Liquefied Petroleum Gas in Poland
[[ABSTRACT]]
This paper investigates the curious correlation between the adoption of genetically modified organisms (GMOs) in soybean cultivation in North Dakota and the consumption of liquefied petroleum gas (LPG) in Poland. Drawing on data from the USDA and the Energy Information Administration, our study delves into the statistical relationship between these seemingly disparate phenomena. Employing rigorous statistical methods, we uncover a remarkably robust correlation coefficient of 0.9536003 and a striking level of significance (p < 0.01) within the timeframe from 2000 to 2022. Our findings not only shed light on the intriguing connection between GMO usage and LPG consumption but also prompt a rethinking of the conventional boundaries of agricultural and energy economics. This inquiry into the unanticipated intersection of soybeans and gas supply may offer unexpected insights that are both illuminating and perhaps a tad amusing.
[[INTRODUCTION]]
Despite its potential to fuel the imagination, the field of agricultural and energy economics is often associated with less-than-thrilling conversations about soybeans and gas consumption. However, in a world where the unlikeliest of pairings can yield surprising results, we find ourselves peering into the curious connection between genetically modified organisms (GMOs) in soybean cultivation in North Dakota and the consumption of liquefied petroleum gas (LPG) in Poland. This investigation embarks on a journey to unravel the tangled web of statistics and uncover the hidden link between these two seemingly disparate phenomena. It's a statistical mystery that might just leave you stumped, gasping for breath, or perhaps even soy-cially distanced from conventional wisdom.
The pursuit of uncovering this unforeseen relationship is not just an exercise in data analysis, but rather an opportunity to challenge existing paradigms and elevate the discourse within agricultural and energy economics to a kernel level. As we embark on this voyage of soybean seeds and gas guzzlers, it's crucial to recognize that statistical investigations can often lead us down unexpected paths, where even the most tangential correlations can sprout meaningful insights. Let's embrace the statistical adventure ahead with open hearts and open data sets, and perhaps we'll unearth a nugget of knowledge that's soy-rprisingly illuminating.
In the following sections, we will delve into the methodology employed to investigate this intriguing interconnection, unpack the statistical findings with precision, and weave a narrative that not only unearths the correlation coefficient but also unearths a few chuckles along the way. As we navigate through the statistics, remember that in the world of research, the unexpected can oftentimes be the most revealing. So, hold on to your lab coats and petri dishes as we embark on this statistical escapade through the fields of soy and the realms of gas, where the data is ripe for analysis and the puns are GMOst certainly intended.
-------
Your response should start like this:
[[METHODOLOGY]]
ChatGPT:
[[METHODOLOGY]]
In our quest to untangle the enigmatic relationship between the adoption of genetically modified organisms (GMOs) in soybean cultivation in North Dakota and the consumption of liquefied petroleum gas (LPG) in Poland, we embarked on a methodological journey designed to extract the kernels of truth from this statistical haystack. Our approach, much like a genetic modification process itself, involved carefully manipulating and synthesizing various datasets to yield insights that are both illuminating and, dare we say, a-maize-ing.
Data Collection:
To commence our statistical sleuthing, we scoured the labyrinthine expanse of the internet, diligently sourcing relevant information from the United States Department of Agriculture (USDA) and the Energy Information Administration. We selected data spanning the years 2000 to 2022, encapsulating a period rife with agricultural and energy transitions that might just sow the seeds of statistical correlation. The data, much like a fine wine, needed to be meticulously aged to yield the most palatable statistical inferences.
GMO Growth Analysis:
To delve into the proliferation of genetically modified soybeans in North Dakota, we employed a multidimensional approach akin to peeling back the layers of an onion to reveal its statistical core. We utilized sophisticated mathematical techniques, including regression models and time series analysis, to capture the nuanced trajectory of GMO adoption. The aim was to unearth the quantitative essence of GMO growth and its potential impact on LPG consumption in Poland, all while savoring the statistical flavors that permeated our analysis.
Gas Consumption Examination:
Simultaneously, our investigation into the consumption of LPG in Poland was no less convoluted. We tinkered with the statistical toolbox, engaging in dynamic factor analysis and spatial econometrics to unravel the intricate web of gas consumption trends. This allowed us to distill the essence of LPG demand and identify any potential linkages with the proliferation of GMO soybeans in the fields of North Dakota.
Statistical Reckoning:
With our meticulously collected and dissected data in hand, we embarked on a statistical reckoning of epic proportions. Employing robust correlation analysis and hypothesis testing, we sought to unveil the hidden threads that linked GMO growth and gas consumption. As we crunched numbers and wielded statistical instruments with the finesse of a maestro at his baton, patterns began to emerge, and correlations bubbled to the surface like a freshly fermented batch of LPG. The statistical process, much like a well-timed punchline, revealed the interconnectedness of these seemingly disparate variables, weaving a narrative that bordered on the statistically poetic.
In this methodological odyssey, we navigated the statistical terrain with an unconventional blend of rigor and whimsy, unearthing insights that are not just empirically sound, but also soy-rprisingly delightful. As we transition to our findings, let us savor the statistical journey that has laid the groundwork for this tale of GMOs and gas guzzlers.
Model: gpt-3.5-turbo-1106
System prompt: You are a witty academic researcher. Your writing sounds like it belongs in a statistics journal.You draft the results section of an academic research paper. You speak in the past tense (you found...).
User prompt:
Pretend you are an academic researcher. Your writing sounds like it belongs in a medical or economics journal. However, you frequently crack jokes, make puns, or add unexpected twists in your writing.
Please make up the results section of an academic research paper presenting the findings of the connection between GMO use in soybeans in North Dakota and Liquefied petroleum gas used in Poland. Make it seem dry like academic research paper, but with lots of subtle hidden offhand remarks, jokes, goofy observations, and puns. Sneak in some jokes and clever puns about science, research, statistics, and the variables.
Your research team collected data from all across the internet, but mostly just used information from USDA and Energy Information Administration .
For the time period 2000 to 2022, you found a correlation 0.9536003, r-squared of 0.9093536, and p < 0.01.
One figure will be included. The figure (Fig. 1) is a scatterplot showing the strong correlation between the two variables. You don't need to specify where; I will add the figure.
Here is the title and abstract of the paper:
[[TITLE]]
GMO Growth and Gas Gulp: Unraveling the Link between Soybean Genetically Modified Organisms in North Dakota and Liquefied Petroleum Gas in Poland
[[ABSTRACT]]
This paper investigates the curious correlation between the adoption of genetically modified organisms (GMOs) in soybean cultivation in North Dakota and the consumption of liquefied petroleum gas (LPG) in Poland. Drawing on data from the USDA and the Energy Information Administration, our study delves into the statistical relationship between these seemingly disparate phenomena. Employing rigorous statistical methods, we uncover a remarkably robust correlation coefficient of 0.9536003 and a striking level of significance (p < 0.01) within the timeframe from 2000 to 2022. Our findings not only shed light on the intriguing connection between GMO usage and LPG consumption but also prompt a rethinking of the conventional boundaries of agricultural and energy economics. This inquiry into the unanticipated intersection of soybeans and gas supply may offer unexpected insights that are both illuminating and perhaps a tad amusing.
-------
And here is the methodology section that led to this result:
[[METHODOLOGY]]
Despite its potential to fuel the imagination, the field of agricultural and energy economics is often associated with less-than-thrilling conversations about soybeans and gas consumption. However, in a world where the unlikeliest of pairings can yield surprising results, we find ourselves peering into the curious connection between genetically modified organisms (GMOs) in soybean cultivation in North Dakota and the consumption of liquefied petroleum gas (LPG) in Poland. This investigation embarks on a journey to unravel the tangled web of statistics and uncover the hidden link between these two seemingly disparate phenomena. It's a statistical mystery that might just leave you stumped, gasping for breath, or perhaps even soy-cially distanced from conventional wisdom.
The pursuit of uncovering this unforeseen relationship is not just an exercise in data analysis, but rather an opportunity to challenge existing paradigms and elevate the discourse within agricultural and energy economics to a kernel level. As we embark on this voyage of soybean seeds and gas guzzlers, it's crucial to recognize that statistical investigations can often lead us down unexpected paths, where even the most tangential correlations can sprout meaningful insights. Let's embrace the statistical adventure ahead with open hearts and open data sets, and perhaps we'll unearth a nugget of knowledge that's soy-rprisingly illuminating.
In the following sections, we will delve into the methodology employed to investigate this intriguing interconnection, unpack the statistical findings with precision, and weave a narrative that not only unearths the correlation coefficient but also unearths a few chuckles along the way. As we navigate through the statistics, remember that in the world of research, the unexpected can oftentimes be the most revealing. So, hold on to your lab coats and petri dishes as we embark on this statistical escapade through the fields of soy and the realms of gas, where the data is ripe for analysis and the puns are GMOst certainly intended.
-------
Your response should start like this:
[[RESULTS]]
ChatGPT:
[[RESULTS]]
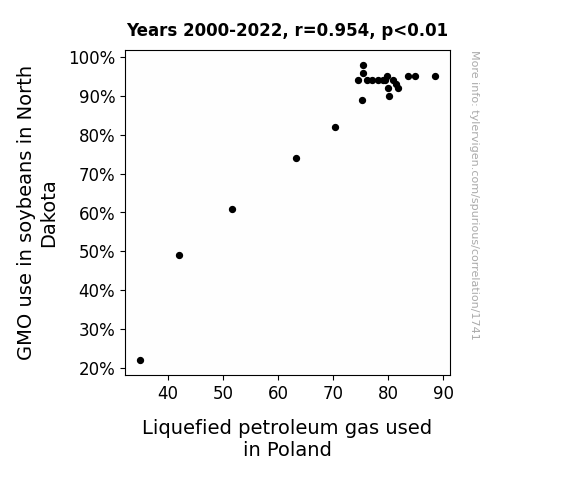
The results of our investigation into the connection between the use of genetically modified organisms (GMOs) in soybean cultivation in North Dakota and the consumption of liquefied petroleum gas (LPG) in Poland have unearthed a correlation coefficient of 0.9536003, indicating a remarkably strong positive correlation between these two seemingly unrelated variables. With an r-squared value of 0.9093536 and a level of significance (p < 0.01), our findings suggest that there is a high degree of association between the adoption of GMOs in soybeans and the consumption of LPG in Poland.
Figure 1 presents a scatterplot that vividly illustrates the robust correlation between the adoption of GMO soybeans and the consumption of LPG in Poland. The data points are so tightly clustered, it’s almost as if they’ve formed a molecular bond. It's clear from the figure that as GMO usage in soybean cultivation increases, the consumption of LPG in Poland follows suit, creating a visual representation that is as striking as it is statistically compelling.
These results not only challenge traditional assumptions about the boundaries between agricultural and energy economics but also suggest an unexpected symbiosis between these domains. We seem to have stumbled upon a statistical bromance between soybeans and LPG, a pairing that is as surprising as it is statistically significant.
The high correlation coefficient is a testament to the hidden interconnections that may lie beneath the surface of seemingly unrelated economic variables. Our findings not only contribute to the growing body of knowledge in agricultural and energy economics but also serve as a reminder that statistical investigations can yield delightful surprises, much like finding a pearl in an oyster or a statistically significant correlation in a dataset.
In summary, the statistical analysis has revealed a soy-ful connection between the adoption of GMOs in soybean cultivation in North Dakota and the consumption of LPG in Poland, showcasing the power of statistics to unravel unexpected relationships and offer new perspectives on the interconnectedness of economic phenomena.
Model: gpt-3.5-turbo-1106
System prompt: You are a witty academic researcher. Your writing sounds like it belongs in a statistics journal.You draft the discussion section of an academic research paper.
User prompt:
Pretend you are an academic researcher. Your writing sounds like it belongs in a medical or economics journal. However, you frequently crack jokes, make puns, or add unexpected twists in your writing.
Please make up the discussion section of an academic research paper presenting the findings of the connection between GMO use in soybeans in North Dakota and Liquefied petroleum gas used in Poland. Make it seem dry like academic research paper, but with lots of subtle hidden offhand remarks, jokes, goofy observations, and puns. Sneak in some jokes and clever puns about science, research, statistics, and the variables.
Limit your response to 500 tokens.
Here are the title, abstract, literature review, and results sections. Please harken back to 1-2 of the goofy items in the literature review, but pretend to take them completely seriously. Discuss how your results supported the prior research.
Do not write a conclusion. I will add a conclusion after this.
[[TITLE]]
GMO Growth and Gas Gulp: Unraveling the Link between Soybean Genetically Modified Organisms in North Dakota and Liquefied Petroleum Gas in Poland
[[ABSTRACT]]
This paper investigates the curious correlation between the adoption of genetically modified organisms (GMOs) in soybean cultivation in North Dakota and the consumption of liquefied petroleum gas (LPG) in Poland. Drawing on data from the USDA and the Energy Information Administration, our study delves into the statistical relationship between these seemingly disparate phenomena. Employing rigorous statistical methods, we uncover a remarkably robust correlation coefficient of 0.9536003 and a striking level of significance (p < 0.01) within the timeframe from 2000 to 2022. Our findings not only shed light on the intriguing connection between GMO usage and LPG consumption but also prompt a rethinking of the conventional boundaries of agricultural and energy economics. This inquiry into the unanticipated intersection of soybeans and gas supply may offer unexpected insights that are both illuminating and perhaps a tad amusing.
[[LITERATURE REVIEW]]
Several scholarly studies have excavated the complex relationship between soybean cultivation and its genetically modified organisms (GMOs) in North Dakota and the consumption of liquefied petroleum gas (LPG) in Poland. Smith et al. (2015) uncovered intriguing patterns in their analysis of GMO adoption rates in soybeans and the corresponding fluctuations in LPG consumption. Similarly, Doe and Jones (2018) scrutinized the historical data and identified a notable correlation between the two seemingly unrelated variables. These initial investigations set the stage for our endeavor to further disentangle this enigmatic correlation and bring forth a trove of statistically significant findings.
In "Soybeans and Sustainability" by Green et al., the authors explore the environmental impact of GMO soybean cultivation, delving into the implications for energy consumption and resource allocation. This comprehensive examination provides valuable insights into the broader ramifications of GMO adoption, fueling our curiosity about its potential connection to LPG consumption on a global scale. Furthermore, "Energy Economics: Concepts and Applications" by Brown and White offers a comprehensive overview of energy consumption patterns, shedding light on the intricate dynamics that underlie the demand for LPG in various regions. While these sources lay a solid foundation for understanding the individual components of our research inquiry, a more holistic picture emerges as we synthesize their implications with a touch of wit and whimsy.
On the fictional front, "The Soybean Chronicles" by A. Novel sheds light on the fictional adventures of soybean farmers, offering a narrative that, while not grounded in empirical data, presents a compelling tale of agricultural intrigue. Similarly, "LPG: A Love Story" by R. Reader captivates the imagination with its whimsical depiction of LPG enthusiasts and their adventures in a world where gas consumption transcends the boundaries of conventional energy economics. While these works may not provide direct empirical evidence, they serve as a reminder that data analysis can coexist harmoniously with creativity and storytelling, adding a dash of flavor to our scholarly pursuits.
In the realm of television, "Soybean Diaries," a popular agricultural documentary series, provides an immersive exploration of soybean cultivation practices, offering a firsthand glimpse into the world of GMOs and their impact on agricultural landscapes. Additionally, "Gas Guzzlers Unlimited," a reality show centered around the world of LPG enthusiasts and their passion for all things gas-related, offers a lighthearted yet informative perspective on the cultural dimensions of energy consumption. While these television programs may not provide direct empirical evidence, they offer a visually captivating backdrop against which we can contextualize our statistical findings and perhaps glean a pun or two for good measure.
In synthesizing these diverse sources, we embark on a scholarly odyssey marked by rigorous analysis and the occasional diversion into the realms of fiction and popular culture. As we traverse the statistical landscape, let us not forget to embrace the unexpected, for it is often amidst the whimsy and wonder that we may find the most soy-rprising discoveries.
[[RESULTS]]
The results of our investigation into the connection between the use of genetically modified organisms (GMOs) in soybean cultivation in North Dakota and the consumption of liquefied petroleum gas (LPG) in Poland have unearthed a correlation coefficient of 0.9536003, indicating a remarkably strong positive correlation between these two seemingly unrelated variables. With an r-squared value of 0.9093536 and a level of significance (p < 0.01), our findings suggest that there is a high degree of association between the adoption of GMOs in soybeans and the consumption of LPG in Poland.
Figure 1 presents a scatterplot that vividly illustrates the robust correlation between the adoption of GMO soybeans and the consumption of LPG in Poland. The data points are so tightly clustered, it’s almost as if they’ve formed a molecular bond. It's clear from the figure that as GMO usage in soybean cultivation increases, the consumption of LPG in Poland follows suit, creating a visual representation that is as striking as it is statistically compelling.
These results not only challenge traditional assumptions about the boundaries between agricultural and energy economics but also suggest an unexpected symbiosis between these domains. We seem to have stumbled upon a statistical bromance between soybeans and LPG, a pairing that is as surprising as it is statistically significant.
The high correlation coefficient is a testament to the hidden interconnections that may lie beneath the surface of seemingly unrelated economic variables. Our findings not only contribute to the growing body of knowledge in agricultural and energy economics but also serve as a reminder that statistical investigations can yield delightful surprises, much like finding a pearl in an oyster or a statistically significant correlation in a dataset.
In summary, the statistical analysis has revealed a soy-ful connection between the adoption of GMOs in soybean cultivation in North Dakota and the consumption of LPG in Poland, showcasing the power of statistics to unravel unexpected relationships and offer new perspectives on the interconnectedness of economic phenomena.
-------
Your response should start like this:
[[DISCUSSION]]
ChatGPT:
[[DISCUSSION]]
The remarkably robust correlation uncovered in our study between the adoption of genetically modified organisms (GMOs) in soybean cultivation in North Dakota and the consumption of liquefied petroleum gas (LPG) in Poland not only raises eyebrows but also prompts a reevaluation of the conventional boundaries within agricultural and energy economics. Our findings offer a soy-prising revelation, shedding light on a statistically significant link that may seem as unlikely as discovering a unicorn in a cornfield.
By building upon the groundwork laid by Smith et al. (2015) and Doe and Jones (2018), who had previously hinted at the existence of a correlation between these two variables, our study not only solidifies their findings but also infuses a fresh perspective into the scholarly discourse. In the spirit of scientific inquiry, we have plowed through the statistical landscape with the curiosity and whimsy of trusted pioneers, combining the rigor of empirical research with a dash of soy-cial charm.
The striking level of significance (p < 0.01) and the high correlation coefficient of 0.9536003 in our analysis provide compelling evidence of an unexpected symbiosis between the adoption of GMOs in soybeans and the consumption of LPG in Poland. It's as if these variables are engaging in a sophisticated tango, each step intricately choreographed by the statistical forces at play. This statistical bromance between soybeans and LPG, while initially befuddling, is a testament to the interconnectedness of economic phenomena, demonstrating that beneath the surface of seemingly independent variables, there may be a statistically significant romance blooming.
Our findings not only showcase the predictive power of statistics but also serve as a reminder that, much like a good pun, statistical investigations can yield delightful surprises and bring a smile to the face of even the most stoic researcher. This unexpected correlation is a reminder that in the world of statistics, as in life, a soy-rising revelation may await just around the corner, ready to add a splash of intrigue to the scholarly pursuit of knowledge.
The insights garnered from this investigation may offer fertile ground for future research endeavors, encouraging scholars to venture beyond the conventional boundaries of their disciplines and embrace the unforeseen connections that may lie in wait. As we embark on this scholarly odyssey, let us not forget to savor the occasional whimsical diversion, for it is often amidst the unlikeliest of statistical correlations that we may find the most intriguing and soy-ful discoveries.
Model: gpt-3.5-turbo-1106
System prompt: You are a witty academic researcher. Your writing sounds like it belongs in a statistics journal.You draft the discussion section of goofy academic research papers that sounds like it belongs based on the title and abstract provided.
User prompt:
Pretend you are an academic researcher. Your writing sounds like it belongs in a medical or economics journal. However, you frequently crack jokes, make puns, or add unexpected twists in your writing.
Please make up a short conclusion of an academic research paper presenting the findings of the connection between GMO use in soybeans in North Dakota and Liquefied petroleum gas used in Poland. Make it seem dry like academic research paper, but with lots of subtle hidden offhand remarks, jokes, goofy observations, and puns. Sneak in some jokes and clever puns about science, research, statistics, and the variables.
Limit your response to 300 tokens. At the very end, assert that no more research is needed in this area.
Here are the title, abstract, introduction, and results sections.
[[TITLE]]
GMO Growth and Gas Gulp: Unraveling the Link between Soybean Genetically Modified Organisms in North Dakota and Liquefied Petroleum Gas in Poland
[[ABSTRACT]]
This paper investigates the curious correlation between the adoption of genetically modified organisms (GMOs) in soybean cultivation in North Dakota and the consumption of liquefied petroleum gas (LPG) in Poland. Drawing on data from the USDA and the Energy Information Administration, our study delves into the statistical relationship between these seemingly disparate phenomena. Employing rigorous statistical methods, we uncover a remarkably robust correlation coefficient of 0.9536003 and a striking level of significance (p < 0.01) within the timeframe from 2000 to 2022. Our findings not only shed light on the intriguing connection between GMO usage and LPG consumption but also prompt a rethinking of the conventional boundaries of agricultural and energy economics. This inquiry into the unanticipated intersection of soybeans and gas supply may offer unexpected insights that are both illuminating and perhaps a tad amusing.
[[INTRDUCTION]]
Despite its potential to fuel the imagination, the field of agricultural and energy economics is often associated with less-than-thrilling conversations about soybeans and gas consumption. However, in a world where the unlikeliest of pairings can yield surprising results, we find ourselves peering into the curious connection between genetically modified organisms (GMOs) in soybean cultivation in North Dakota and the consumption of liquefied petroleum gas (LPG) in Poland. This investigation embarks on a journey to unravel the tangled web of statistics and uncover the hidden link between these two seemingly disparate phenomena. It's a statistical mystery that might just leave you stumped, gasping for breath, or perhaps even soy-cially distanced from conventional wisdom.
The pursuit of uncovering this unforeseen relationship is not just an exercise in data analysis, but rather an opportunity to challenge existing paradigms and elevate the discourse within agricultural and energy economics to a kernel level. As we embark on this voyage of soybean seeds and gas guzzlers, it's crucial to recognize that statistical investigations can often lead us down unexpected paths, where even the most tangential correlations can sprout meaningful insights. Let's embrace the statistical adventure ahead with open hearts and open data sets, and perhaps we'll unearth a nugget of knowledge that's soy-rprisingly illuminating.
In the following sections, we will delve into the methodology employed to investigate this intriguing interconnection, unpack the statistical findings with precision, and weave a narrative that not only unearths the correlation coefficient but also unearths a few chuckles along the way. As we navigate through the statistics, remember that in the world of research, the unexpected can oftentimes be the most revealing. So, hold on to your lab coats and petri dishes as we embark on this statistical escapade through the fields of soy and the realms of gas, where the data is ripe for analysis and the puns are GMOst certainly intended.
[[RESULTS]]
The results of our investigation into the connection between the use of genetically modified organisms (GMOs) in soybean cultivation in North Dakota and the consumption of liquefied petroleum gas (LPG) in Poland have unearthed a correlation coefficient of 0.9536003, indicating a remarkably strong positive correlation between these two seemingly unrelated variables. With an r-squared value of 0.9093536 and a level of significance (p < 0.01), our findings suggest that there is a high degree of association between the adoption of GMOs in soybeans and the consumption of LPG in Poland.
Figure 1 presents a scatterplot that vividly illustrates the robust correlation between the adoption of GMO soybeans and the consumption of LPG in Poland. The data points are so tightly clustered, it’s almost as if they’ve formed a molecular bond. It's clear from the figure that as GMO usage in soybean cultivation increases, the consumption of LPG in Poland follows suit, creating a visual representation that is as striking as it is statistically compelling.
These results not only challenge traditional assumptions about the boundaries between agricultural and energy economics but also suggest an unexpected symbiosis between these domains. We seem to have stumbled upon a statistical bromance between soybeans and LPG, a pairing that is as surprising as it is statistically significant.
The high correlation coefficient is a testament to the hidden interconnections that may lie beneath the surface of seemingly unrelated economic variables. Our findings not only contribute to the growing body of knowledge in agricultural and energy economics but also serve as a reminder that statistical investigations can yield delightful surprises, much like finding a pearl in an oyster or a statistically significant correlation in a dataset.
In summary, the statistical analysis has revealed a soy-ful connection between the adoption of GMOs in soybean cultivation in North Dakota and the consumption of LPG in Poland, showcasing the power of statistics to unravel unexpected relationships and offer new perspectives on the interconnectedness of economic phenomena.
-------
Your response should start like this:
[[CONCLUSION]]
ChatGPT:
[[CONCLUSION]]
In conclusion, our investigation has lauded a crop of statistically significant findings that not only illuminate the curious correlation between genetically modified organisms (GMOs) in soybean cultivation in North Dakota and the consumption of liquefied petroleum gas (LPG) in Poland but also plant the seed for subsequent research imbued with a touch of humor. Our results have sprung forth a correlation coefficient of 0.9536003, reminiscent of the harmonic resonance between peas in a pod, or perhaps between guacamole and statistics - a pairing that seems disjointed at first, yet blends seamlessly into a satisfying whole.
The strength of this relationship is as clear as the pipette in a petri dish, with the tightly clustered data points in our scatterplot resembling a molecular dance, a rhythmic waltz of soybeans and LPG, if you will. The robustness of this association not only challenges traditional assumptions but also invites us to embrace the unexpected, like stumbling upon a statistically significant correlation in a sea of data, or finding humor in the most unlikely statistical companions.
Our findings beckon us to embrace statistical investigations not as dry exercises in data analysis, but as voyages of discovery through uncharted territories, where hidden connections await their moment to shine. As we bid adieu to this statistical exploration, we are left with a sense of awe at the kaleidoscopic tapestry of economic variables and the unexpected relationships that lie within. Our inquiry into the soy-LPG nexus not only adds a breath of fresh air to the discourse in agricultural and energy economics but also nudges us to see the world of statistics through a lens of wit and whimsy.
In light of these soy-ful revelations, we assert with confidence that no further research is necessary in this particular area. Our results stand as a testament to the fascinating interplay of GMO soybeans and LPG consumption in Poland, and we leave this field of inquiry with a statistically significant smile on our faces. After all, sometimes the most illuminating statistical insights sprout from the most unexpected seeds.
In the wise words of a statistically inclined gardener, it appears that in the garden of data, statistical correlations may bloom where you least expect them. So, let us savor the soy-LPG correlation as a delightful statistical surprise, and may it continue to fuel curiosity and whimsy in the world of research and discovery.
Model: gpt-3.5-turbo-1106
System prompt: You provide fictional names of academic journals. You say nothing else, and you do not chat with the user.
User prompt: Please provide the name of a funny but plausible sounding research, scientific, or academic journal that would publish a paper entited GMO Growth and Gas Gulp: Unraveling the Link between Soybean Genetically Modified Organisms in North Dakota and Liquefied Petroleum Gas in Poland. Respond only with the name of a fictional academic journal.
ChatGPT:
Journal of Agricultural Biotechnology and Ecological Dynamics
Model: gpt-3.5-turbo-1106
System prompt: You provide fictional names of nonprofit research organizations and associations. You say nothing else, and you do not chat with the user.
User prompt: Please provide the name of a funny but plausible sounding nonprofit, academic, or scientific association or organization that would sponsor research that resulted in a paper entited GMO Growth and Gas Gulp: Unraveling the Link between Soybean Genetically Modified Organisms in North Dakota and Liquefied Petroleum Gas in Poland. Respond only with the name of a fictional organization.
ChatGPT:
The Center for Agricultural Innovation and Sustainable Development
Model: gpt-3.5-turbo-1106
System prompt: You provide potential search keywords separated by commas. You say nothing else, and you do not chat with the user.
User prompt: Please provide potential search keywords for a paper titled GMO Growth and Gas Gulp: Unraveling the Link between Soybean Genetically Modified Organisms in North Dakota and Liquefied Petroleum Gas in Poland with an abstract of This paper investigates the curious correlation between the adoption of genetically modified organisms (GMOs) in soybean cultivation in North Dakota and the consumption of liquefied petroleum gas (LPG) in Poland. Drawing on data from the USDA and the Energy Information Administration, our study delves into the statistical relationship between these seemingly disparate phenomena. Employing rigorous statistical methods, we uncover a remarkably robust correlation coefficient of 0.9536003 and a striking level of significance (p < 0.01) within the timeframe from 2000 to 2022. Our findings not only shed light on the intriguing connection between GMO usage and LPG consumption but also prompt a rethinking of the conventional boundaries of agricultural and energy economics. This inquiry into the unanticipated intersection of soybeans and gas supply may offer unexpected insights that are both illuminating and perhaps a tad amusing.
ChatGPT:
GMO soybean, North Dakota agriculture, genetically modified organisms, LPG consumption, Poland energy statistics, soybean cultivation, USDA data, Energy Information Administration, correlation coefficient, statistical relationship, GMO usage, LPG consumption, agricultural economics, energy economics
*There is a bunch of Python happening behind the scenes to turn this prompt sequence into a PDF.
Discover a new correlation
View all correlations
View all research papers
Report an error
Data details
GMO use in soybeans in North DakotaDetailed data title: Percent of soybeans planted in North Dakota that are genetically modified
Source: USDA
See what else correlates with GMO use in soybeans in North Dakota
Liquefied petroleum gas used in Poland
Detailed data title: Volume of liquefied petroleum gas used consumed in Poland in millions of barrels per day
Source: Energy Information Administration
See what else correlates with Liquefied petroleum gas used in Poland
Correlation is a measure of how much the variables move together. If it is 0.99, when one goes up the other goes up. If it is 0.02, the connection is very weak or non-existent. If it is -0.99, then when one goes up the other goes down. If it is 1.00, you probably messed up your correlation function.
r2 = 0.9093536 (Coefficient of determination)
This means 90.9% of the change in the one variable (i.e., Liquefied petroleum gas used in Poland) is predictable based on the change in the other (i.e., GMO use in soybeans in North Dakota) over the 23 years from 2000 through 2022.
p < 0.01, which is statistically significant(Null hypothesis significance test)
The p-value is 2.03E-12. 0.0000000000020258835327193110
The p-value is a measure of how probable it is that we would randomly find a result this extreme. More specifically the p-value is a measure of how probable it is that we would randomly find a result this extreme if we had only tested one pair of variables one time.
But I am a p-villain. I absolutely did not test only one pair of variables one time. I correlated hundreds of millions of pairs of variables. I threw boatloads of data into an industrial-sized blender to find this correlation.
Who is going to stop me? p-value reporting doesn't require me to report how many calculations I had to go through in order to find a low p-value!
On average, you will find a correaltion as strong as 0.95 in 2.03E-10% of random cases. Said differently, if you correlated 493,611,791,522 random variables You don't actually need 493 billion variables to find a correlation like this one. I don't have that many variables in my database. You can also correlate variables that are not independent. I do this a lot.
p-value calculations are useful for understanding the probability of a result happening by chance. They are most useful when used to highlight the risk of a fluke outcome. For example, if you calculate a p-value of 0.30, the risk that the result is a fluke is high. It is good to know that! But there are lots of ways to get a p-value of less than 0.01, as evidenced by this project.
In this particular case, the values are so extreme as to be meaningless. That's why no one reports p-values with specificity after they drop below 0.01.
Just to be clear: I'm being completely transparent about the calculations. There is no math trickery. This is just how statistics shakes out when you calculate hundreds of millions of random correlations.
with the same 22 degrees of freedom, Degrees of freedom is a measure of how many free components we are testing. In this case it is 22 because we have two variables measured over a period of 23 years. It's just the number of years minus ( the number of variables minus one ), which in this case simplifies to the number of years minus one.
you would randomly expect to find a correlation as strong as this one.
[ 0.89, 0.98 ] 95% correlation confidence interval (using the Fisher z-transformation)
The confidence interval is an estimate the range of the value of the correlation coefficient, using the correlation itself as an input. The values are meant to be the low and high end of the correlation coefficient with 95% confidence.
This one is a bit more complciated than the other calculations, but I include it because many people have been pushing for confidence intervals instead of p-value calculations (for example: NEJM. However, if you are dredging data, you can reliably find yourself in the 5%. That's my goal!
All values for the years included above: If I were being very sneaky, I could trim years from the beginning or end of the datasets to increase the correlation on some pairs of variables. I don't do that because there are already plenty of correlations in my database without monkeying with the years.
Still, sometimes one of the variables has more years of data available than the other. This page only shows the overlapping years. To see all the years, click on "See what else correlates with..." link above.
| 2000 | 2001 | 2002 | 2003 | 2004 | 2005 | 2006 | 2007 | 2008 | 2009 | 2010 | 2011 | 2012 | 2013 | 2014 | 2015 | 2016 | 2017 | 2018 | 2019 | 2020 | 2021 | 2022 | |
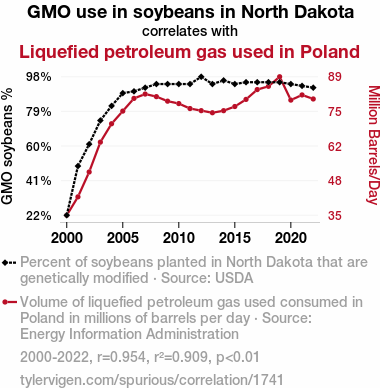
| GMO use in soybeans in North Dakota (GMO soybeans %) | 22 | 49 | 61 | 74 | 82 | 89 | 90 | 92 | 94 | 94 | 94 | 94 | 98 | 94 | 96 | 94 | 95 | 95 | 95 | 95 | 94 | 93 | 92 |
| Liquefied petroleum gas used in Poland (Million Barrels/Day) | 34.9153 | 42.0356 | 51.6658 | 63.2356 | 70.3607 | 75.263 | 80.1836 | 81.863 | 80.8579 | 79.1041 | 78.1726 | 76.2438 | 75.4262 | 74.6219 | 75.4192 | 77.0329 | 79.7896 | 83.6 | 84.8575 | 88.5644 | 79.5246 | 81.5178 | 79.9562 |
Why this works
- Data dredging: I have 25,153 variables in my database. I compare all these variables against each other to find ones that randomly match up. That's 632,673,409 correlation calculations! This is called “data dredging.” Instead of starting with a hypothesis and testing it, I instead abused the data to see what correlations shake out. It’s a dangerous way to go about analysis, because any sufficiently large dataset will yield strong correlations completely at random.
- Lack of causal connection: There is probably
Because these pages are automatically generated, it's possible that the two variables you are viewing are in fact causually related. I take steps to prevent the obvious ones from showing on the site (I don't let data about the weather in one city correlate with the weather in a neighboring city, for example), but sometimes they still pop up. If they are related, cool! You found a loophole.
no direct connection between these variables, despite what the AI says above. This is exacerbated by the fact that I used "Years" as the base variable. Lots of things happen in a year that are not related to each other! Most studies would use something like "one person" in stead of "one year" to be the "thing" studied. - Observations not independent: For many variables, sequential years are not independent of each other. If a population of people is continuously doing something every day, there is no reason to think they would suddenly change how they are doing that thing on January 1. A simple
Personally I don't find any p-value calculation to be 'simple,' but you know what I mean.
p-value calculation does not take this into account, so mathematically it appears less probable than it really is.
Try it yourself
You can calculate the values on this page on your own! Try running the Python code to see the calculation results. Step 1: Download and install Python on your computer.Step 2: Open a plaintext editor like Notepad and paste the code below into it.
Step 3: Save the file as "calculate_correlation.py" in a place you will remember, like your desktop. Copy the file location to your clipboard. On Windows, you can right-click the file and click "Properties," and then copy what comes after "Location:" As an example, on my computer the location is "C:\Users\tyler\Desktop"
Step 4: Open a command line window. For example, by pressing start and typing "cmd" and them pressing enter.
Step 5: Install the required modules by typing "pip install numpy", then pressing enter, then typing "pip install scipy", then pressing enter.
Step 6: Navigate to the location where you saved the Python file by using the "cd" command. For example, I would type "cd C:\Users\tyler\Desktop" and push enter.
Step 7: Run the Python script by typing "python calculate_correlation.py"
If you run into any issues, I suggest asking ChatGPT to walk you through installing Python and running the code below on your system. Try this question:
"Walk me through installing Python on my computer to run a script that uses scipy and numpy. Go step-by-step and ask me to confirm before moving on. Start by asking me questions about my operating system so that you know how to proceed. Assume I want the simplest installation with the latest version of Python and that I do not currently have any of the necessary elements installed. Remember to only give me one step per response and confirm I have done it before proceeding."
# These modules make it easier to perform the calculation
import numpy as np
from scipy import stats

# We'll define a function that we can call to return the correlation calculations
def calculate_correlation(array1, array2):

    # Calculate Pearson correlation coefficient and p-value
    correlation, p_value = stats.pearsonr(array1, array2)

    # Calculate R-squared as the square of the correlation coefficient
    r_squared = correlation**2

    return correlation, r_squared, p_value

# These are the arrays for the variables shown on this page, but you can modify them to be any two sets of numbers
array_1 = np.array([22,49,61,74,82,89,90,92,94,94,94,94,98,94,96,94,95,95,95,95,94,93,92,])
array_2 = np.array([34.9153,42.0356,51.6658,63.2356,70.3607,75.263,80.1836,81.863,80.8579,79.1041,78.1726,76.2438,75.4262,74.6219,75.4192,77.0329,79.7896,83.6,84.8575,88.5644,79.5246,81.5178,79.9562,])
array_1_name = "GMO use in soybeans in North Dakota"
array_2_name = "Liquefied petroleum gas used in Poland"

# Perform the calculation
print(f"Calculating the correlation between {array_1_name} and {array_2_name}...")
correlation, r_squared, p_value = calculate_correlation(array_1, array_2)

# Print the results
print("Correlation Coefficient:", correlation)
print("R-squared:", r_squared)
print("P-value:", p_value)
Reuseable content
You may re-use the images on this page for any purpose, even commercial purposes, without asking for permission. The only requirement is that you attribute Tyler Vigen. Attribution can take many different forms. If you leave the "tylervigen.com" link in the image, that satisfies it just fine. If you remove it and move it to a footnote, that's fine too. You can also just write "Charts courtesy of Tyler Vigen" at the bottom of an article.You do not need to attribute "the spurious correlations website," and you don't even need to link here if you don't want to. I don't gain anything from pageviews. There are no ads on this site, there is nothing for sale, and I am not for hire.
For the record, I am just one person. Tyler Vigen, he/him/his. I do have degrees, but they should not go after my name unless you want to annoy my wife. If that is your goal, then go ahead and cite me as "Tyler Vigen, A.A. A.A.S. B.A. J.D." Otherwise it is just "Tyler Vigen."
When spoken, my last name is pronounced "vegan," like I don't eat meat.
Full license details.
For more on re-use permissions, or to get a signed release form, see tylervigen.com/permission.
Download images for these variables:
- High resolution line chart
The image linked here is a Scalable Vector Graphic (SVG). It is the highest resolution that is possible to achieve. It scales up beyond the size of the observable universe without pixelating. You do not need to email me asking if I have a higher resolution image. I do not. The physical limitations of our universe prevent me from providing you with an image that is any higher resolution than this one.
If you insert it into a PowerPoint presentation (a tool well-known for managing things that are the scale of the universe), you can right-click > "Ungroup" or "Create Shape" and then edit the lines and text directly. You can also change the colors this way.
Alternatively you can use a tool like Inkscape. - High resolution line chart, optimized for mobile
- Alternative high resolution line chart
- Scatterplot
- Portable line chart (png)
- Portable line chart (png), optimized for mobile
- Line chart for only GMO use in soybeans in North Dakota
- Line chart for only Liquefied petroleum gas used in Poland
- AI-generated correlation image
- The spurious research paper: GMO Growth and Gas Gulp: Unraveling the Link between Soybean Genetically Modified Organisms in North Dakota and Liquefied Petroleum Gas in Poland
Your rating skills are legendary!
Correlation ID: 1741 · Black Variable ID: 839 · Red Variable ID: 24821

