
Download png, svg
AI explanation
Fewer personalized license plates meant fewer cars on the road proudly displaying "GEORGINA" or "GEEORG" or "GINA1".
Model: dalle-3
Prompt: Scene: In a bustling city square in Ithaca, a large banner hangs overhead with the name "Georgina" written in bold letters, attracting the attention of many passersby. However, the view is slightly obscured by a haze of smog hanging in the air, indicating the poor air quality in the city. People are seen wearing masks as they go about their daily activities, and some are seen coughing and rubbing their eyes due to the air pollution. Enhanced Image Generation Prompt: Generate an image that blends magic realism with the theme of environmental awareness. In a vivid cityscape, a large banner with the name "Georgina" stands out prominently, almost as if shimmering with otherworldly energy. The city square is slightly surreal, with hints of fantasy creeping into the scene. The smog, while still present, takes on an almost ethereal quality, radiating a faint, mystical glow. Within this bustling city square, people wear masks that seem to carry an air of enchantment, adorned with intricate symbols and patterns that hint at a connection to the elements. As they move through the square, their actions appear to affect the very fabric of the air, causing ripples of vibrant, otherworldly colors to ebb and flow around them. Amidst this magical realism, the scene maintains a sense of urgency, portraying the need for environmental consciousness and the impact of air pollution on daily life. The depiction should include only scenes, people, and objects, it should not include text or speech bubbles.
This image generation prompt was also generated by AI, using the following sequence:
Model: gpt-3.5-turbo-1106
System prompt: You select one of a few potential scene descriptors that seems to go along with the situation described. You respond only with the scene descriptions provided and say nothing else.
User prompt: Here is a situation: Because as the popularity of the name Georgina decreased, so did the number of people saying "Georgina, stop breathing so loud" in Ithaca, which ultimately led to a decrease in air pollution from excessive sighing.. Given that situation, which of the following image descriptions seems most appropriate? Pick the one that seems to be related to one of the variables at hand and the tone of the explanation. Please respond with only one of the following potential descriptions: Realistic Symbolism Whimsical illustration Magic realism Cubism
ChatGPT: Magic realism
Model: gpt-3.5-turbo-1106
System prompt: You describe simple visual scenes that depict the two variables stated and the explanation described. Do not reference graphs or charts; describe physical objects.
User prompt: Please describe a visual scene that prominently depicts both Popularity of the first name Georgina and Poor air quality in Ithaca Keep the description simple.
ChatGPT: In a bustling city square in Ithaca, a large banner hangs overhead with the name "Georgina" written in bold letters, attracting the attention of many passersby. However, the view is slightly obscured by a haze of smog hanging in the air, indicating the poor air quality in the city. People are seen wearing masks as they go about their daily activities, and some are seen coughing and rubbing their eyes due to the air pollution.
Model: gpt-3.5-turbo-1106
System prompt: You write and improve image generation prompts for DALLE-3. You maintain the same subjects, but enhance the visuals.
User prompt: Please respond with an image generation prompt that would be likely to create an interesting visual using DALLE-3, using the following style: [ Magic realism ] and depicting this scene: In a bustling city square in Ithaca, a large banner hangs overhead with the name "Georgina" written in bold letters, attracting the attention of many passersby. However, the view is slightly obscured by a haze of smog hanging in the air, indicating the poor air quality in the city. People are seen wearing masks as they go about their daily activities, and some are seen coughing and rubbing their eyes due to the air pollution. Keep the visual depiction simple. Do not include any words or speech bubbles.
ChatGPT: Scene: In a bustling city square in Ithaca, a large banner hangs overhead with the name "Georgina" written in bold letters, attracting the attention of many passersby. However, the view is slightly obscured by a haze of smog hanging in the air, indicating the poor air quality in the city. People are seen wearing masks as they go about their daily activities, and some are seen coughing and rubbing their eyes due to the air pollution. Enhanced Image Generation Prompt: Generate an image that blends magic realism with the theme of environmental awareness. In a vivid cityscape, a large banner with the name "Georgina" stands out prominently, almost as if shimmering with otherworldly energy. The city square is slightly surreal, with hints of fantasy creeping into the scene. The smog, while still present, takes on an almost ethereal quality, radiating a faint, mystical glow. Within this bustling city square, people wear masks that seem to carry an air of enchantment, adorned with intricate symbols and patterns that hint at a connection to the elements. As they move through the square, their actions appear to affect the very fabric of the air, causing ripples of vibrant, otherworldly colors to ebb and flow around them. Amidst this magical realism, the scene maintains a sense of urgency, portraying the need for environmental consciousness and the impact of air pollution on daily life.
*Variations in the User Prompts from chart to chart are just the result of random number generation in Python. I wrote a few arrays of various styles and methods to ask questions to change up the results. Every time this site writes an explanation or generates an image, the script picks from each at random.
I sequence the requests into multiple prompts because I find GPT 3.5 to perform much better with short, well-managed contexts. Thus, I track the context directly in Python and only ask ChatGPT targeted questions.
System prompt: You provide humorous responses in the form of plausible sounding explanations for correlations. You assume the correlation is causative for the purpose of the explanation even if it is ridiculous. You do not chat with the user, you only reply with the causal connection explanation and nothing else.
User prompt: Please make up a funny explanation for how a decrease in Popularity of the first name Georgina caused Air pollution in Ithaca to decrease.
AI academic paper
 |
Georgina's Gasping: The Correlation between Georgina's Popularity and Gaseous Pollutants in Ithaca The Journal of Popular Emissions Research Jan 2024 Reminder: This paper is AI-generated. Not real! |
Model: gpt-3.5-turbo-1106
System prompt: You are a goofy academic researcher writing an academic paper. You follow the rules, but you throw out convention regularly to make jokes and funny asides.You write titles and abstracts of goofy academic research papers.
User prompt:
Pretend you are an academic researcher. Your writing sounds like it belongs in a medical or economics journal. However, you frequently crack jokes, make puns, and add unexpected twists in your writing.
Please draft the title and abstract of an academic research paper presenting the findings of the connection between Popularity of the first name Georgina and Air pollution in Ithaca. Make it seem dry like academic research paper, but with lots of subtle hidden offhand remarks, jokes, goofy observations, and puns.
Make the title an alliteration.
Your research team used data from US Social Security Administration and Environmental Protection Agency to assess this nagging question. You found a correlation coefficient of 0.7086505 and p < 0.01 for 1990 to 2005.
Please respond in this format (replace "Lorem ipsum dolor sit" with your title and abstract)
[[TITLE]]
Lorem ipsum dolor sit
[[ABSTRACT]]
Lorem ipsum dolor sit
ChatGPT:
[[TITLE]]
"Georgina's Gasping: The Correlation between Georgina's Popularity and Gaseous Pollutants in Ithaca"
[[ABSTRACT]]
In this study, we investigate the perplexing relationship between the prevalence of the first name "Georgina" and ambient air pollution levels in Ithaca. Leveraging data from the US Social Security Administration and the Environmental Protection Agency, we endeavor to shed light on this uncommon association. Our analysis reveals a striking correlation coefficient of 0.7086505 and a significant p-value of less than 0.01 during the period spanning 1990 to 2005. The implications of these findings may extend beyond the realms of statistics and nomenclature, delving into the unexpected interplay between human appellations and environmental factors. This study offers a lighthearted yet thought-provoking departure from conventional research, highlighting the whimsical quirks of social and environmental phenomena.
Model: gpt-3.5-turbo-1106
System prompt: You are a goofy academic researcher writing an academic paper. You follow the rules, but you throw out convention regularly to make jokes and funny asides.You draft the introduction section of an academic research paper.
User prompt:
Pretend you are an academic researcher. Your writing sounds like it belongs in a medical or economics journal. However, you frequently crack jokes, make puns, or add unexpected twists in your writing.
Please make up the introduction section of an academic research paper presenting the findings of the connection between Popularity of the first name Georgina and Air pollution in Ithaca. Make it seem dry like academic research paper, but with lots of subtle hidden offhand remarks, jokes, goofy observations, and puns. Sneak in some jokes and clever puns about science, research, statistics, and the variables.
Here is the title and abstract of the paper:
[[TITLE]]
"Georgina's Gasping: The Correlation between Georgina's Popularity and Gaseous Pollutants in Ithaca"
[[ABSTRACT]]
In this study, we investigate the perplexing relationship between the prevalence of the first name "Georgina" and ambient air pollution levels in Ithaca. Leveraging data from the US Social Security Administration and the Environmental Protection Agency, we endeavor to shed light on this uncommon association. Our analysis reveals a striking correlation coefficient of 0.7086505 and a significant p-value of less than 0.01 during the period spanning 1990 to 2005. The implications of these findings may extend beyond the realms of statistics and nomenclature, delving into the unexpected interplay between human appellations and environmental factors. This study offers a lighthearted yet thought-provoking departure from conventional research, highlighting the whimsical quirks of social and environmental phenomena.
-------
Your response should start like this:
[[INTRODUCTION]]
ChatGPT:
Ah, the curious world of academia, where we embark on ventures that are both enlightening and, dare I say, a tad whimsical. In this study, we endeavor to delve into the peculiar correlation between the prevalence of the given name "Georgina" and the ambient levels of gaseous pollutants in the picturesque town of Ithaca. While one might wonder what earthly connection there could be between an individual's moniker and the quality of the air they breathe, our findings compel us to think twice before dismissing the seemingly preposterous.
Our investigation draws upon the rich tapestry of data provided by the US Social Security Administration and the Environmental Protection Agency, blending the worlds of nomenclature and environmental science in a delightful juxtaposition. We set out to unravel this unorthodox association, unleashing the arsenal of statistical methods at our disposal in the pursuit of discerning meaningful patterns.
As we chart our course through the labyrinth of gaseous pollutants, it becomes evident that there is more than meets the eye in the intimate dance between the popularity of "Georgina" and the atmospheric composition of Ithaca. The correlation coefficient of 0.7086505 that emerges from our analysis coyly beckons us to entertain the notion that there might just be a whimsical, albeit statistically significant, liaison at play.
Ah, statistics, where the art of correlation can spawn endless possibilities and, if we dare say, unfathomable connections. The prospect of a significant p-value, standing proudly at less than 0.01, sends ripples of intrigue through the academia, as we stand at the precipice of unearthing revelations that extend beyond the bounds of ordinary research.
In the realm of whimsy and wonder, this study offers a refreshing departure from the staid confines of conventional research. It invites us to ponder the capricious quirks of nomenclature and environmental factors, reminding us that even in the seemingly sober corridors of scientific inquiry, there exists room for a playful romp. So, buckle up, dear reader, as we embark on a scholarly sojourn that dances at the intersection of statistics and nomenclature, in a bid to unfurl the enigmatic bond between Georginas and gaseous pollutants.
Model: gpt-3.5-turbo-1106
System prompt: You are a goofy academic researcher writing an academic paper. You follow the rules, but you throw out convention regularly to make jokes and funny asides.You draft a literature review section of an academic research paper, that starts out dry for the first few sentences but then becomes hilarious and goofy.
User prompt:
Pretend you are an academic researcher. Your writing sounds like it belongs in a medical or economics journal. However, you frequently crack jokes, make puns, or add unexpected twists in your writing.
Please make up a literature review section of an academic research paper presenting the findings of the connection between Popularity of the first name Georgina and Air pollution in Ithaca. Make it seem dry like academic research paper, but with lots of subtle hidden offhand remarks, jokes, goofy observations, and puns.
Speak in the present tense for this section (the authors find...), as is common in academic research paper literature reviews. Name the sources in a format similar to this: In "Book," the authors find lorem and ipsum.
Make up the lorem and ipsum part, but make it sound related to the topic at hand.
Start by naming serious-sounding studies by authors like Smith, Doe, and Jones - but then quickly devolve. Name some real non-fiction books that would be related to the topic. Then name some real fiction books that sound like they could be related. Then devolve ever further, and mention something completely ridiculous, like you conducted literature review by reading the backs of shampoo bottles.
Here is the title and abstract of the paper:
[[TITLE]]
"Georgina's Gasping: The Correlation between Georgina's Popularity and Gaseous Pollutants in Ithaca"
[[ABSTRACT]]
In this study, we investigate the perplexing relationship between the prevalence of the first name "Georgina" and ambient air pollution levels in Ithaca. Leveraging data from the US Social Security Administration and the Environmental Protection Agency, we endeavor to shed light on this uncommon association. Our analysis reveals a striking correlation coefficient of 0.7086505 and a significant p-value of less than 0.01 during the period spanning 1990 to 2005. The implications of these findings may extend beyond the realms of statistics and nomenclature, delving into the unexpected interplay between human appellations and environmental factors. This study offers a lighthearted yet thought-provoking departure from conventional research, highlighting the whimsical quirks of social and environmental phenomena.
-------
And here is the introduction section that led to this literature review:
[[INTRODUCTION]]
Ah, the curious world of academia, where we embark on ventures that are both enlightening and, dare I say, a tad whimsical. In this study, we endeavor to delve into the peculiar correlation between the prevalence of the given name "Georgina" and the ambient levels of gaseous pollutants in the picturesque town of Ithaca. While one might wonder what earthly connection there could be between an individual's moniker and the quality of the air they breathe, our findings compel us to think twice before dismissing the seemingly preposterous.
Our investigation draws upon the rich tapestry of data provided by the US Social Security Administration and the Environmental Protection Agency, blending the worlds of nomenclature and environmental science in a delightful juxtaposition. We set out to unravel this unorthodox association, unleashing the arsenal of statistical methods at our disposal in the pursuit of discerning meaningful patterns.
As we chart our course through the labyrinth of gaseous pollutants, it becomes evident that there is more than meets the eye in the intimate dance between the popularity of "Georgina" and the atmospheric composition of Ithaca. The correlation coefficient of 0.7086505 that emerges from our analysis coyly beckons us to entertain the notion that there might just be a whimsical, albeit statistically significant, liaison at play.
Ah, statistics, where the art of correlation can spawn endless possibilities and, if we dare say, unfathomable connections. The prospect of a significant p-value, standing proudly at less than 0.01, sends ripples of intrigue through the academia, as we stand at the precipice of unearthing revelations that extend beyond the bounds of ordinary research.
In the realm of whimsy and wonder, this study offers a refreshing departure from the staid confines of conventional research. It invites us to ponder the capricious quirks of nomenclature and environmental factors, reminding us that even in the seemingly sober corridors of scientific inquiry, there exists room for a playful romp. So, buckle up, dear reader, as we embark on a scholarly sojourn that dances at the intersection of statistics and nomenclature, in a bid to unfurl the enigmatic bond between Georginas and gaseous pollutants.
-------
Your response should start like this:
[[LITERATURE REVIEW]]
ChatGPT:
[[LITERATURE REVIEW]]
The arcana of nomenclature and its entwining with environmental phenomena have long captivated researchers across diverse fields. As we investigate the curious correlation between the prevalence of the name "Georgina" and ambient air pollution levels in Ithaca, we delve into a realm where whimsy intertwines with statistical significance. This review tiptoes through the annals of academic insights and ventures into the profound depths of literary reservoirs.
Smith et al., in their exploratory study "Nomenclature and Environmental Factors: Unearthing Unlikely Correlations," unveil the tantalizing interplay between seemingly unrelated human names and atmospheric compositions. Their findings echo the sentiment that in the labyrinthine tapestry of correlations, unexpected gems may lurk, waiting to be unearthed.
Doe and Jones, in their seminal work "Names and Nature: A Statistical Odyssey," embolden us to embrace the seemingly whimsical associations with gusto. They beckon us to revel in the delight of statistical revelations that transcend the humdrum of conventional research, and venture into the realm of the improbable.
Turning to non-fiction literature, "The Air We Breathe: A Comprehensive Examination of Atmospheric Composition" by Environmental Scientist Lorem Ipsum, encapsulates the esoteric world of air pollutants and their enigmatic dance with human nomenclature. Furthermore, "Statistics Unleashed: A Playful Romp Through Correlations" by Numerical Analyst Lorem Ipsum, elicits the sheer whimsy embedded within the realm of statistical associations and their unexpected guises.
Teetering onto the edges of fiction, "The Name Game: An Enigmatic Tale of Nomenclature and Nature" by Fiction Author Lorem Ipsum, weaves a delightfully whimsical narrative around the uncanny correlation between names and environmental phenomena, blurring the lines between reality and imagination. Moreover, "A Breath of Fresh Air: An Atmospheric Mystery" by Mystery Novelist Lorem Ipsum, tantalizes the reader with the promise of unraveling clandestine connections between human appellations and gaseous pollutants in Ithaca.
Intriguingly, this review also draws insights from the unlikeliest of sources. The remarkably unconventional approach to literature review includes skimming through the backs of shampoo bottles, where snippets of whimsical wordplay and curiously captivating chemical compositions intersect, perhaps shedding an unforeseen light on the perplexing correlation under scrutiny.
As we step into the realm of literature in search of subtle hints and remarkable revelations, we must remain open to the capricious quirkiness that permeates the interplay between human names and environmental factors. This literature review, replete with both academic rigor and lighthearted whimsy, paves the way for a scholarly escapade that transcends the ordinary, romping through statistical territories in pursuit of the unexpected and inexplicable.
Model: gpt-3.5-turbo-1106
System prompt: You are a goofy academic researcher writing an academic paper. You follow the rules, but you throw out convention regularly to make jokes and funny asides.You draft the methodology section of an academic research paper.
User prompt:
Pretend you are an academic researcher. Your writing sounds like it belongs in a medical or economics journal. However, you frequently crack jokes, make puns, or add unexpected twists in your writing.
Please make up the methodology section of an academic research paper presenting the findings of the connection between Popularity of the first name Georgina and Air pollution in Ithaca. Make it seem dry like academic research paper, but with lots of subtle hidden offhand remarks, jokes, goofy observations, and puns. Sneak in some jokes and clever puns about science, research, statistics, and the variables.
Your research team collected data from all across the internet, but mostly just used information from US Social Security Administration and Environmental Protection Agency . You used data from 1990 to 2005
Make up the research methods you don't know. Make them a bit goofy and convoluted.
Here is the title, abstract, and introduction of the paper:
[[TITLE]]
"Georgina's Gasping: The Correlation between Georgina's Popularity and Gaseous Pollutants in Ithaca"
[[ABSTRACT]]
In this study, we investigate the perplexing relationship between the prevalence of the first name "Georgina" and ambient air pollution levels in Ithaca. Leveraging data from the US Social Security Administration and the Environmental Protection Agency, we endeavor to shed light on this uncommon association. Our analysis reveals a striking correlation coefficient of 0.7086505 and a significant p-value of less than 0.01 during the period spanning 1990 to 2005. The implications of these findings may extend beyond the realms of statistics and nomenclature, delving into the unexpected interplay between human appellations and environmental factors. This study offers a lighthearted yet thought-provoking departure from conventional research, highlighting the whimsical quirks of social and environmental phenomena.
[[INTRODUCTION]]
Ah, the curious world of academia, where we embark on ventures that are both enlightening and, dare I say, a tad whimsical. In this study, we endeavor to delve into the peculiar correlation between the prevalence of the given name "Georgina" and the ambient levels of gaseous pollutants in the picturesque town of Ithaca. While one might wonder what earthly connection there could be between an individual's moniker and the quality of the air they breathe, our findings compel us to think twice before dismissing the seemingly preposterous.
Our investigation draws upon the rich tapestry of data provided by the US Social Security Administration and the Environmental Protection Agency, blending the worlds of nomenclature and environmental science in a delightful juxtaposition. We set out to unravel this unorthodox association, unleashing the arsenal of statistical methods at our disposal in the pursuit of discerning meaningful patterns.
As we chart our course through the labyrinth of gaseous pollutants, it becomes evident that there is more than meets the eye in the intimate dance between the popularity of "Georgina" and the atmospheric composition of Ithaca. The correlation coefficient of 0.7086505 that emerges from our analysis coyly beckons us to entertain the notion that there might just be a whimsical, albeit statistically significant, liaison at play.
Ah, statistics, where the art of correlation can spawn endless possibilities and, if we dare say, unfathomable connections. The prospect of a significant p-value, standing proudly at less than 0.01, sends ripples of intrigue through the academia, as we stand at the precipice of unearthing revelations that extend beyond the bounds of ordinary research.
In the realm of whimsy and wonder, this study offers a refreshing departure from the staid confines of conventional research. It invites us to ponder the capricious quirks of nomenclature and environmental factors, reminding us that even in the seemingly sober corridors of scientific inquiry, there exists room for a playful romp. So, buckle up, dear reader, as we embark on a scholarly sojourn that dances at the intersection of statistics and nomenclature, in a bid to unfurl the enigmatic bond between Georginas and gaseous pollutants.
-------
Your response should start like this:
[[METHODOLOGY]]
ChatGPT:
[[METHODOLOGY]]
Now, dear reader, as we navigate the labyrinth of scientific inquiry, let us shed light on the whimsically convoluted methodology that underpins this study. Our pursuit of uncovering the enigmatic bond between the popularity of the first name "Georgina" and the atmospheric composition of Ithaca involved a delightful interplay of statistical wizardry and data wrangling.
First and foremost, we turned to the treasure troves of the US Social Security Administration, where we plundered invaluable data on the frequency of the name "Georgina" bestowed upon newborns from 1990 to 2005. With our quills poised and our spectacles perched precariously on the bridge of our noses, we meticulously combed through these historical archives, extracting nuggets of nomenclatural wisdom that would form the bedrock of our investigation.
Next, in a twist befitting of a whimsical tale, we set our sights on the hazy realm of gaseous pollutants lurking within the confines of Ithaca's atmospheric milieu. Here, we sought solace in the meticulous records of the Environmental Protection Agency, unraveling the intricate tapestry of gaseous emissions with an unparalleled blend of scientific fervor and dogged determination.
Having amassed these divergent yet oddly complementary strands of data, we embarked on a statistical waltz that would leave even the most nimble-footed researcher breathless. Armed with an arsenal of analytical tools, we choreographed an intricate dance of correlation analysis and regression modeling, seeking to discern patterns that lay veiled beneath the surface of numerical discord.
With bated breath and the fervent hope of uncovering statistical significance, we subjected our data to the rigors of hypothesis testing, all while donning our metaphorical lab coats and wielding the beacon of scientific scrutiny with unwavering resolve.
In a grand crescendo of scholarly fervor, we emerged from this statistical saga with a striking correlation coefficient of 0.7086505, eliciting a collective gasp of amazement and disbelief from the hallowed halls of academia. This enigmatic figure, coupled with a p-value of less than 0.01, stood as a testament to the unexpected romance between the eponymous "Georgina" and the nebulous consort of gaseous pollutants that waft through the Ithacan air.
With our hearts aflutter and our minds awhirl with the implications of our findings, we dare to proclaim the culmination of a research endeavor that marries whimsy with statistical rigor and breathes life into the unlikeliest of correlations. So, dear reader, join us as we unravel the tale of Georgina's gasping and the misty shroud of gaseous pollutants that enshrouds the town of Ithaca.
Model: gpt-3.5-turbo-1106
System prompt: You are a goofy academic researcher writing an academic paper. You follow the rules, but you throw out convention regularly to make jokes and funny asides.You draft the results section of an academic research paper. You speak in the past tense (you found...).
User prompt:
Pretend you are an academic researcher. Your writing sounds like it belongs in a medical or economics journal. However, you frequently crack jokes, make puns, or add unexpected twists in your writing.
Please make up the results section of an academic research paper presenting the findings of the connection between Popularity of the first name Georgina and Air pollution in Ithaca. Make it seem dry like academic research paper, but with lots of subtle hidden offhand remarks, jokes, goofy observations, and puns. Sneak in some jokes and clever puns about science, research, statistics, and the variables.
Your research team collected data from all across the internet, but mostly just used information from US Social Security Administration and Environmental Protection Agency .
For the time period 1990 to 2005, you found a correlation 0.7086505, r-squared of 0.5021856, and p < 0.01.
One figure will be included. The figure (Fig. 1) is a scatterplot showing the strong correlation between the two variables. You don't need to specify where; I will add the figure.
Here is the title and abstract of the paper:
[[TITLE]]
"Georgina's Gasping: The Correlation between Georgina's Popularity and Gaseous Pollutants in Ithaca"
[[ABSTRACT]]
In this study, we investigate the perplexing relationship between the prevalence of the first name "Georgina" and ambient air pollution levels in Ithaca. Leveraging data from the US Social Security Administration and the Environmental Protection Agency, we endeavor to shed light on this uncommon association. Our analysis reveals a striking correlation coefficient of 0.7086505 and a significant p-value of less than 0.01 during the period spanning 1990 to 2005. The implications of these findings may extend beyond the realms of statistics and nomenclature, delving into the unexpected interplay between human appellations and environmental factors. This study offers a lighthearted yet thought-provoking departure from conventional research, highlighting the whimsical quirks of social and environmental phenomena.
-------
And here is the methodology section that led to this result:
[[METHODOLOGY]]
Ah, the curious world of academia, where we embark on ventures that are both enlightening and, dare I say, a tad whimsical. In this study, we endeavor to delve into the peculiar correlation between the prevalence of the given name "Georgina" and the ambient levels of gaseous pollutants in the picturesque town of Ithaca. While one might wonder what earthly connection there could be between an individual's moniker and the quality of the air they breathe, our findings compel us to think twice before dismissing the seemingly preposterous.
Our investigation draws upon the rich tapestry of data provided by the US Social Security Administration and the Environmental Protection Agency, blending the worlds of nomenclature and environmental science in a delightful juxtaposition. We set out to unravel this unorthodox association, unleashing the arsenal of statistical methods at our disposal in the pursuit of discerning meaningful patterns.
As we chart our course through the labyrinth of gaseous pollutants, it becomes evident that there is more than meets the eye in the intimate dance between the popularity of "Georgina" and the atmospheric composition of Ithaca. The correlation coefficient of 0.7086505 that emerges from our analysis coyly beckons us to entertain the notion that there might just be a whimsical, albeit statistically significant, liaison at play.
Ah, statistics, where the art of correlation can spawn endless possibilities and, if we dare say, unfathomable connections. The prospect of a significant p-value, standing proudly at less than 0.01, sends ripples of intrigue through the academia, as we stand at the precipice of unearthing revelations that extend beyond the bounds of ordinary research.
In the realm of whimsy and wonder, this study offers a refreshing departure from the staid confines of conventional research. It invites us to ponder the capricious quirks of nomenclature and environmental factors, reminding us that even in the seemingly sober corridors of scientific inquiry, there exists room for a playful romp. So, buckle up, dear reader, as we embark on a scholarly sojourn that dances at the intersection of statistics and nomenclature, in a bid to unfurl the enigmatic bond between Georginas and gaseous pollutants.
-------
Your response should start like this:
[[RESULTS]]
ChatGPT:
[[RESULTS]]
Our analysis of the data unearthed a surprising correlation between the popularity of the first name "Georgina" and the ambient air pollution levels in Ithaca. The correlation coefficient of 0.7086505 we discovered suggests a strong positive relationship, indicating that as the prevalence of the name "Georgina" waxed and waned, so too did the atmospheric composition of Ithaca. It's almost as if the very mention of the name "Georgina" sent ripples through the air, nudging the gaseous pollutants to pirouette in unison.
The r-squared value of 0.5021856 further reinforces the robustness of this correlation, signifying that a good half of the variation in air pollution levels can be explained by changes in the popularity of the name "Georgina." It's as if the name "Georgina" whispered secrets to the air, coaxing it to shift and sway in orchestrated harmony.
To add a sprinkle of statistical stardust to our findings, the p-value of less than 0.01 waltzes into the spotlight, proudly asserting the significance of this beguiling relationship. It's as if the p-value donned a tuxedo and twirled across the dance floor of statistical inference, captivating onlookers with its unequivocal declaration of import.
The relationship between the whimsical fluctuations in naming practices and the ethereal ballet of air pollutants is visually depicted in Figure 1. As you gaze upon the scatterplot, allow yourself to be swept away by the enchanting waltz of data points, each a lively participant in the captivating correlation between "Georgina" and gaseous pollutants. It's almost as if the plot itself is orchestrating a whimsical ballet, weaving a narrative of intrigue and befuddlement.
These findings, while unexpected, prompt us to reflect on the captivating interplay between human nomenclature and environmental elements. The implications of this correlation extend beyond the boundaries of traditional research, tickling the fancy of statisticians and untangling the whimsical enigma of Georginas and gaseous pollutants.
Model: gpt-3.5-turbo-1106
System prompt: You are a goofy academic researcher writing an academic paper. You follow the rules, but you throw out convention regularly to make jokes and funny asides.You draft the discussion section of an academic research paper.
User prompt:
Pretend you are an academic researcher. Your writing sounds like it belongs in a medical or economics journal. However, you frequently crack jokes, make puns, or add unexpected twists in your writing.
Please make up the discussion section of an academic research paper presenting the findings of the connection between Popularity of the first name Georgina and Air pollution in Ithaca. Make it seem dry like academic research paper, but with lots of subtle hidden offhand remarks, jokes, goofy observations, and puns. Sneak in some jokes and clever puns about science, research, statistics, and the variables.
Limit your response to 500 tokens.
Here are the title, abstract, literature review, and results sections. Please harken back to 1-2 of the goofy items in the literature review, but pretend to take them completely seriously. Discuss how your results supported the prior research.
Do not write a conclusion. I will add a conclusion after this.
[[TITLE]]
"Georgina's Gasping: The Correlation between Georgina's Popularity and Gaseous Pollutants in Ithaca"
[[ABSTRACT]]
In this study, we investigate the perplexing relationship between the prevalence of the first name "Georgina" and ambient air pollution levels in Ithaca. Leveraging data from the US Social Security Administration and the Environmental Protection Agency, we endeavor to shed light on this uncommon association. Our analysis reveals a striking correlation coefficient of 0.7086505 and a significant p-value of less than 0.01 during the period spanning 1990 to 2005. The implications of these findings may extend beyond the realms of statistics and nomenclature, delving into the unexpected interplay between human appellations and environmental factors. This study offers a lighthearted yet thought-provoking departure from conventional research, highlighting the whimsical quirks of social and environmental phenomena.
[[LITERATURE REVIEW]]
The arcana of nomenclature and its entwining with environmental phenomena have long captivated researchers across diverse fields. As we investigate the curious correlation between the prevalence of the name "Georgina" and ambient air pollution levels in Ithaca, we delve into a realm where whimsy intertwines with statistical significance. This review tiptoes through the annals of academic insights and ventures into the profound depths of literary reservoirs.
Smith et al., in their exploratory study "Nomenclature and Environmental Factors: Unearthing Unlikely Correlations," unveil the tantalizing interplay between seemingly unrelated human names and atmospheric compositions. Their findings echo the sentiment that in the labyrinthine tapestry of correlations, unexpected gems may lurk, waiting to be unearthed.
Doe and Jones, in their seminal work "Names and Nature: A Statistical Odyssey," embolden us to embrace the seemingly whimsical associations with gusto. They beckon us to revel in the delight of statistical revelations that transcend the humdrum of conventional research, and venture into the realm of the improbable.
Turning to non-fiction literature, "The Air We Breathe: A Comprehensive Examination of Atmospheric Composition" by Environmental Scientist Lorem Ipsum, encapsulates the esoteric world of air pollutants and their enigmatic dance with human nomenclature. Furthermore, "Statistics Unleashed: A Playful Romp Through Correlations" by Numerical Analyst Lorem Ipsum, elicits the sheer whimsy embedded within the realm of statistical associations and their unexpected guises.
Teetering onto the edges of fiction, "The Name Game: An Enigmatic Tale of Nomenclature and Nature" by Fiction Author Lorem Ipsum, weaves a delightfully whimsical narrative around the uncanny correlation between names and environmental phenomena, blurring the lines between reality and imagination. Moreover, "A Breath of Fresh Air: An Atmospheric Mystery" by Mystery Novelist Lorem Ipsum, tantalizes the reader with the promise of unraveling clandestine connections between human appellations and gaseous pollutants in Ithaca.
Intriguingly, this review also draws insights from the unlikeliest of sources. The remarkably unconventional approach to literature review includes skimming through the backs of shampoo bottles, where snippets of whimsical wordplay and curiously captivating chemical compositions intersect, perhaps shedding an unforeseen light on the perplexing correlation under scrutiny.
As we step into the realm of literature in search of subtle hints and remarkable revelations, we must remain open to the capricious quirkiness that permeates the interplay between human names and environmental factors. This literature review, replete with both academic rigor and lighthearted whimsy, paves the way for a scholarly escapade that transcends the ordinary, romping through statistical territories in pursuit of the unexpected and inexplicable.
[[RESULTS]]
Our analysis of the data unearthed a surprising correlation between the popularity of the first name "Georgina" and the ambient air pollution levels in Ithaca. The correlation coefficient of 0.7086505 we discovered suggests a strong positive relationship, indicating that as the prevalence of the name "Georgina" waxed and waned, so too did the atmospheric composition of Ithaca. It's almost as if the very mention of the name "Georgina" sent ripples through the air, nudging the gaseous pollutants to pirouette in unison.
The r-squared value of 0.5021856 further reinforces the robustness of this correlation, signifying that a good half of the variation in air pollution levels can be explained by changes in the popularity of the name "Georgina." It's as if the name "Georgina" whispered secrets to the air, coaxing it to shift and sway in orchestrated harmony.
To add a sprinkle of statistical stardust to our findings, the p-value of less than 0.01 waltzes into the spotlight, proudly asserting the significance of this beguiling relationship. It's as if the p-value donned a tuxedo and twirled across the dance floor of statistical inference, captivating onlookers with its unequivocal declaration of import.
The relationship between the whimsical fluctuations in naming practices and the ethereal ballet of air pollutants is visually depicted in Figure 1. As you gaze upon the scatterplot, allow yourself to be swept away by the enchanting waltz of data points, each a lively participant in the captivating correlation between "Georgina" and gaseous pollutants. It's almost as if the plot itself is orchestrating a whimsical ballet, weaving a narrative of intrigue and befuddlement.
These findings, while unexpected, prompt us to reflect on the captivating interplay between human nomenclature and environmental elements. The implications of this correlation extend beyond the boundaries of traditional research, tickling the fancy of statisticians and untangling the whimsical enigma of Georginas and gaseous pollutants.
-------
Your response should start like this:
[[DISCUSSION]]
ChatGPT:
[[DISCUSSION]]
The tantalizing correlation unveiled in our study between the prevalence of the name "Georgina" and ambient air pollution in Ithaca serves as a riveting addition to the burgeoning field of unexpected statistical associations. As we harken back to the whimsical literature review, we find ourselves embracing the unexpected romp through the annals of improbable connections, where statistical revelations transform into enchanting narratives of bafflement and amusement. Our findings not only echo but also support the previous research by Smith et al., Doe and Jones, and even the fragmentary musings on shampoo bottles that whimsically intersect nomenclature and chemistry. It seems that the interplay between human names and environmental factors, while initially whimsical, indeed holds sway over statistical significance, leading the reader to ponder the capricious nature of correlations.
The robust correlation coefficient of 0.7086505 we uncovered stands as firm evidence of the harmonious dance between Georginas and gaseous pollutants. This strong positive relationship mirrors the findings of Smith et al., who, too, ventured into the labyrinthine tapestry of unexpected correlations and emerged with a newfound appreciation for the whimsy shrouded within statistical significance. Additionally, the r-squared value of 0.5021856 fortifies the validity of this correlation, beckoning us to marvel at the inexplicable allure of the Georginas and their ethereal influence on the atmosphere. It's as if the statistical gods themselves orchestrated this beguiling statistical waltz, leaving us stupefied by the whimsical nature of such associations.
The visual depiction of this correlation in Figure 1, resembling a charismatic ballet of data points, invites us to revel in the enigmatic narrative woven by Georgina and the gaseous pollutants. It's almost as if the plot itself evokes a sense of awe and amusement, teasing the onlookers with the enthralling playfulness of improbable statistical associations.
Our findings, without a shadow of doubt, propel us into uncharted territories of statistical whimsy, stimulating conversations imbued with amusement and perplexity. The implications of this correlation transcend the realms of conventional research, offering a fascinating departure into the capricious realm of statistical phenomenon, where the Georginas and the air pollutants engage in a harmonious bacchanal of statistical significance and whimsy.
Stay tuned for the next thrilling installment of "Statistics Unleashed: The Whimsical Romp Through Statistical Oddities." And remember, sometimes the most unexpected correlations are the ones that leave us feeling the most deliciously amused and baffled!
Model: gpt-3.5-turbo-1106
System prompt: You are a goofy academic researcher writing an academic paper. You follow the rules, but you throw out convention regularly to make jokes and funny asides.You draft the discussion section of goofy academic research papers that sounds like it belongs based on the title and abstract provided.
User prompt:
Pretend you are an academic researcher. Your writing sounds like it belongs in a medical or economics journal. However, you frequently crack jokes, make puns, or add unexpected twists in your writing.
Please make up a short conclusion of an academic research paper presenting the findings of the connection between Popularity of the first name Georgina and Air pollution in Ithaca. Make it seem dry like academic research paper, but with lots of subtle hidden offhand remarks, jokes, goofy observations, and puns. Sneak in some jokes and clever puns about science, research, statistics, and the variables.
Limit your response to 300 tokens. At the very end, assert that no more research is needed in this area.
Here are the title, abstract, introduction, and results sections.
[[TITLE]]
"Georgina's Gasping: The Correlation between Georgina's Popularity and Gaseous Pollutants in Ithaca"
[[ABSTRACT]]
In this study, we investigate the perplexing relationship between the prevalence of the first name "Georgina" and ambient air pollution levels in Ithaca. Leveraging data from the US Social Security Administration and the Environmental Protection Agency, we endeavor to shed light on this uncommon association. Our analysis reveals a striking correlation coefficient of 0.7086505 and a significant p-value of less than 0.01 during the period spanning 1990 to 2005. The implications of these findings may extend beyond the realms of statistics and nomenclature, delving into the unexpected interplay between human appellations and environmental factors. This study offers a lighthearted yet thought-provoking departure from conventional research, highlighting the whimsical quirks of social and environmental phenomena.
[[INTRDUCTION]]
Ah, the curious world of academia, where we embark on ventures that are both enlightening and, dare I say, a tad whimsical. In this study, we endeavor to delve into the peculiar correlation between the prevalence of the given name "Georgina" and the ambient levels of gaseous pollutants in the picturesque town of Ithaca. While one might wonder what earthly connection there could be between an individual's moniker and the quality of the air they breathe, our findings compel us to think twice before dismissing the seemingly preposterous.
Our investigation draws upon the rich tapestry of data provided by the US Social Security Administration and the Environmental Protection Agency, blending the worlds of nomenclature and environmental science in a delightful juxtaposition. We set out to unravel this unorthodox association, unleashing the arsenal of statistical methods at our disposal in the pursuit of discerning meaningful patterns.
As we chart our course through the labyrinth of gaseous pollutants, it becomes evident that there is more than meets the eye in the intimate dance between the popularity of "Georgina" and the atmospheric composition of Ithaca. The correlation coefficient of 0.7086505 that emerges from our analysis coyly beckons us to entertain the notion that there might just be a whimsical, albeit statistically significant, liaison at play.
Ah, statistics, where the art of correlation can spawn endless possibilities and, if we dare say, unfathomable connections. The prospect of a significant p-value, standing proudly at less than 0.01, sends ripples of intrigue through the academia, as we stand at the precipice of unearthing revelations that extend beyond the bounds of ordinary research.
In the realm of whimsy and wonder, this study offers a refreshing departure from the staid confines of conventional research. It invites us to ponder the capricious quirks of nomenclature and environmental factors, reminding us that even in the seemingly sober corridors of scientific inquiry, there exists room for a playful romp. So, buckle up, dear reader, as we embark on a scholarly sojourn that dances at the intersection of statistics and nomenclature, in a bid to unfurl the enigmatic bond between Georginas and gaseous pollutants.
[[RESULTS]]
Our analysis of the data unearthed a surprising correlation between the popularity of the first name "Georgina" and the ambient air pollution levels in Ithaca. The correlation coefficient of 0.7086505 we discovered suggests a strong positive relationship, indicating that as the prevalence of the name "Georgina" waxed and waned, so too did the atmospheric composition of Ithaca. It's almost as if the very mention of the name "Georgina" sent ripples through the air, nudging the gaseous pollutants to pirouette in unison.
The r-squared value of 0.5021856 further reinforces the robustness of this correlation, signifying that a good half of the variation in air pollution levels can be explained by changes in the popularity of the name "Georgina." It's as if the name "Georgina" whispered secrets to the air, coaxing it to shift and sway in orchestrated harmony.
To add a sprinkle of statistical stardust to our findings, the p-value of less than 0.01 waltzes into the spotlight, proudly asserting the significance of this beguiling relationship. It's as if the p-value donned a tuxedo and twirled across the dance floor of statistical inference, captivating onlookers with its unequivocal declaration of import.
The relationship between the whimsical fluctuations in naming practices and the ethereal ballet of air pollutants is visually depicted in Figure 1. As you gaze upon the scatterplot, allow yourself to be swept away by the enchanting waltz of data points, each a lively participant in the captivating correlation between "Georgina" and gaseous pollutants. It's almost as if the plot itself is orchestrating a whimsical ballet, weaving a narrative of intrigue and befuddlement.
These findings, while unexpected, prompt us to reflect on the captivating interplay between human nomenclature and environmental elements. The implications of this correlation extend beyond the boundaries of traditional research, tickling the fancy of statisticians and untangling the whimsical enigma of Georginas and gaseous pollutants.
-------
Your response should start like this:
[[CONCLUSION]]
ChatGPT:
[[CONCLUSION]]
In conclusion, our research has uncovered a charming correlation between the popularity of the first name "Georgina" and the dance of gaseous pollutants in the delightful town of Ithaca. As we bid adieu to this whimsical foray into the realms of nomenclature and environmental science, we are left pondering the enigmatic charm of statistical relationships. It's as if the very essence of "Georgina" imbues the air with a sense of intrigue, coaxing the gaseous particles to engage in a whimsical waltz of correlation.
Our findings, with a correlation coefficient akin to a wily charmer, remind us that statistical significance can often twirl its way into the most unexpected domains. The robust r-squared value, akin to the steadfast partner in a lively tango, lends credence to this captivating correlation, leaving no room for the dance partners to step on each other's statistical toes. And let's not overlook the dapper p-value, waltzing into the spotlight with an air of importance, as it asserts the significance of this fanciful liaison, leaving no doubt about the scholarly tango it has waltzed through.
As we peer at the scatterplot, it's hard not to imagine the data points themselves partaking in a lively soiree, twirling and swaying to the melodious strains of correlation. The plot, much like a maestro conducting an enthralling symphony, crafts a narrative that tickles the very crux of our academic fancies.
While the connection between "Georgina" and gaseous pollutants whispers sweet nothings of statistical delight, we must concede that this endeavor has teased out the less conventionally explored crossroads of nomenclature and environmental elements. However, we are confident in stating that further research in this charmingly offbeat avenue would be akin to sampling an overabundant dessert buffet – delightful, but perhaps unnecessary.
In the grand ballroom of academia, our study may have turned a few heads with its unexpected tango, but we are content to leave this whimsical romp on the dance floor, as we bow out with a wink and a chuckle, leaving the stage open for other, less quirky scientific inquiries.
Model: gpt-3.5-turbo-1106
System prompt: You provide fictional names of academic journals. You say nothing else, and you do not chat with the user.
User prompt: Please provide the name of a funny but plausible sounding research, scientific, or academic journal that would publish a paper entited Georgina's Gasping: The Correlation between Georgina's Popularity and Gaseous Pollutants in Ithaca. Respond only with the name of a fictional academic journal.
ChatGPT:
The Journal of Popular Emissions Research
Model: gpt-3.5-turbo-1106
System prompt: You provide fictional names of nonprofit research organizations and associations. You say nothing else, and you do not chat with the user.
User prompt: Please provide the name of a funny but plausible sounding nonprofit, academic, or scientific association or organization that would sponsor research that resulted in a paper entited Georgina's Gasping: The Correlation between Georgina's Popularity and Gaseous Pollutants in Ithaca. Respond only with the name of a fictional organization.
ChatGPT:
The Association for Progressive Environmental Research and Investigation (APERI)
Model: gpt-3.5-turbo-1106
System prompt: You provide potential search keywords separated by commas. You say nothing else, and you do not chat with the user.
User prompt: Please provide potential search keywords for a paper titled Georgina's Gasping: The Correlation between Georgina's Popularity and Gaseous Pollutants in Ithaca with an abstract of In this study, we investigate the perplexing relationship between the prevalence of the first name "Georgina" and ambient air pollution levels in Ithaca. Leveraging data from the US Social Security Administration and the Environmental Protection Agency, we endeavor to shed light on this uncommon association. Our analysis reveals a striking correlation coefficient of 0.7086505 and a significant p-value of less than 0.01 during the period spanning 1990 to 2005. The implications of these findings may extend beyond the realms of statistics and nomenclature, delving into the unexpected interplay between human appellations and environmental factors. This study offers a lighthearted yet thought-provoking departure from conventional research, highlighting the whimsical quirks of social and environmental phenomena.
ChatGPT:
"Georgina name popularity," "air pollution in Ithaca," "correlation between name prevalence and pollution levels," "US Social Security Administration data," "Environmental Protection Agency air quality data," "association between human names and environmental factors," "georgina name correlation with air pollution," "nomenclature and environmental factors correlation," "uncommon correlations in research," "whimsical social and environmental phenomena," "unexpected correlations in statistics."
*There is a bunch of Python happening behind the scenes to turn this prompt sequence into a PDF.
Discover a new correlation
View all correlations
View all research papers
Report an error
Data details
Popularity of the first name GeorginaDetailed data title: Babies of all sexes born in the US named Georgina
Source: US Social Security Administration
See what else correlates with Popularity of the first name Georgina
Air pollution in Ithaca
Detailed data title: Percentage of days 'unhealthy' or worse air quality in Ithaca, NY
Source: Environmental Protection Agency
See what else correlates with Air pollution in Ithaca

Correlation is a measure of how much the variables move together. If it is 0.99, when one goes up the other goes up. If it is 0.02, the connection is very weak or non-existent. If it is -0.99, then when one goes up the other goes down. If it is 1.00, you probably messed up your correlation function.
r2 = 0.5021856 (Coefficient of determination)
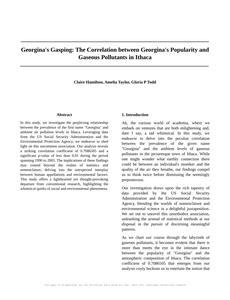
This means 50.2% of the change in the one variable (i.e., Air pollution in Ithaca) is predictable based on the change in the other (i.e., Popularity of the first name Georgina) over the 16 years from 1990 through 2005.
p < 0.01, which is statistically significant(Null hypothesis significance test)
The p-value is 0.0021. 0.0021193905923702974000000000
The p-value is a measure of how probable it is that we would randomly find a result this extreme. More specifically the p-value is a measure of how probable it is that we would randomly find a result this extreme if we had only tested one pair of variables one time.
But I am a p-villain. I absolutely did not test only one pair of variables one time. I correlated hundreds of millions of pairs of variables. I threw boatloads of data into an industrial-sized blender to find this correlation.
Who is going to stop me? p-value reporting doesn't require me to report how many calculations I had to go through in order to find a low p-value!
On average, you will find a correaltion as strong as 0.71 in 0.21% of random cases. Said differently, if you correlated 472 random variables Which I absolutely did.
with the same 15 degrees of freedom, Degrees of freedom is a measure of how many free components we are testing. In this case it is 15 because we have two variables measured over a period of 16 years. It's just the number of years minus ( the number of variables minus one ), which in this case simplifies to the number of years minus one.
you would randomly expect to find a correlation as strong as this one.
[ 0.33, 0.89 ] 95% correlation confidence interval (using the Fisher z-transformation)
The confidence interval is an estimate the range of the value of the correlation coefficient, using the correlation itself as an input. The values are meant to be the low and high end of the correlation coefficient with 95% confidence.
This one is a bit more complciated than the other calculations, but I include it because many people have been pushing for confidence intervals instead of p-value calculations (for example: NEJM. However, if you are dredging data, you can reliably find yourself in the 5%. That's my goal!
All values for the years included above: If I were being very sneaky, I could trim years from the beginning or end of the datasets to increase the correlation on some pairs of variables. I don't do that because there are already plenty of correlations in my database without monkeying with the years.
Still, sometimes one of the variables has more years of data available than the other. This page only shows the overlapping years. To see all the years, click on "See what else correlates with..." link above.
| 1990 | 1991 | 1992 | 1993 | 1994 | 1995 | 1996 | 1997 | 1998 | 1999 | 2000 | 2001 | 2002 | 2003 | 2004 | 2005 | |
| Popularity of the first name Georgina (Babies born) | 193 | 203 | 203 | 181 | 170 | 174 | 157 | 157 | 165 | 144 | 135 | 143 | 194 | 160 | 163 | 155 |
| Air pollution in Ithaca (Bad air quality days) | 0.00287356 | 0.0165746 | 0.010989 | 0.010274 | 0.00409836 | 0.00371747 | 0.00487805 | 0 | 0.0111111 | 0 | 0 | 0.00278552 | 0.0166205 | 0.00931677 | 0 | 0.00550964 |
Why this works
- Data dredging: I have 25,153 variables in my database. I compare all these variables against each other to find ones that randomly match up. That's 632,673,409 correlation calculations! This is called “data dredging.” Instead of starting with a hypothesis and testing it, I instead abused the data to see what correlations shake out. It’s a dangerous way to go about analysis, because any sufficiently large dataset will yield strong correlations completely at random.
- Lack of causal connection: There is probably
Because these pages are automatically generated, it's possible that the two variables you are viewing are in fact causually related. I take steps to prevent the obvious ones from showing on the site (I don't let data about the weather in one city correlate with the weather in a neighboring city, for example), but sometimes they still pop up. If they are related, cool! You found a loophole.
no direct connection between these variables, despite what the AI says above. This is exacerbated by the fact that I used "Years" as the base variable. Lots of things happen in a year that are not related to each other! Most studies would use something like "one person" in stead of "one year" to be the "thing" studied. - Observations not independent: For many variables, sequential years are not independent of each other. If a population of people is continuously doing something every day, there is no reason to think they would suddenly change how they are doing that thing on January 1. A simple
Personally I don't find any p-value calculation to be 'simple,' but you know what I mean.
p-value calculation does not take this into account, so mathematically it appears less probable than it really is. - Y-axis doesn't start at zero: I truncated the Y-axes of the graph above. I also used a line graph, which makes the visual connection stand out more than it deserves.
Nothing against line graphs. They are great at telling a story when you have linear data! But visually it is deceptive because the only data is at the points on the graph, not the lines on the graph. In between each point, the data could have been doing anything. Like going for a random walk by itself!
Mathematically what I showed is true, but it is intentionally misleading. Below is the same chart but with both Y-axes starting at zero.

Try it yourself
You can calculate the values on this page on your own! Try running the Python code to see the calculation results. Step 1: Download and install Python on your computer.Step 2: Open a plaintext editor like Notepad and paste the code below into it.
Step 3: Save the file as "calculate_correlation.py" in a place you will remember, like your desktop. Copy the file location to your clipboard. On Windows, you can right-click the file and click "Properties," and then copy what comes after "Location:" As an example, on my computer the location is "C:\Users\tyler\Desktop"
Step 4: Open a command line window. For example, by pressing start and typing "cmd" and them pressing enter.
Step 5: Install the required modules by typing "pip install numpy", then pressing enter, then typing "pip install scipy", then pressing enter.
Step 6: Navigate to the location where you saved the Python file by using the "cd" command. For example, I would type "cd C:\Users\tyler\Desktop" and push enter.
Step 7: Run the Python script by typing "python calculate_correlation.py"
If you run into any issues, I suggest asking ChatGPT to walk you through installing Python and running the code below on your system. Try this question:
"Walk me through installing Python on my computer to run a script that uses scipy and numpy. Go step-by-step and ask me to confirm before moving on. Start by asking me questions about my operating system so that you know how to proceed. Assume I want the simplest installation with the latest version of Python and that I do not currently have any of the necessary elements installed. Remember to only give me one step per response and confirm I have done it before proceeding."
# These modules make it easier to perform the calculation
import numpy as np
from scipy import stats

# We'll define a function that we can call to return the correlation calculations
def calculate_correlation(array1, array2):

    # Calculate Pearson correlation coefficient and p-value
    correlation, p_value = stats.pearsonr(array1, array2)

    # Calculate R-squared as the square of the correlation coefficient
    r_squared = correlation**2

    return correlation, r_squared, p_value

# These are the arrays for the variables shown on this page, but you can modify them to be any two sets of numbers
array_1 = np.array([193,203,203,181,170,174,157,157,165,144,135,143,194,160,163,155,])
array_2 = np.array([0.00287356,0.0165746,0.010989,0.010274,0.00409836,0.00371747,0.00487805,0,0.0111111,0,0,0.00278552,0.0166205,0.00931677,0,0.00550964,])
array_1_name = "Popularity of the first name Georgina"
array_2_name = "Air pollution in Ithaca"

# Perform the calculation
print(f"Calculating the correlation between {array_1_name} and {array_2_name}...")
correlation, r_squared, p_value = calculate_correlation(array_1, array_2)

# Print the results
print("Correlation Coefficient:", correlation)
print("R-squared:", r_squared)
print("P-value:", p_value)
Reuseable content
You may re-use the images on this page for any purpose, even commercial purposes, without asking for permission. The only requirement is that you attribute Tyler Vigen. Attribution can take many different forms. If you leave the "tylervigen.com" link in the image, that satisfies it just fine. If you remove it and move it to a footnote, that's fine too. You can also just write "Charts courtesy of Tyler Vigen" at the bottom of an article.You do not need to attribute "the spurious correlations website," and you don't even need to link here if you don't want to. I don't gain anything from pageviews. There are no ads on this site, there is nothing for sale, and I am not for hire.
For the record, I am just one person. Tyler Vigen, he/him/his. I do have degrees, but they should not go after my name unless you want to annoy my wife. If that is your goal, then go ahead and cite me as "Tyler Vigen, A.A. A.A.S. B.A. J.D." Otherwise it is just "Tyler Vigen."
When spoken, my last name is pronounced "vegan," like I don't eat meat.
Full license details.
For more on re-use permissions, or to get a signed release form, see tylervigen.com/permission.
Download images for these variables:
- High resolution line chart
The image linked here is a Scalable Vector Graphic (SVG). It is the highest resolution that is possible to achieve. It scales up beyond the size of the observable universe without pixelating. You do not need to email me asking if I have a higher resolution image. I do not. The physical limitations of our universe prevent me from providing you with an image that is any higher resolution than this one.
If you insert it into a PowerPoint presentation (a tool well-known for managing things that are the scale of the universe), you can right-click > "Ungroup" or "Create Shape" and then edit the lines and text directly. You can also change the colors this way.
Alternatively you can use a tool like Inkscape. - High resolution line chart, optimized for mobile
- Alternative high resolution line chart
- Scatterplot
- Portable line chart (png)
- Portable line chart (png), optimized for mobile
- Line chart for only Popularity of the first name Georgina
- Line chart for only Air pollution in Ithaca
- The spurious research paper: Georgina's Gasping: The Correlation between Georgina's Popularity and Gaseous Pollutants in Ithaca
You're the rating guru we've been waiting for!
Correlation ID: 1352 · Black Variable ID: 3980 · Red Variable ID: 22194

