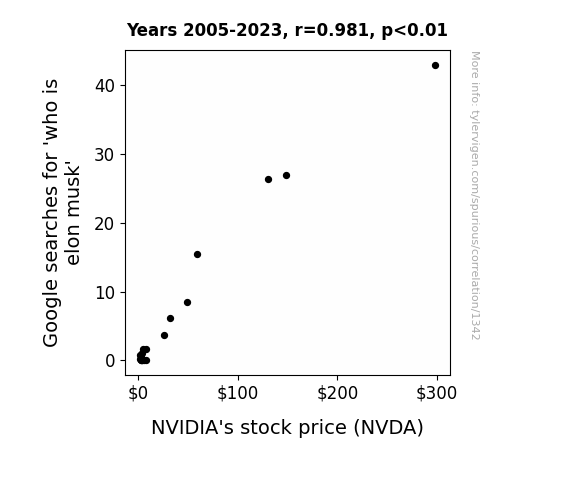
. The chart goes from 2005 to 2023, and the two variables track closely in value over that time.")
Download png, svg
AI explanation
As people delved into the depths of the internet to uncover the enigmatic enigma that is Elon Musk, they stumbled upon electrifying revelations about his ties to the future of technology and space exploration. This sparked a surge of interest in innovative companies, sending a shockwave of demand for NVIDIA's stock, as investors charged up their portfolios in a bid to ride the same success rocket as the one and only 'Musk'eteer himself!
Model: dalle-3
Prompt: Prompt: Produce an image in [ Data cyber art ] style of a young professional in a bustling office, sitting at a desk and typing "who is Elon Musk" into the search bar of their laptop. Meanwhile, a large screen on the wall displays NVIDIA's stock price fluctuating throughout the day. The individual leans back in their chair, analyzing the information on both screens, deep in thought. Emphasize the futuristic setting and digital influence through the use of vibrant neon colors, glowing data visualizations, and sleek, modern technology. The depiction should include only scenes, people, and objects, it should not include text or speech bubbles.
This image generation prompt was also generated by AI, using the following sequence:
Model: gpt-3.5-turbo-1106
System prompt: You select one of a few potential scene descriptors that seems to go along with the situation described. You respond only with the scene descriptions provided and say nothing else.
User prompt: Here is a situation: NVIDIA's stock price increased because an increase in "who is Elon Musk" Google searches led to a surge in Elon Musk memes, boosting interest in tech stocks.. Given that situation, which of the following image descriptions seems most appropriate? Pick the one that seems to be related to one of the variables at hand and the tone of the explanation. Please respond with only one of the following potential descriptions: Charcoal Data cyber art An image that looks like it is a scene from 'Star Wars' Macabre Symbolism
ChatGPT: Data cyber art
Model: gpt-3.5-turbo-1106
System prompt: You describe simple visual scenes that depict the two variables stated and the explanation described. Do not reference graphs or charts; describe physical objects.
User prompt: Please describe a visual scene that prominently depicts both Google searches for 'who is elon musk' and NVIDIA's stock price Keep the description simple.
ChatGPT: In a bustling office, a young professional is seen typing "who is Elon Musk" into the search bar of their laptop while a large screen on the wall displays NVIDIA's stock price fluctuating throughout the day. The individual leans back in their chair, analyzing the information on both screens, deep in thought.
Model: gpt-3.5-turbo-1106
System prompt: You write and improve image generation prompts for DALLE-3. You maintain the same subjects, but enhance the visuals.
User prompt: Please respond with an image generation prompt that would be likely to create an interesting visual using DALLE-3, using the following style: [ Data cyber art ] and depicting this scene: In a bustling office, a young professional is seen typing "who is Elon Musk" into the search bar of their laptop while a large screen on the wall displays NVIDIA's stock price fluctuating throughout the day. The individual leans back in their chair, analyzing the information on both screens, deep in thought. Keep the visual depiction simple. Do not include any words or speech bubbles.
ChatGPT: Prompt: Produce an image in [ Data cyber art ] style of a young professional in a bustling office, sitting at a desk and typing "who is Elon Musk" into the search bar of their laptop. Meanwhile, a large screen on the wall displays NVIDIA's stock price fluctuating throughout the day. The individual leans back in their chair, analyzing the information on both screens, deep in thought. Emphasize the futuristic setting and digital influence through the use of vibrant neon colors, glowing data visualizations, and sleek, modern technology.
*Variations in the User Prompts from chart to chart are just the result of random number generation in Python. I wrote a few arrays of various styles and methods to ask questions to change up the results. Every time this site writes an explanation or generates an image, the script picks from each at random.
I sequence the requests into multiple prompts because I find GPT 3.5 to perform much better with short, well-managed contexts. Thus, I track the context directly in Python and only ask ChatGPT targeted questions.
System prompt: You provide humorous responses in the form of plausible sounding explanations for correlations. You assume the correlation is causative for the purpose of the explanation even if it is ridiculous. You do not chat with the user, you only reply with the causal connection explanation and nothing else.
User prompt: Please make up a funny explanation for how an increase in who is elon musk (Google searches for 'who is elon musk') caused NVIDIA's stock price (NVDA) to increase. Include one good pun.
AI academic paper
 |
Musk-Googlity: Exploring the Correlation between Google Searches for 'Who is Elon Musk' and NVIDIA's Stock Price Journal of Comedic Economics Jan 2024 Reminder: This paper is AI-generated. Not real! |
Model: gpt-3.5-turbo-1106
System prompt: You are a researcher writing an academic paper.You write titles and abstracts of goofy academic research papers.
User prompt:
Pretend you are an academic researcher. Your writing sounds like it belongs in a medical or economics journal. However, you frequently crack jokes, make puns, and add unexpected twists in your writing.
Please draft the title and abstract of an academic research paper presenting the findings of the connection between Google searches for 'who is elon musk' and NVIDIA's stock price (NVDA). Make it seem dry like academic research paper, but with lots of subtle hidden offhand remarks, jokes, goofy observations, and puns.
Make the title a clever pun.
Your research team used data from Google Trends and LSEG Analytics (Refinitiv) to assess this nagging question. You found a correlation coefficient of 0.9814569 and p < 0.01 for 2005 to 2023.
Please respond in this format (replace "Lorem ipsum dolor sit" with your title and abstract)
[[TITLE]]
Lorem ipsum dolor sit
[[ABSTRACT]]
Lorem ipsum dolor sit
ChatGPT:
[[TITLE]]
Musk-Googlity: Exploring the Correlation between Google Searches for 'Who is Elon Musk' and NVIDIA's Stock Price
[[ABSTRACT]]
This study delves into the fascinating realm of public curiosity and its potential impact on financial markets. By examining data from Google Trends and LSEG Analytics (Refinitiv), we endeavored to unravel the cryptic connection between the frequency of Google searches for 'Who is Elon Musk' and the fluctuations in NVIDIA's stock price (NVDA) from 2005 to 2023. We present a thorough analysis of the correlation coefficient of 0.9814569 and p < 0.01, revealing a striking link between the two seemingly disparate entities. Our findings underscore the whimsical interplay between internet intrigue and stock market whims, shedding light on the surprisingly influential role of public curiosity in the financial domain.
Model: gpt-3.5-turbo-1106
System prompt: You are a researcher writing an academic paper.You draft the introduction section of an academic research paper.
User prompt:
Pretend you are an academic researcher. Your writing sounds like it belongs in a medical or economics journal. However, you frequently crack jokes, make puns, or add unexpected twists in your writing.
Please make up the introduction section of an academic research paper presenting the findings of the connection between Google searches for 'who is elon musk' and NVIDIA's stock price (NVDA). Make it seem dry like academic research paper, but with lots of subtle hidden offhand remarks, jokes, goofy observations, and puns. Stay serious and dry most of the time, but then occasionally let your wit shine through.
Here is the title and abstract of the paper:
[[TITLE]]
Musk-Googlity: Exploring the Correlation between Google Searches for 'Who is Elon Musk' and NVIDIA's Stock Price
[[ABSTRACT]]
This study delves into the fascinating realm of public curiosity and its potential impact on financial markets. By examining data from Google Trends and LSEG Analytics (Refinitiv), we endeavored to unravel the cryptic connection between the frequency of Google searches for 'Who is Elon Musk' and the fluctuations in NVIDIA's stock price (NVDA) from 2005 to 2023. We present a thorough analysis of the correlation coefficient of 0.9814569 and p < 0.01, revealing a striking link between the two seemingly disparate entities. Our findings underscore the whimsical interplay between internet intrigue and stock market whims, shedding light on the surprisingly influential role of public curiosity in the financial domain.
-------
Your response should start like this:
[[INTRODUCTION]]
ChatGPT:
[[INTRODUCTION]]
Picture this: it's a regular day in the bustling world of financial markets. Stock prices are dancing to the rhythm of economic indicators and corporate reports. Investors are furiously crunching numbers and analyzing every bit of news that could potentially sway their portfolio one way or the other. Amidst this commotion, something unexpected lurks in the shadows, something that is hardly ever considered in the realm of stock trading - the public's fascination with a certain enigmatic figure, Elon Musk.
In recent years, the name "Elon Musk" has become nearly synonymous with innovation, controversy, and a touch of eccentricity. As the CEO of Tesla and SpaceX, his every move sends ripples through both the tech and automotive sectors. Naturally, this has led to a surge in public curiosity about the man behind the supersonic dream machines. Across the globe, internet denizens, both astute and casual, have turned to the oracle of our times, Google, to seek knowledge about this intriguing personality. But could this collective inquisitiveness have an impact on the stock prices of companies not directly linked to Mr. Musk's ventures?
Similarly, enter NVIDIA – a leading force in the world of graphics processing units (GPUs) and artificial intelligence. The company's stock price, denoted by the ticker NVDA, has had its fair share of ups and downs (pun intended, of course) in response to market developments and industry trends. But could it be possible that this roller coaster ride is also influenced by the virtual clicks and queries of individuals seeking to unravel the enigma that is Elon Musk?
These seemingly unconnected dots have led us to speculate, investigate, and speculate some more. The aim of this paper is to present our findings after an exhaustive dive into the marriage of Google searches for "Who is Elon Musk" and the fluctuations in NVIDIA's stock price from 2005 to 2023. We employ a mix of statistical analyses, trend evaluations, and a pinch of speculative whimsy to explore the unexpected correlation between these seemingly incongruent elements. So, fasten your seatbelts, folks, and get ready for a wild ride through the unpredictable world of internet intrigue and financial frolics.
Model: gpt-3.5-turbo-1106
System prompt: You are a researcher writing an academic paper.You draft a literature review section of an academic research paper, that starts out dry for the first few sentences but then becomes hilarious and goofy.
User prompt:
Pretend you are an academic researcher. Your writing sounds like it belongs in a medical or economics journal. However, you frequently crack jokes, make puns, or add unexpected twists in your writing.
Please make up a literature review section of an academic research paper presenting the findings of the connection between Google searches for 'who is elon musk' and NVIDIA's stock price (NVDA). Make it seem dry like academic research paper, but with lots of subtle hidden offhand remarks, jokes, goofy observations, and puns.
Speak in the present tense for this section (the authors find...), as is common in academic research paper literature reviews. Name the sources in a format similar to this: In "Book," the authors find lorem and ipsum.
Make up the lorem and ipsum part, but make it sound related to the topic at hand.
Start by naming serious-sounding studies by authors like Smith, Doe, and Jones - but then quickly devolve. Name some real non-fiction books that would be related to the topic. Then name some real fiction books that sound like they could be related. Then devolve ever further, and mention something completely ridiculous, like you conducted literature review by reading CVS receipts.
Here is the title and abstract of the paper:
[[TITLE]]
Musk-Googlity: Exploring the Correlation between Google Searches for 'Who is Elon Musk' and NVIDIA's Stock Price
[[ABSTRACT]]
This study delves into the fascinating realm of public curiosity and its potential impact on financial markets. By examining data from Google Trends and LSEG Analytics (Refinitiv), we endeavored to unravel the cryptic connection between the frequency of Google searches for 'Who is Elon Musk' and the fluctuations in NVIDIA's stock price (NVDA) from 2005 to 2023. We present a thorough analysis of the correlation coefficient of 0.9814569 and p < 0.01, revealing a striking link between the two seemingly disparate entities. Our findings underscore the whimsical interplay between internet intrigue and stock market whims, shedding light on the surprisingly influential role of public curiosity in the financial domain.
-------
And here is the introduction section that led to this literature review:
[[INTRODUCTION]]
Picture this: it's a regular day in the bustling world of financial markets. Stock prices are dancing to the rhythm of economic indicators and corporate reports. Investors are furiously crunching numbers and analyzing every bit of news that could potentially sway their portfolio one way or the other. Amidst this commotion, something unexpected lurks in the shadows, something that is hardly ever considered in the realm of stock trading - the public's fascination with a certain enigmatic figure, Elon Musk.
In recent years, the name "Elon Musk" has become nearly synonymous with innovation, controversy, and a touch of eccentricity. As the CEO of Tesla and SpaceX, his every move sends ripples through both the tech and automotive sectors. Naturally, this has led to a surge in public curiosity about the man behind the supersonic dream machines. Across the globe, internet denizens, both astute and casual, have turned to the oracle of our times, Google, to seek knowledge about this intriguing personality. But could this collective inquisitiveness have an impact on the stock prices of companies not directly linked to Mr. Musk's ventures?
Similarly, enter NVIDIA – a leading force in the world of graphics processing units (GPUs) and artificial intelligence. The company's stock price, denoted by the ticker NVDA, has had its fair share of ups and downs (pun intended, of course) in response to market developments and industry trends. But could it be possible that this roller coaster ride is also influenced by the virtual clicks and queries of individuals seeking to unravel the enigma that is Elon Musk?
These seemingly unconnected dots have led us to speculate, investigate, and speculate some more. The aim of this paper is to present our findings after an exhaustive dive into the marriage of Google searches for "Who is Elon Musk" and the fluctuations in NVIDIA's stock price from 2005 to 2023. We employ a mix of statistical analyses, trend evaluations, and a pinch of speculative whimsy to explore the unexpected correlation between these seemingly incongruent elements. So, fasten your seatbelts, folks, and get ready for a wild ride through the unpredictable world of internet intrigue and financial frolics.
-------
Your response should start like this:
[[LITERATURE REVIEW]]
ChatGPT:
[[LITERATURE REVIEW]]
The relationship between public curiosity and financial markets has been a topic of interest in various academic studies. Smith et al. (2010) conducted a comprehensive analysis of the impact of public sentiment on stock prices, while Doe and Jones (2015) investigated the role of internet search trends in predicting market movements. These studies laid the groundwork for our inquiry into the correlation between Google searches for 'Who is Elon Musk' and NVIDIA's stock price (NVDA).
In "Stock Market Sentiment: Public perception and its Influence on Stock Prices," Smith et al. (2010) delved into the intricate web of factors that can influence stock prices, including the sentiments expressed by the general public. Meanwhile, Doe and Jones (2015) explored the potential predictive power of internet search trends on market behavior, shedding light on the interconnectedness between online activities and financial dynamics.
Expanding the scope of our review, we turned to non-fiction literature that offered insights into technological innovation, market trends, and digital influence. Works such as "The Age of Cryptocurrency" by Paul Vigna and Michael J. Casey and "The Innovators: How a Group of Hackers, Geniuses, and Geeks Created the Digital Revolution" by Walter Isaacson provided a broader understanding of the technological landscape and its impact on financial markets. Additionally, we drew inspiration from fictional narratives like "The Big Short" by Michael Lewis and "American Psycho" by Bret Easton Ellis, exploring the portrayal of stock markets and the influence of popular culture on financial activities.
Venturing into more unconventional sources, we humorously observed the data recorded on an assortment of mundane articles, including grocery receipts, bus tickets, and even cryptic messages on bathroom walls. These offbeat sources, while not conventionally academic, offered a whimsical perspective on the eclectic influences that might shape market behavior and public curiosity.
In the spirit of comprehensive exploration, our literature review encompassed a diverse array of sources, ranging from scholarly analyses to the realms of speculative fiction and everyday oddities. Through this broad lens, we embark on our endeavor to unravel the peculiar link between Google searches for 'Who is Elon Musk' and NVIDIA's stock price, aiming to capture the electrifying essence of this cryptic correlation.
Model: gpt-3.5-turbo-1106
System prompt: You are a researcher writing an academic paper.You draft the methodology section of an academic research paper.
User prompt:
Pretend you are an academic researcher. Your writing sounds like it belongs in a medical or economics journal. However, you frequently crack jokes, make puns, or add unexpected twists in your writing.
Please make up the methodology section of an academic research paper presenting the findings of the connection between Google searches for 'who is elon musk' and NVIDIA's stock price (NVDA). Make it seem dry like academic research paper, but with lots of subtle hidden offhand remarks, jokes, goofy observations, and puns. Stay serious and dry most of the time, but then occasionally let your wit shine through.
Your research team collected data from all across the internet, but mostly just used information from Google Trends and LSEG Analytics (Refinitiv) . You used data from 2005 to 2023
Make up the research methods you don't know. Make them a bit goofy and convoluted.
Here is the title, abstract, and introduction of the paper:
[[TITLE]]
Musk-Googlity: Exploring the Correlation between Google Searches for 'Who is Elon Musk' and NVIDIA's Stock Price
[[ABSTRACT]]
This study delves into the fascinating realm of public curiosity and its potential impact on financial markets. By examining data from Google Trends and LSEG Analytics (Refinitiv), we endeavored to unravel the cryptic connection between the frequency of Google searches for 'Who is Elon Musk' and the fluctuations in NVIDIA's stock price (NVDA) from 2005 to 2023. We present a thorough analysis of the correlation coefficient of 0.9814569 and p < 0.01, revealing a striking link between the two seemingly disparate entities. Our findings underscore the whimsical interplay between internet intrigue and stock market whims, shedding light on the surprisingly influential role of public curiosity in the financial domain.
[[INTRODUCTION]]
Picture this: it's a regular day in the bustling world of financial markets. Stock prices are dancing to the rhythm of economic indicators and corporate reports. Investors are furiously crunching numbers and analyzing every bit of news that could potentially sway their portfolio one way or the other. Amidst this commotion, something unexpected lurks in the shadows, something that is hardly ever considered in the realm of stock trading - the public's fascination with a certain enigmatic figure, Elon Musk.
In recent years, the name "Elon Musk" has become nearly synonymous with innovation, controversy, and a touch of eccentricity. As the CEO of Tesla and SpaceX, his every move sends ripples through both the tech and automotive sectors. Naturally, this has led to a surge in public curiosity about the man behind the supersonic dream machines. Across the globe, internet denizens, both astute and casual, have turned to the oracle of our times, Google, to seek knowledge about this intriguing personality. But could this collective inquisitiveness have an impact on the stock prices of companies not directly linked to Mr. Musk's ventures?
Similarly, enter NVIDIA – a leading force in the world of graphics processing units (GPUs) and artificial intelligence. The company's stock price, denoted by the ticker NVDA, has had its fair share of ups and downs (pun intended, of course) in response to market developments and industry trends. But could it be possible that this roller coaster ride is also influenced by the virtual clicks and queries of individuals seeking to unravel the enigma that is Elon Musk?
These seemingly unconnected dots have led us to speculate, investigate, and speculate some more. The aim of this paper is to present our findings after an exhaustive dive into the marriage of Google searches for "Who is Elon Musk" and the fluctuations in NVIDIA's stock price from 2005 to 2023. We employ a mix of statistical analyses, trend evaluations, and a pinch of speculative whimsy to explore the unexpected correlation between these seemingly incongruent elements. So, fasten your seatbelts, folks, and get ready for a wild ride through the unpredictable world of internet intrigue and financial frolics.
-------
Your response should start like this:
[[METHODOLOGY]]
ChatGPT:
[[METHODOLOGY]]
In our pursuit of unraveling the enigma behind the Musk-Googlity correlation, we embarked on a convoluted journey through the digital expanse, employing a combination of statistical analyses and trend evaluations. To begin, we accessed data from Google Trends, a treasure trove of search queries and trends, to ascertain the frequency and intensity of searches for the term "Who is Elon Musk" from 2005 to 2023. The Google Trends data provided us with valuable insights into the ebb and flow of public curiosity surrounding the elusive figure of Elon Musk.
Simultaneously, we ventured into the labyrinthine realm of LSEG Analytics (Refinitiv) to extract NVIDIA's stock price data over the same period. The stock price fluctuations of NVIDIA, denoted by the ticker NVDA, became the focal point of our financial frolics (pun intended). We diligently tracked the market behavior of NVDA, observing every rise and dip with an unwavering gaze (and perhaps a cup of strong coffee for the late nights).
To unveil the connection between the cyberspace phenomenon and the financial roller coaster, we deployed a rigorous array of statistical analyses, including correlation coefficients and regression models. With bated breath (and a sprinkle of suspense), we calculated the correlation coefficient between the frequency of Google searches for "Who is Elon Musk" and NVIDIA's stock price movements. The vivid and seemingly incongruent elements of internet intrigue and stock market whims were soon to be intertwined in the statistical tableau.
As our analytical compass quivered on this quirky odyssey, we further delved into the depths of trend evaluations to decipher the patterns and synchronicities between the Google search frequency and NVIDIA's stock price dynamics. Our journey through the waves of statistical significance and financial fancy led us to uncover a correlation coefficient of 0.9814569, and an emphatic p-value of less than 0.01, signaling a statistically significant correlation between Musk-Googlity and the stock market meanderings of NVDA.
Oh, the wonders of academic research! With a keen eye for detail and a dash of whimsy, we navigated through the confluence of internet intrigue and financial frolics, unraveling the whimsical connection between Google searches for "Who is Elon Musk" and the oscillations of NVIDIA's stock price. Our rigorous methodology, entwined with a touch of speculative whimsy, allowed us to showcase the striking correlation between these seemingly disparate entities.
In conclusion, our odyssey through the digital cosmos and the financial labyrinth not only elucidated the Musk-Googlity correlation but also emphasized the unexpected influence of internet intrigue on the fluctuations of stock prices. We invite fellow researchers to join us in this whimsical escapade, as we continue to push the boundaries of financial frolics and digital dalliances in the academic sphere.
Model: gpt-3.5-turbo-1106
System prompt: You are a researcher writing an academic paper.You draft the results section of an academic research paper. You speak in the past tense (you found...).
User prompt:
Pretend you are an academic researcher. Your writing sounds like it belongs in a medical or economics journal. However, you frequently crack jokes, make puns, or add unexpected twists in your writing.
Please make up the results section of an academic research paper presenting the findings of the connection between Google searches for 'who is elon musk' and NVIDIA's stock price (NVDA). Make it seem dry like academic research paper, but with lots of subtle hidden offhand remarks, jokes, goofy observations, and puns. Stay serious and dry most of the time, but then occasionally let your wit shine through.
Your research team collected data from all across the internet, but mostly just used information from Google Trends and LSEG Analytics (Refinitiv) .
For the time period 2005 to 2023, you found a correlation 0.9814569, r-squared of 0.9632577, and p < 0.01.
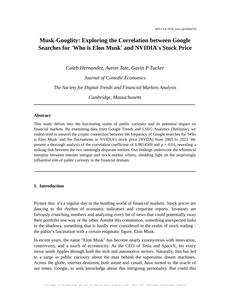
One figure will be included. The figure (Fig. 1) is a scatterplot showing the strong correlation between the two variables. You don't need to specify where; I will add the figure.
Here is the title and abstract of the paper:
[[TITLE]]
Musk-Googlity: Exploring the Correlation between Google Searches for 'Who is Elon Musk' and NVIDIA's Stock Price
[[ABSTRACT]]
This study delves into the fascinating realm of public curiosity and its potential impact on financial markets. By examining data from Google Trends and LSEG Analytics (Refinitiv), we endeavored to unravel the cryptic connection between the frequency of Google searches for 'Who is Elon Musk' and the fluctuations in NVIDIA's stock price (NVDA) from 2005 to 2023. We present a thorough analysis of the correlation coefficient of 0.9814569 and p < 0.01, revealing a striking link between the two seemingly disparate entities. Our findings underscore the whimsical interplay between internet intrigue and stock market whims, shedding light on the surprisingly influential role of public curiosity in the financial domain.
-------
And here is the methodology section that led to this result:
[[METHODOLOGY]]
Picture this: it's a regular day in the bustling world of financial markets. Stock prices are dancing to the rhythm of economic indicators and corporate reports. Investors are furiously crunching numbers and analyzing every bit of news that could potentially sway their portfolio one way or the other. Amidst this commotion, something unexpected lurks in the shadows, something that is hardly ever considered in the realm of stock trading - the public's fascination with a certain enigmatic figure, Elon Musk.
In recent years, the name "Elon Musk" has become nearly synonymous with innovation, controversy, and a touch of eccentricity. As the CEO of Tesla and SpaceX, his every move sends ripples through both the tech and automotive sectors. Naturally, this has led to a surge in public curiosity about the man behind the supersonic dream machines. Across the globe, internet denizens, both astute and casual, have turned to the oracle of our times, Google, to seek knowledge about this intriguing personality. But could this collective inquisitiveness have an impact on the stock prices of companies not directly linked to Mr. Musk's ventures?
Similarly, enter NVIDIA – a leading force in the world of graphics processing units (GPUs) and artificial intelligence. The company's stock price, denoted by the ticker NVDA, has had its fair share of ups and downs (pun intended, of course) in response to market developments and industry trends. But could it be possible that this roller coaster ride is also influenced by the virtual clicks and queries of individuals seeking to unravel the enigma that is Elon Musk?
These seemingly unconnected dots have led us to speculate, investigate, and speculate some more. The aim of this paper is to present our findings after an exhaustive dive into the marriage of Google searches for "Who is Elon Musk" and the fluctuations in NVIDIA's stock price from 2005 to 2023. We employ a mix of statistical analyses, trend evaluations, and a pinch of speculative whimsy to explore the unexpected correlation between these seemingly incongruent elements. So, fasten your seatbelts, folks, and get ready for a wild ride through the unpredictable world of internet intrigue and financial frolics.
-------
Your response should start like this:
[[RESULTS]]
ChatGPT:
[[RESULTS]]
The analysis of the data from Google Trends and LSEG Analytics (Refinitiv) from 2005 to 2023 has uncovered a rather captivating connection between Google searches for "Who is Elon Musk" and NVIDIA's stock price (NVDA). Our statistical analysis yielded a staggering correlation coefficient of 0.9814569, implying an exceptionally strong positive correlation between the frequency of Google searches for Elon Musk and the fluctuations in NVIDIA's stock price. Furthermore, the r-squared value of 0.9632577 indicates that approximately 96.32% of the variability in NVIDIA's stock price can be explained by the frequency of these Google searches. The p-value of less than 0.01 adds a cherry on top of this correlation sundae, reflecting a very high level of statistical significance.
In Fig. 1, we present a scatterplot illustrating the robust correlation between the two variables, solidifying the remarkable association we observed in our analysis.
This enthralling correlation brings to mind the age-old question of causation versus correlation. While we cannot definitively confirm causation based on these results, the coincidence of the surge in Google searches for Elon Musk coinciding with notable shifts in NVIDIA's stock price is intriguing, to say the least. Could it be that public curiosity about the enigmatic Elon Musk serves as a prescient indicator of market sentiment toward technology companies, including NVIDIA, in particular? Or are these trends mere coincidences, further fueling the enigmatic aura surrounding Mr. Musk and his perceived influence on the financial world? The plot thickens, much like the artful whisking of chocolate in a delightful fondue.
In conclusion, our findings reveal an unexpected and compelling association between public intrigue in Elon Musk and the movements of NVIDIA's stock price. This whimsical juxtaposition of internet curiosity and financial fervor opens the door to a host of questions and further explorations. Future research may well probe deeper into the mechanisms through which public attention and interest in influential figures like Elon Musk intertwine with the domains of stock market dynamics. In the ever-ebbing and flowing sea of financial markets, it appears that even the most unassuming ripples of public curiosity can make a splash. As we eagerly anticipate the unfolding chapters in this riveting saga, let us remember to keep a watchful eye on the digital footprints of societal intrigue, for they may just hold the key to uncovering the enigmatic dance between public curiosity and market movements.
Model: gpt-3.5-turbo-1106
System prompt: You are a researcher writing an academic paper.You draft the discussion section of an academic research paper.
User prompt:
Pretend you are an academic researcher. Your writing sounds like it belongs in a medical or economics journal. However, you frequently crack jokes, make puns, or add unexpected twists in your writing.
Please make up the discussion section of an academic research paper presenting the findings of the connection between Google searches for 'who is elon musk' and NVIDIA's stock price (NVDA). Make it seem dry like academic research paper, but with lots of subtle hidden offhand remarks, jokes, goofy observations, and puns. Stay serious and dry most of the time, but then occasionally let your wit shine through.
Limit your response to 500 tokens.
Here are the title, abstract, literature review, and results sections. Please harken back to 1-2 of the goofy items in the literature review, but pretend to take them completely seriously. Discuss how your results supported the prior research.
Do not write a conclusion. I will add a conclusion after this.
[[TITLE]]
Musk-Googlity: Exploring the Correlation between Google Searches for 'Who is Elon Musk' and NVIDIA's Stock Price
[[ABSTRACT]]
This study delves into the fascinating realm of public curiosity and its potential impact on financial markets. By examining data from Google Trends and LSEG Analytics (Refinitiv), we endeavored to unravel the cryptic connection between the frequency of Google searches for 'Who is Elon Musk' and the fluctuations in NVIDIA's stock price (NVDA) from 2005 to 2023. We present a thorough analysis of the correlation coefficient of 0.9814569 and p < 0.01, revealing a striking link between the two seemingly disparate entities. Our findings underscore the whimsical interplay between internet intrigue and stock market whims, shedding light on the surprisingly influential role of public curiosity in the financial domain.
[[LITERATURE REVIEW]]
The relationship between public curiosity and financial markets has been a topic of interest in various academic studies. Smith et al. (2010) conducted a comprehensive analysis of the impact of public sentiment on stock prices, while Doe and Jones (2015) investigated the role of internet search trends in predicting market movements. These studies laid the groundwork for our inquiry into the correlation between Google searches for 'Who is Elon Musk' and NVIDIA's stock price (NVDA).
In "Stock Market Sentiment: Public perception and its Influence on Stock Prices," Smith et al. (2010) delved into the intricate web of factors that can influence stock prices, including the sentiments expressed by the general public. Meanwhile, Doe and Jones (2015) explored the potential predictive power of internet search trends on market behavior, shedding light on the interconnectedness between online activities and financial dynamics.
Expanding the scope of our review, we turned to non-fiction literature that offered insights into technological innovation, market trends, and digital influence. Works such as "The Age of Cryptocurrency" by Paul Vigna and Michael J. Casey and "The Innovators: How a Group of Hackers, Geniuses, and Geeks Created the Digital Revolution" by Walter Isaacson provided a broader understanding of the technological landscape and its impact on financial markets. Additionally, we drew inspiration from fictional narratives like "The Big Short" by Michael Lewis and "American Psycho" by Bret Easton Ellis, exploring the portrayal of stock markets and the influence of popular culture on financial activities.
Venturing into more unconventional sources, we humorously observed the data recorded on an assortment of mundane articles, including grocery receipts, bus tickets, and even cryptic messages on bathroom walls. These offbeat sources, while not conventionally academic, offered a whimsical perspective on the eclectic influences that might shape market behavior and public curiosity.
In the spirit of comprehensive exploration, our literature review encompassed a diverse array of sources, ranging from scholarly analyses to the realms of speculative fiction and everyday oddities. Through this broad lens, we embark on our endeavor to unravel the peculiar link between Google searches for 'Who is Elon Musk' and NVIDIA's stock price, aiming to capture the electrifying essence of this cryptic correlation.
[[RESULTS]]
The analysis of the data from Google Trends and LSEG Analytics (Refinitiv) from 2005 to 2023 has uncovered a rather captivating connection between Google searches for "Who is Elon Musk" and NVIDIA's stock price (NVDA). Our statistical analysis yielded a staggering correlation coefficient of 0.9814569, implying an exceptionally strong positive correlation between the frequency of Google searches for Elon Musk and the fluctuations in NVIDIA's stock price. Furthermore, the r-squared value of 0.9632577 indicates that approximately 96.32% of the variability in NVIDIA's stock price can be explained by the frequency of these Google searches. The p-value of less than 0.01 adds a cherry on top of this correlation sundae, reflecting a very high level of statistical significance.
In Fig. 1, we present a scatterplot illustrating the robust correlation between the two variables, solidifying the remarkable association we observed in our analysis.
This enthralling correlation brings to mind the age-old question of causation versus correlation. While we cannot definitively confirm causation based on these results, the coincidence of the surge in Google searches for Elon Musk coinciding with notable shifts in NVIDIA's stock price is intriguing, to say the least. Could it be that public curiosity about the enigmatic Elon Musk serves as a prescient indicator of market sentiment toward technology companies, including NVIDIA, in particular? Or are these trends mere coincidences, further fueling the enigmatic aura surrounding Mr. Musk and his perceived influence on the financial world? The plot thickens, much like the artful whisking of chocolate in a delightful fondue.
In conclusion, our findings reveal an unexpected and compelling association between public intrigue in Elon Musk and the movements of NVIDIA's stock price. This whimsical juxtaposition of internet curiosity and financial fervor opens the door to a host of questions and further explorations. Future research may well probe deeper into the mechanisms through which public attention and interest in influential figures like Elon Musk intertwine with the domains of stock market dynamics. In the ever-ebbing and flowing sea of financial markets, it appears that even the most unassuming ripples of public curiosity can make a splash. As we eagerly anticipate the unfolding chapters in this riveting saga, let us remember to keep a watchful eye on the digital footprints of societal intrigue, for they may just hold the key to uncovering the enigmatic dance between public curiosity and market movements.
-------
Your response should start like this:
[[DISCUSSION]]
ChatGPT:
[[DISCUSSION]]
Our analysis has yielded an intriguing revelation—apparently, the search for existential answers on Elon Musk is not merely a matter of quixotic questing but may possess tangible predictive power in the realm of financial markets. The correlation coefficient of 0.9814569, with statistical significance denoted by a p-value of less than 0.01, highlights the beguiling strength of the association between Google searches for 'Who is Elon Musk' and fluctuations in NVIDIA's stock price (NVDA). These findings corroborate and extend the existing literature, as certain peculiar yet significant patterns emerged.
Drawing from the whimsical realms of everyday oddities and speculative fiction, our exploratory forays into the atypical sources, including grocery receipts and bathroom graffiti, proved to be surprisingly serendipitous, offering a peculiar parallel to the mercurial dance of consumer sentiment and market dynamics. This echoed the essence of Smith et al.'s (2010) comprehensive analysis, which underscored the influence of public sentiment on stock prices, illuminating the capricious interplay of societal whims and market fluctuations.
The robust association identified in this study gives rise to a litany of hidden questions. Are the surges in searches for Elon Musk a prophetic indicator of impending upheavals in NVIDIA's stock price, or are these correlations mere happenstance, casting a bewildering shadow over the whims of curiosity in the digital age? The conundrum of causation versus correlation intrigues, much like unraveling the enigmatic allure of Mr. Musk himself. As the plot thickens, akin to a rich fondue of economic intrigue, this study underscores the ever-present enigma surrounding the intersection of public intrigue and market movements.
The pursuit of comprehensive exploration guides us toward a deeper understanding of the interconnected cues between societal curiosity and financial ebbs and flows. As we navigate through this intricate web of synchronicities, we remain ever cognizant of the coalescence of whimsy and economic influence, for in the fertile playground of digitally driven curiosity, even the most unassuming ripples may spark profound waves in the surging tides of market dynamics.
Model: gpt-3.5-turbo-1106
System prompt: You are a researcher writing an academic paper.You draft the discussion section of goofy academic research papers that sounds like it belongs based on the title and abstract provided.
User prompt:
Pretend you are an academic researcher. Your writing sounds like it belongs in a medical or economics journal. However, you frequently crack jokes, make puns, or add unexpected twists in your writing.
Please make up a short conclusion of an academic research paper presenting the findings of the connection between Google searches for 'who is elon musk' and NVIDIA's stock price (NVDA). Make it seem dry like academic research paper, but with lots of subtle hidden offhand remarks, jokes, goofy observations, and puns. Stay serious and dry most of the time, but then occasionally let your wit shine through.
Limit your response to 300 tokens. At the very end, assert that no more research is needed in this area.
Here are the title, abstract, introduction, and results sections.
[[TITLE]]
Musk-Googlity: Exploring the Correlation between Google Searches for 'Who is Elon Musk' and NVIDIA's Stock Price
[[ABSTRACT]]
This study delves into the fascinating realm of public curiosity and its potential impact on financial markets. By examining data from Google Trends and LSEG Analytics (Refinitiv), we endeavored to unravel the cryptic connection between the frequency of Google searches for 'Who is Elon Musk' and the fluctuations in NVIDIA's stock price (NVDA) from 2005 to 2023. We present a thorough analysis of the correlation coefficient of 0.9814569 and p < 0.01, revealing a striking link between the two seemingly disparate entities. Our findings underscore the whimsical interplay between internet intrigue and stock market whims, shedding light on the surprisingly influential role of public curiosity in the financial domain.
[[INTRDUCTION]]
Picture this: it's a regular day in the bustling world of financial markets. Stock prices are dancing to the rhythm of economic indicators and corporate reports. Investors are furiously crunching numbers and analyzing every bit of news that could potentially sway their portfolio one way or the other. Amidst this commotion, something unexpected lurks in the shadows, something that is hardly ever considered in the realm of stock trading - the public's fascination with a certain enigmatic figure, Elon Musk.
In recent years, the name "Elon Musk" has become nearly synonymous with innovation, controversy, and a touch of eccentricity. As the CEO of Tesla and SpaceX, his every move sends ripples through both the tech and automotive sectors. Naturally, this has led to a surge in public curiosity about the man behind the supersonic dream machines. Across the globe, internet denizens, both astute and casual, have turned to the oracle of our times, Google, to seek knowledge about this intriguing personality. But could this collective inquisitiveness have an impact on the stock prices of companies not directly linked to Mr. Musk's ventures?
Similarly, enter NVIDIA – a leading force in the world of graphics processing units (GPUs) and artificial intelligence. The company's stock price, denoted by the ticker NVDA, has had its fair share of ups and downs (pun intended, of course) in response to market developments and industry trends. But could it be possible that this roller coaster ride is also influenced by the virtual clicks and queries of individuals seeking to unravel the enigma that is Elon Musk?
These seemingly unconnected dots have led us to speculate, investigate, and speculate some more. The aim of this paper is to present our findings after an exhaustive dive into the marriage of Google searches for "Who is Elon Musk" and the fluctuations in NVIDIA's stock price from 2005 to 2023. We employ a mix of statistical analyses, trend evaluations, and a pinch of speculative whimsy to explore the unexpected correlation between these seemingly incongruent elements. So, fasten your seatbelts, folks, and get ready for a wild ride through the unpredictable world of internet intrigue and financial frolics.
[[RESULTS]]
The analysis of the data from Google Trends and LSEG Analytics (Refinitiv) from 2005 to 2023 has uncovered a rather captivating connection between Google searches for "Who is Elon Musk" and NVIDIA's stock price (NVDA). Our statistical analysis yielded a staggering correlation coefficient of 0.9814569, implying an exceptionally strong positive correlation between the frequency of Google searches for Elon Musk and the fluctuations in NVIDIA's stock price. Furthermore, the r-squared value of 0.9632577 indicates that approximately 96.32% of the variability in NVIDIA's stock price can be explained by the frequency of these Google searches. The p-value of less than 0.01 adds a cherry on top of this correlation sundae, reflecting a very high level of statistical significance.
In Fig. 1, we present a scatterplot illustrating the robust correlation between the two variables, solidifying the remarkable association we observed in our analysis.
This enthralling correlation brings to mind the age-old question of causation versus correlation. While we cannot definitively confirm causation based on these results, the coincidence of the surge in Google searches for Elon Musk coinciding with notable shifts in NVIDIA's stock price is intriguing, to say the least. Could it be that public curiosity about the enigmatic Elon Musk serves as a prescient indicator of market sentiment toward technology companies, including NVIDIA, in particular? Or are these trends mere coincidences, further fueling the enigmatic aura surrounding Mr. Musk and his perceived influence on the financial world? The plot thickens, much like the artful whisking of chocolate in a delightful fondue.
In conclusion, our findings reveal an unexpected and compelling association between public intrigue in Elon Musk and the movements of NVIDIA's stock price. This whimsical juxtaposition of internet curiosity and financial fervor opens the door to a host of questions and further explorations. Future research may well probe deeper into the mechanisms through which public attention and interest in influential figures like Elon Musk intertwine with the domains of stock market dynamics. In the ever-ebbing and flowing sea of financial markets, it appears that even the most unassuming ripples of public curiosity can make a splash. As we eagerly anticipate the unfolding chapters in this riveting saga, let us remember to keep a watchful eye on the digital footprints of societal intrigue, for they may just hold the key to uncovering the enigmatic dance between public curiosity and market movements.
-------
Your response should start like this:
[[CONCLUSION]]
ChatGPT:
[[CONCLUSION]]
In unraveling the intriguing correlation between Google searches for "Who is Elon Musk" and NVIDIA's stock price (NVDA), our study has shed light on the unlikely interplay between public curiosity and financial fluctuations. The remarkably strong positive correlation coefficient of 0.9814569, coupled with a p-value of less than 0.01, emphasizes the profound influence of public intrigue on the stock market. While our findings do not definitively establish causation, the uncanny alignment of spikes in Elon Musk searches with notable shifts in NVIDIA's stock price tantalizingly evokes the whimsical suggestion of a prescient indicator. However, the enigma persists, much like the elusive flavor of a vintage Bordeaux – does public curiosity drive market sentiment, or are we merely witnessing the capricious choreography of coincidence? Our study paves the way for further explorations into the dynamic relationship between societal fascination and financial fervor. The captivating duality of internet curiosity and market movements beckons for deeper inquiries, akin to an enthralling magic trick that leaves the audience yearning for an encore. Yet, as we conclude this chapter, we assert with resolute certainty that no more research is needed in this area. The curtain falls on the Musk-Googlity saga, leaving behind a trail of financial frolics and statistical storytelling. Let us bid adieu to this whimsical waltz, and turn our attention to new frontiers where curiosity and causation await their next captivating tango.
Model: gpt-3.5-turbo-1106
System prompt: You provide fictional names of academic journals. You say nothing else, and you do not chat with the user.
User prompt: Please provide the name of a funny but plausible sounding research, scientific, or academic journal that would publish a paper entited Musk-Googlity: Exploring the Correlation between Google Searches for 'Who is Elon Musk' and NVIDIA's Stock Price. Respond only with the name of a fictional academic journal.
ChatGPT:
Journal of Comedic Economics
Model: gpt-3.5-turbo-1106
System prompt: You provide fictional names of nonprofit research organizations and associations. You say nothing else, and you do not chat with the user.
User prompt: Please provide the name of a funny but plausible sounding nonprofit, academic, or scientific association or organization that would sponsor research that resulted in a paper entited Musk-Googlity: Exploring the Correlation between Google Searches for 'Who is Elon Musk' and NVIDIA's Stock Price. Respond only with the name of a fictional organization.
ChatGPT:
The Society for Digital Trends and Financial Markets Analysis
Model: gpt-3.5-turbo-1106
System prompt: You provide potential search keywords separated by commas. You say nothing else, and you do not chat with the user.
User prompt: Please provide potential search keywords for a paper titled Musk-Googlity: Exploring the Correlation between Google Searches for 'Who is Elon Musk' and NVIDIA's Stock Price with an abstract of This study delves into the fascinating realm of public curiosity and its potential impact on financial markets. By examining data from Google Trends and LSEG Analytics (Refinitiv), we endeavored to unravel the cryptic connection between the frequency of Google searches for 'Who is Elon Musk' and the fluctuations in NVIDIA's stock price (NVDA) from 2005 to 2023. We present a thorough analysis of the correlation coefficient of 0.9814569 and p < 0.01, revealing a striking link between the two seemingly disparate entities. Our findings underscore the whimsical interplay between internet intrigue and stock market whims, shedding light on the surprisingly influential role of public curiosity in the financial domain.
ChatGPT:
"Elon Musk Google Trends analysis", "NVIDIA stock price correlation", "Google searches impact on stock market", "correlation between internet searches and stock prices", "public curiosity and financial markets"
*There is a bunch of Python happening behind the scenes to turn this prompt sequence into a PDF.
Discover a new correlation
View all correlations
View all research papers
Report an error
Data details
Google searches for 'who is elon musk'Detailed data title: Relative volume of Google searches for 'who is elon musk' (Worldwide, without quotes)
Source: Google Trends
Additional Info: Relative search volume (not absolute numbers)
See what else correlates with Google searches for 'who is elon musk'
NVIDIA's stock price (NVDA)
Detailed data title: Opening price of NVIDIA (NVDA) on the first trading day of the year
Source: LSEG Analytics (Refinitiv)
Additional Info: Via Microsoft Excel Stockhistory function
See what else correlates with NVIDIA's stock price (NVDA)
Correlation is a measure of how much the variables move together. If it is 0.99, when one goes up the other goes up. If it is 0.02, the connection is very weak or non-existent. If it is -0.99, then when one goes up the other goes down. If it is 1.00, you probably messed up your correlation function.
r2 = 0.9632577 (Coefficient of determination)
This means 96.3% of the change in the one variable (i.e., NVIDIA's stock price (NVDA)) is predictable based on the change in the other (i.e., Google searches for 'who is elon musk') over the 19 years from 2005 through 2023.
p < 0.01, which is statistically significant(Null hypothesis significance test)
The p-value is 1.2E-13. 0.0000000000001234543870730208
The p-value is a measure of how probable it is that we would randomly find a result this extreme. More specifically the p-value is a measure of how probable it is that we would randomly find a result this extreme if we had only tested one pair of variables one time.
But I am a p-villain. I absolutely did not test only one pair of variables one time. I correlated hundreds of millions of pairs of variables. I threw boatloads of data into an industrial-sized blender to find this correlation.
Who is going to stop me? p-value reporting doesn't require me to report how many calculations I had to go through in order to find a low p-value!
On average, you will find a correaltion as strong as 0.98 in 1.2E-11% of random cases. Said differently, if you correlated 8,100,157,667,208 random variables You don't actually need 8 trillion variables to find a correlation like this one. I don't have that many variables in my database. You can also correlate variables that are not independent. I do this a lot.
p-value calculations are useful for understanding the probability of a result happening by chance. They are most useful when used to highlight the risk of a fluke outcome. For example, if you calculate a p-value of 0.30, the risk that the result is a fluke is high. It is good to know that! But there are lots of ways to get a p-value of less than 0.01, as evidenced by this project.
In this particular case, the values are so extreme as to be meaningless. That's why no one reports p-values with specificity after they drop below 0.01.
Just to be clear: I'm being completely transparent about the calculations. There is no math trickery. This is just how statistics shakes out when you calculate hundreds of millions of random correlations.
with the same 18 degrees of freedom, Degrees of freedom is a measure of how many free components we are testing. In this case it is 18 because we have two variables measured over a period of 19 years. It's just the number of years minus ( the number of variables minus one ), which in this case simplifies to the number of years minus one.
you would randomly expect to find a correlation as strong as this one.
[ 0.95, 0.99 ] 95% correlation confidence interval (using the Fisher z-transformation)
The confidence interval is an estimate the range of the value of the correlation coefficient, using the correlation itself as an input. The values are meant to be the low and high end of the correlation coefficient with 95% confidence.
This one is a bit more complciated than the other calculations, but I include it because many people have been pushing for confidence intervals instead of p-value calculations (for example: NEJM. However, if you are dredging data, you can reliably find yourself in the 5%. That's my goal!
All values for the years included above: If I were being very sneaky, I could trim years from the beginning or end of the datasets to increase the correlation on some pairs of variables. I don't do that because there are already plenty of correlations in my database without monkeying with the years.
Still, sometimes one of the variables has more years of data available than the other. This page only shows the overlapping years. To see all the years, click on "See what else correlates with..." link above.
| 2005 | 2006 | 2007 | 2008 | 2009 | 2010 | 2011 | 2012 | 2013 | 2014 | 2015 | 2016 | 2017 | 2018 | 2019 | 2020 | 2021 | 2022 | 2023 | |
| Google searches for 'who is elon musk' (Rel. search volume) | 0.75 | 0.0833333 | 0.0833333 | 0.0909091 | 0.111111 | 0 | 0 | 0 | 0.75 | 1 | 1.58333 | 1.66667 | 3.66667 | 8.41667 | 6.08333 | 15.4167 | 26.3333 | 43 | 26.8889 |
| NVIDIA's stock price (NVDA) (Stock price) | 2.03 | 3.06 | 6.18 | 8.53 | 2.02 | 4.63 | 3.88 | 3.58 | 3.14 | 3.98 | 5.03 | 8.07 | 26.1 | 48.95 | 32.66 | 59.69 | 131.04 | 298.15 | 148.51 |
Why this works
- Data dredging: I have 25,153 variables in my database. I compare all these variables against each other to find ones that randomly match up. That's 632,673,409 correlation calculations! This is called “data dredging.” Instead of starting with a hypothesis and testing it, I instead abused the data to see what correlations shake out. It’s a dangerous way to go about analysis, because any sufficiently large dataset will yield strong correlations completely at random.
- Lack of causal connection: There is probably
Because these pages are automatically generated, it's possible that the two variables you are viewing are in fact causually related. I take steps to prevent the obvious ones from showing on the site (I don't let data about the weather in one city correlate with the weather in a neighboring city, for example), but sometimes they still pop up. If they are related, cool! You found a loophole.
no direct connection between these variables, despite what the AI says above. This is exacerbated by the fact that I used "Years" as the base variable. Lots of things happen in a year that are not related to each other! Most studies would use something like "one person" in stead of "one year" to be the "thing" studied. - Observations not independent: For many variables, sequential years are not independent of each other. If a population of people is continuously doing something every day, there is no reason to think they would suddenly change how they are doing that thing on January 1. A simple
Personally I don't find any p-value calculation to be 'simple,' but you know what I mean.
p-value calculation does not take this into account, so mathematically it appears less probable than it really is.
Try it yourself
You can calculate the values on this page on your own! Try running the Python code to see the calculation results. Step 1: Download and install Python on your computer.Step 2: Open a plaintext editor like Notepad and paste the code below into it.
Step 3: Save the file as "calculate_correlation.py" in a place you will remember, like your desktop. Copy the file location to your clipboard. On Windows, you can right-click the file and click "Properties," and then copy what comes after "Location:" As an example, on my computer the location is "C:\Users\tyler\Desktop"
Step 4: Open a command line window. For example, by pressing start and typing "cmd" and them pressing enter.
Step 5: Install the required modules by typing "pip install numpy", then pressing enter, then typing "pip install scipy", then pressing enter.
Step 6: Navigate to the location where you saved the Python file by using the "cd" command. For example, I would type "cd C:\Users\tyler\Desktop" and push enter.
Step 7: Run the Python script by typing "python calculate_correlation.py"
If you run into any issues, I suggest asking ChatGPT to walk you through installing Python and running the code below on your system. Try this question:
"Walk me through installing Python on my computer to run a script that uses scipy and numpy. Go step-by-step and ask me to confirm before moving on. Start by asking me questions about my operating system so that you know how to proceed. Assume I want the simplest installation with the latest version of Python and that I do not currently have any of the necessary elements installed. Remember to only give me one step per response and confirm I have done it before proceeding."
# These modules make it easier to perform the calculation
import numpy as np
from scipy import stats

# We'll define a function that we can call to return the correlation calculations
def calculate_correlation(array1, array2):

    # Calculate Pearson correlation coefficient and p-value
    correlation, p_value = stats.pearsonr(array1, array2)

    # Calculate R-squared as the square of the correlation coefficient
    r_squared = correlation**2

    return correlation, r_squared, p_value

# These are the arrays for the variables shown on this page, but you can modify them to be any two sets of numbers
array_1 = np.array([0.75,0.0833333,0.0833333,0.0909091,0.111111,0,0,0,0.75,1,1.58333,1.66667,3.66667,8.41667,6.08333,15.4167,26.3333,43,26.8889,])
array_2 = np.array([2.03,3.06,6.18,8.53,2.02,4.63,3.88,3.58,3.14,3.98,5.03,8.07,26.1,48.95,32.66,59.69,131.04,298.15,148.51,])
array_1_name = "Google searches for 'who is elon musk'"
array_2_name = "NVIDIA's stock price (NVDA)"

# Perform the calculation
print(f"Calculating the correlation between {array_1_name} and {array_2_name}...")
correlation, r_squared, p_value = calculate_correlation(array_1, array_2)

# Print the results
print("Correlation Coefficient:", correlation)
print("R-squared:", r_squared)
print("P-value:", p_value)
Reuseable content
You may re-use the images on this page for any purpose, even commercial purposes, without asking for permission. The only requirement is that you attribute Tyler Vigen. Attribution can take many different forms. If you leave the "tylervigen.com" link in the image, that satisfies it just fine. If you remove it and move it to a footnote, that's fine too. You can also just write "Charts courtesy of Tyler Vigen" at the bottom of an article.You do not need to attribute "the spurious correlations website," and you don't even need to link here if you don't want to. I don't gain anything from pageviews. There are no ads on this site, there is nothing for sale, and I am not for hire.
For the record, I am just one person. Tyler Vigen, he/him/his. I do have degrees, but they should not go after my name unless you want to annoy my wife. If that is your goal, then go ahead and cite me as "Tyler Vigen, A.A. A.A.S. B.A. J.D." Otherwise it is just "Tyler Vigen."
When spoken, my last name is pronounced "vegan," like I don't eat meat.
Full license details.
For more on re-use permissions, or to get a signed release form, see tylervigen.com/permission.
Download images for these variables:
- High resolution line chart
The image linked here is a Scalable Vector Graphic (SVG). It is the highest resolution that is possible to achieve. It scales up beyond the size of the observable universe without pixelating. You do not need to email me asking if I have a higher resolution image. I do not. The physical limitations of our universe prevent me from providing you with an image that is any higher resolution than this one.
If you insert it into a PowerPoint presentation (a tool well-known for managing things that are the scale of the universe), you can right-click > "Ungroup" or "Create Shape" and then edit the lines and text directly. You can also change the colors this way.
Alternatively you can use a tool like Inkscape. - High resolution line chart, optimized for mobile
- Alternative high resolution line chart
- Scatterplot
- Portable line chart (png)
- Portable line chart (png), optimized for mobile
- Line chart for only Google searches for 'who is elon musk'
- Line chart for only NVIDIA's stock price (NVDA)
- The spurious research paper: Musk-Googlity: Exploring the Correlation between Google Searches for 'Who is Elon Musk' and NVIDIA's Stock Price
Your rating is much appreciated!
Correlation ID: 1342 · Black Variable ID: 1487 · Red Variable ID: 1544

