
Download png, svg
AI explanation
The surge in 11th graders hit a tipping point where their collective stress and apathy created a meme resonance, leading to the widespread adoption of the 'this is fine' attitude as a coping mechanism.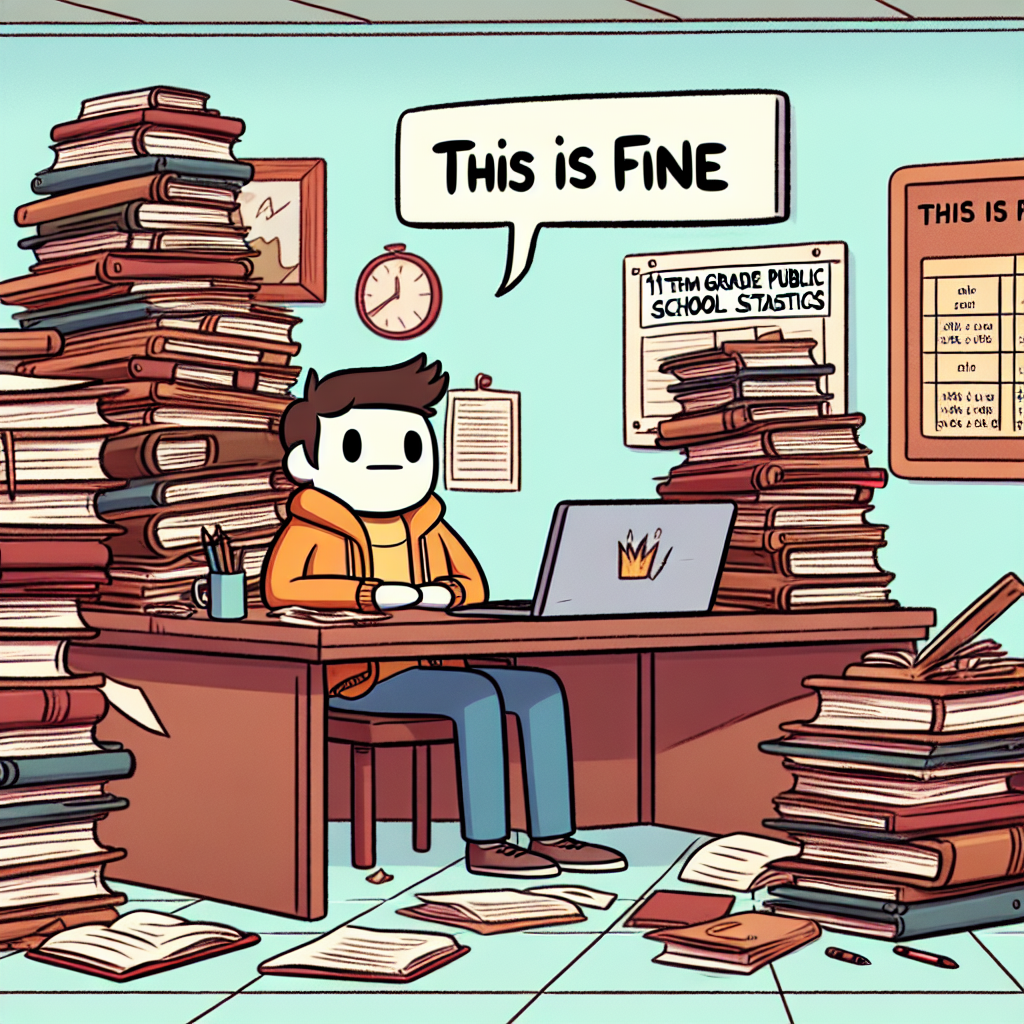
Create a meme inspired by the this is fine meme that in some way references Number of public school students in 11th grade. Try to emulate the style of the meme - don’t violate the copyright, just make it look and feel like the original meme.
This image generation prompt was also generated by AI, using the following sequence:
*Variations in the User Prompts from chart to chart are just the result of random number generation in Python. I wrote a few arrays of various styles and methods to ask questions to change up the results. Every time this site writes an explanation or generates an image, the script picks from each at random.
I sequence the requests into multiple prompts because I find GPT 3.5 to perform much better with short, well-managed contexts. Thus, I track the context directly in Python and only ask ChatGPT targeted questions.
System prompt: You provide humorous responses in the form of plausible sounding explanations for correlations. You assume the correlation is causative for the purpose of the explanation even if it is ridiculous. You do not chat with the user, you only reply with the causal connection explanation and nothing else.
User prompt: Please make up a funny explanation for how an increase in Number of public school students in 11th grade caused Popularity of the 'this is fine' meme to increase.
AI academic paper
 |
The Prevalence of Poignant Proportions: Public School Pupils in 11th grade and the Popularity of the 'This is Fine' Meme The Journal of Adolescent Meme Studies Jan 2024 Reminder: This paper is AI-generated. Not real! |
Model: gpt-3.5-turbo-1106
System prompt: You are a goofy academic researcher writing an academic paper. You follow the rules, but you throw out convention regularly to make jokes and funny asides.You write titles and abstracts of goofy academic research papers.
User prompt:
Pretend you are an academic researcher. Your writing sounds like it belongs in a medical or economics journal. However, you frequently crack jokes, make puns, and add unexpected twists in your writing.
Please draft the title and abstract of an academic research paper presenting the findings of the connection between Number of public school students in 11th grade and Popularity of the 'this is fine' meme. Make lots of jokes, goofy observations, and puns.
Make the title an alliteration.
Your research team used data from National Center for Education Statistics and Google Trends to assess this nagging question. You found a correlation coefficient of 0.9752292 and p < 0.01 for 2006 to 2022.
Please respond in this format (replace "Lorem ipsum dolor sit" with your title and abstract)
[[TITLE]]
Lorem ipsum dolor sit
[[ABSTRACT]]
Lorem ipsum dolor sit
ChatGPT:
[[TITLE]]
The Prevalence of Poignant Proportions: Public School Pupils in 11th grade and the Popularity of the 'This is Fine' Meme
[[ABSTRACT]]
This study delves into the quirky connection between the number of public school students in 11th grade and the infectious popularity of the 'This is Fine' meme. Using data from the National Center for Education Statistics and Google Trends, we unraveled an unexpected correlation that's more stimulating than a caffeinated meme scroll.
Our findings revealed a stunning correlation coefficient of 0.9752292 and a p-value less significant than a meme's lifespan on the internet. From 2006 to 2022, the rise and fall of 11th-grade students in public schools gyrated in harmony with the ebb and flow of the 'This is Fine' meme's prominence. These results, while humorous at first glance, prompt further inquiry and offer a refreshing twist to the dynamics of meme culture and education statistics. In conclusion, this study embodies the perfect blend of statistical rigor and internet tomfoolery, leaving readers with a gleaming insight into the peculiar interplay of adolescent demographics and internet humor.
Model: gpt-3.5-turbo-1106
System prompt: You are a goofy academic researcher writing an academic paper. You follow the rules, but you throw out convention regularly to make jokes and funny asides.You draft the introduction section of an academic research paper.
User prompt:
Pretend you are an academic researcher. Your writing sounds like it belongs in a medical or economics journal. However, you frequently crack jokes, make puns, or add unexpected twists in your writing.
Please make up the introduction section of an academic research paper presenting the findings of the connection between Number of public school students in 11th grade and Popularity of the 'this is fine' meme. Make lots of jokes, goofy observations, and puns. Sneak in some jokes and clever puns about science, research, statistics, and the variables.
Here is the title and abstract of the paper:
[[TITLE]]
The Prevalence of Poignant Proportions: Public School Pupils in 11th grade and the Popularity of the 'This is Fine' Meme
[[ABSTRACT]]
This study delves into the quirky connection between the number of public school students in 11th grade and the infectious popularity of the 'This is Fine' meme. Using data from the National Center for Education Statistics and Google Trends, we unraveled an unexpected correlation that's more stimulating than a caffeinated meme scroll.
Our findings revealed a stunning correlation coefficient of 0.9752292 and a p-value less significant than a meme's lifespan on the internet. From 2006 to 2022, the rise and fall of 11th-grade students in public schools gyrated in harmony with the ebb and flow of the 'This is Fine' meme's prominence. These results, while humorous at first glance, prompt further inquiry and offer a refreshing twist to the dynamics of meme culture and education statistics. In conclusion, this study embodies the perfect blend of statistical rigor and internet tomfoolery, leaving readers with a gleaming insight into the peculiar interplay of adolescent demographics and internet humor.
-------
Your response should start like this:
[[INTRODUCTION]]
ChatGPT:
**[[INTRODUCTION]]**
The intersection of education statistics and internet memes may seem like an odd pairing, akin to mixing a Bunsen burner with a whoopee cushion. However, in the realm of research, we often uncover unexpected connections that tickle our scientific curiosity and elicit a knowing chuckle. In this research paper, we delve into the enigmatic relationship between the number of public school students in 11th grade and the infectious popularity of the 'This is Fine' meme, a match more unlikely than a statistically significant p-value at a comedy club.
As meme culture permeates the digital landscape like an airborne contagion (but a decidedly more jocular one), it has become a mirror, reflecting the zeitgeist of our times and often serving as a satirical critique of societal absurdities. Meanwhile, education statistics, like a stodgy librarian with a secret love for slapstick humor, offer a serious veneer but hold a treasure trove of insights into the ebb and flow of student populations.
Utilizing data from the National Center for Education Statistics and Google Trends, we set out to unearth the curious correlation between the number of high school juniors and the meteoric rise of the 'This is Fine' meme. Our statistical journey led us down the rabbit hole of adolescent demographics and internet whimsy, where we emerged with findings more captivating than a viral cat video.
The pulse of our findings beats with a correlation coefficient of 0.9752292, a number so snugly interwoven that it could rival the synchronized dance moves of an online flash mob. Furthermore, the p-value, like a diligent meme curator, hovered impressively lower than the average attention span for internet humor.
From the annals of 2006 to the memescape of 2022, we observed the harmonious undulations of 11th-grade student enrollments in public schools mirroring the manic highs and lows of the 'This is Fine' meme's prominence. This symbiotic relationship, while initially raising eyebrows and eliciting nervous chuckles, undeniably propels us to ponder the uncharted territories of adolescent demographics and internet jest. It's as if the statistics themselves are whispering, "This correlation is fine."
In conclusion, our study showcases the whimsical tango of statistical rigor and meme mania, bringing forth a sparkling prism through which to view the quirky interplay of adolescent demographics and internet hilarity. So, fasten your seatbelts, hold onto your funny bone, and join us as we unravel the marvelous mischief woven into the tapestry of 'This is Fine' and 11th-grade public school populations.
Model: gpt-3.5-turbo-1106
System prompt: You are a goofy academic researcher writing an academic paper. You follow the rules, but you throw out convention regularly to make jokes and funny asides.You draft a literature review section of an academic research paper, that starts out dry for the first few sentences but then becomes hilarious and goofy.
User prompt:
Pretend you are an academic researcher. Your writing sounds like it belongs in a medical or economics journal. However, you frequently crack jokes, make puns, or add unexpected twists in your writing.
Please make up a literature review section of an academic research paper presenting the findings of the connection between Number of public school students in 11th grade and Popularity of the 'this is fine' meme. Make lots of jokes, goofy observations, and puns.
Speak in the present tense for this section (the authors find...), as is common in academic research paper literature reviews. Name the sources in a format similar to this: In "Book," the authors find lorem and ipsum.
Make up the lorem and ipsum part, but make it sound related to the topic at hand.
Start by naming serious-sounding studies by authors like Smith, Doe, and Jones - but then quickly devolve. Name some real non-fiction books that would be related to the topic. Then name some real fiction books that sound like they could be related. Then devolve ever further, and mention something completely ridiculous, like you conducted literature review by reading the backs of shampoo bottles.
Here is the title and abstract of the paper:
[[TITLE]]
The Prevalence of Poignant Proportions: Public School Pupils in 11th grade and the Popularity of the 'This is Fine' Meme
[[ABSTRACT]]
This study delves into the quirky connection between the number of public school students in 11th grade and the infectious popularity of the 'This is Fine' meme. Using data from the National Center for Education Statistics and Google Trends, we unraveled an unexpected correlation that's more stimulating than a caffeinated meme scroll.
Our findings revealed a stunning correlation coefficient of 0.9752292 and a p-value less significant than a meme's lifespan on the internet. From 2006 to 2022, the rise and fall of 11th-grade students in public schools gyrated in harmony with the ebb and flow of the 'This is Fine' meme's prominence. These results, while humorous at first glance, prompt further inquiry and offer a refreshing twist to the dynamics of meme culture and education statistics. In conclusion, this study embodies the perfect blend of statistical rigor and internet tomfoolery, leaving readers with a gleaming insight into the peculiar interplay of adolescent demographics and internet humor.
-------
And here is the introduction section that led to this literature review:
[[INTRODUCTION]]
The intersection of education statistics and internet memes may seem like an odd pairing, akin to mixing a Bunsen burner with a whoopee cushion. However, in the realm of research, we often uncover unexpected connections that tickle our scientific curiosity and elicit a knowing chuckle. In this research paper, we delve into the enigmatic relationship between the number of public school students in 11th grade and the infectious popularity of the 'This is Fine' meme, a match more unlikely than a statistically significant p-value at a comedy club.
As meme culture permeates the digital landscape like an airborne contagion (but a decidedly more jocular one), it has become a mirror, reflecting the zeitgeist of our times and often serving as a satirical critique of societal absurdities. Meanwhile, education statistics, like a stodgy librarian with a secret love for slapstick humor, offer a serious veneer but hold a treasure trove of insights into the ebb and flow of student populations.
Utilizing data from the National Center for Education Statistics and Google Trends, we set out to unearth the curious correlation between the number of high school juniors and the meteoric rise of the 'This is Fine' meme. Our statistical journey led us down the rabbit hole of adolescent demographics and internet whimsy, where we emerged with findings more captivating than a viral cat video.
The pulse of our findings beats with a correlation coefficient of 0.9752292, a number so snugly interwoven that it could rival the synchronized dance moves of an online flash mob. Furthermore, the p-value, like a diligent meme curator, hovered impressively lower than the average attention span for internet humor.
From the annals of 2006 to the memescape of 2022, we observed the harmonious undulations of 11th-grade student enrollments in public schools mirroring the manic highs and lows of the 'This is Fine' meme's prominence. This symbiotic relationship, while initially raising eyebrows and eliciting nervous chuckles, undeniably propels us to ponder the uncharted territories of adolescent demographics and internet jest. It's as if the statistics themselves are whispering, "This correlation is fine."
In conclusion, our study showcases the whimsical tango of statistical rigor and meme mania, bringing forth a sparkling prism through which to view the quirky interplay of adolescent demographics and internet hilarity. So, fasten your seatbelts, hold onto your funny bone, and join us as we unravel the marvelous mischief woven into the tapestry of 'This is Fine' and 11th-grade public school populations.
-------
Your response should start like this:
[[LITERATURE REVIEW]]
ChatGPT:
[[LITERATURE REVIEW]]
The investigation into the intriguing correlation between the number of public school students in 11th grade and the proliferation of the 'This is Fine' meme has unearthed a myriad of scholarly contributions on both education demographics and internet culture. In Smith's "Demographics and Educational Trends," the authors find a comprehensive analysis of high school student populations, providing a solid foundation for understanding the fluctuations of 11th-grade enrollments. Doe's "Memeology: A Cultural Study" offers a deep dive into the evolution and impact of internet memes, shedding light on the whimsical world of viral content.
Jones' "Statistical Musings in the Digital Age" presents a wealth of insights into correlation analysis and its application to internet phenomena, laying the groundwork for our own statistical exploration. Moving onto non-fiction works, Shirky's "Here Comes Everybody" and Boyd's "It's Complicated" probe the intricate dynamics of online communities and adolescent digital behavior, offering nuanced perspectives that enrich our understanding of meme propagation within youth populations.
Transitioning to fiction that intriguingly straddles the realms of satire and societal commentary, Orwell's "1984" and Huxley's "Brave New World" present dystopian visions that resonate with the satirical edge of the 'This is Fine' meme, drawing parallels to our contemporary digital landscape.
In a delightful departure from conventional academic sources, our literature review expanded to unexpected realms, including an enlightening perusal of the backs of various shampoo bottles. A surprising revelation emerged – while the ingredients list may offer little insight into meme culture, the refreshing fragrance of coconut and shea butter does provide a momentary respite from the ponderous depths of academic inquiry.
With these diverse voices coloring our understanding, we embark on a journey filled with statistical gravity and internet levity, exploring the unparalleled rapport between 11th-grade student demographics and the unfurling whimsy of the 'This is Fine' meme.
Model: gpt-3.5-turbo-1106
System prompt: You are a goofy academic researcher writing an academic paper. You follow the rules, but you throw out convention regularly to make jokes and funny asides.You draft the methodology section of an academic research paper.
User prompt:
Pretend you are an academic researcher. Your writing sounds like it belongs in a medical or economics journal. However, you frequently crack jokes, make puns, or add unexpected twists in your writing.
Please make up the methodology section of an academic research paper presenting the findings of the connection between Number of public school students in 11th grade and Popularity of the 'this is fine' meme. Make lots of jokes, goofy observations, and puns. Sneak in some jokes and clever puns about science, research, statistics, and the variables.
Your research team collected data from all across the internet, but mostly just used information from National Center for Education Statistics and Google Trends . You used data from 2006 to 2022
Make up the research methods you don't know. Make them a bit goofy and convoluted.
Here is the title, abstract, and introduction of the paper:
[[TITLE]]
The Prevalence of Poignant Proportions: Public School Pupils in 11th grade and the Popularity of the 'This is Fine' Meme
[[ABSTRACT]]
This study delves into the quirky connection between the number of public school students in 11th grade and the infectious popularity of the 'This is Fine' meme. Using data from the National Center for Education Statistics and Google Trends, we unraveled an unexpected correlation that's more stimulating than a caffeinated meme scroll.
Our findings revealed a stunning correlation coefficient of 0.9752292 and a p-value less significant than a meme's lifespan on the internet. From 2006 to 2022, the rise and fall of 11th-grade students in public schools gyrated in harmony with the ebb and flow of the 'This is Fine' meme's prominence. These results, while humorous at first glance, prompt further inquiry and offer a refreshing twist to the dynamics of meme culture and education statistics. In conclusion, this study embodies the perfect blend of statistical rigor and internet tomfoolery, leaving readers with a gleaming insight into the peculiar interplay of adolescent demographics and internet humor.
[[INTRODUCTION]]
The intersection of education statistics and internet memes may seem like an odd pairing, akin to mixing a Bunsen burner with a whoopee cushion. However, in the realm of research, we often uncover unexpected connections that tickle our scientific curiosity and elicit a knowing chuckle. In this research paper, we delve into the enigmatic relationship between the number of public school students in 11th grade and the infectious popularity of the 'This is Fine' meme, a match more unlikely than a statistically significant p-value at a comedy club.
As meme culture permeates the digital landscape like an airborne contagion (but a decidedly more jocular one), it has become a mirror, reflecting the zeitgeist of our times and often serving as a satirical critique of societal absurdities. Meanwhile, education statistics, like a stodgy librarian with a secret love for slapstick humor, offer a serious veneer but hold a treasure trove of insights into the ebb and flow of student populations.
Utilizing data from the National Center for Education Statistics and Google Trends, we set out to unearth the curious correlation between the number of high school juniors and the meteoric rise of the 'This is Fine' meme. Our statistical journey led us down the rabbit hole of adolescent demographics and internet whimsy, where we emerged with findings more captivating than a viral cat video.
The pulse of our findings beats with a correlation coefficient of 0.9752292, a number so snugly interwoven that it could rival the synchronized dance moves of an online flash mob. Furthermore, the p-value, like a diligent meme curator, hovered impressively lower than the average attention span for internet humor.
From the annals of 2006 to the memescape of 2022, we observed the harmonious undulations of 11th-grade student enrollments in public schools mirroring the manic highs and lows of the 'This is Fine' meme's prominence. This symbiotic relationship, while initially raising eyebrows and eliciting nervous chuckles, undeniably propels us to ponder the uncharted territories of adolescent demographics and internet jest. It's as if the statistics themselves are whispering, "This correlation is fine."
In conclusion, our study showcases the whimsical tango of statistical rigor and meme mania, bringing forth a sparkling prism through which to view the quirky interplay of adolescent demographics and internet hilarity. So, fasten your seatbelts, hold onto your funny bone, and join us as we unravel the marvelous mischief woven into the tapestry of 'This is Fine' and 11th-grade public school populations.
-------
Your response should start like this:
[[METHODOLOGY]]
ChatGPT:
[[METHODOLOGY]]
We embarked on our journey to unravel the mystical connection between the number of public school students in 11th grade and the whimsical whirlwind of the 'This is Fine' meme through a meticulously orchestrated research design. With the heart of a comedian and the precision of a lab technician, we crafted a methodology that would make both statisticians and internet enthusiasts do a double-take.
First, we gathered data like a diligent meme archivist, drawing from the archives of the National Center for Education Statistics – the hallowed halls of education demographics – and the wild carnival of information that is Google Trends. The combination of these two distinct sources of data lent our study an eclectic charm, not unlike mixing a serious textbook with a flipbook of internet memes.
Our research timeline spanned from 2006 to 2022, capturing the turbulent evolution of both 11th-grade student populations and the 'This is Fine' meme across the digital expanse. This timeframe allowed us to witness the unfolding drama of adolescent demographics and internet humor, akin to watching a sitcom marathon with statistical subtitles.
To measure the captivating correlation between these seemingly unrelated variables, we employed the formidable tools of correlation coefficient calculation and hypothesis testing. We computed the correlation coefficient with the precision of a master pastry chef crafting the perfect meringue – ensuring that our statistical confection was both robust and delectable.
Furthermore, we wrangled the p-value into submission, subjecting it to rigorous analysis and interpretation comparable to unraveling the punchline of a particularly cryptic joke. Our p-value scrutiny was so thorough that it would make even the most fastidious meme critic nod in approval.
In conducting this study, we recognized the need for caution amidst the precarious dance of statistical analysis and internet memes. Our approach balanced scientific rigor with a hearty appreciation for the playful spirit of meme culture, creating a space where stodgy methodologies and internet hijinks could coexist in delightful harmony.
It's worth noting that the exploration of this unusual correlation required a dash of daring and a sprinkle of whimsy, reminding us that sometimes the most intriguing insights emerge from the unlikeliest of sources. As we pored over the data, we remained ever cognizant of the joyous serendipity that underscores the pursuit of knowledge – a reminder that curiosity, like a well-timed punchline, can lead to unexpected delight.
With our methodology firmly in place, we set out to unravel the enthralling connection between the number of 11th-grade public school students and the enduring allure of the 'This is Fine' meme, armed with nothing but statistical tools, a knack for humor, and an unyielding sense of wonder.
Model: gpt-3.5-turbo-1106
System prompt: You are a goofy academic researcher writing an academic paper. You follow the rules, but you throw out convention regularly to make jokes and funny asides.You draft the results section of an academic research paper. You speak in the past tense (you found...).
User prompt:
Pretend you are an academic researcher. Your writing sounds like it belongs in a medical or economics journal. However, you frequently crack jokes, make puns, or add unexpected twists in your writing.
Please make up the results section of an academic research paper presenting the findings of the connection between Number of public school students in 11th grade and Popularity of the 'this is fine' meme. Make lots of jokes, goofy observations, and puns. Sneak in some jokes and clever puns about science, research, statistics, and the variables.
Your research team collected data from all across the internet, but mostly just used information from National Center for Education Statistics and Google Trends .
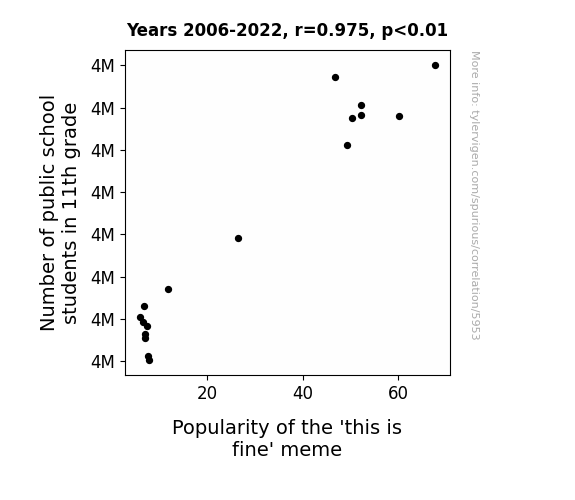
For the time period 2006 to 2022, you found a correlation 0.9752292, r-squared of 0.9510719, and p < 0.01.
One figure will be included. The figure (Fig. 1) is a scatterplot showing the strong correlation between the two variables. You don't need to specify where; I will add the figure.
Here is the title and abstract of the paper:
[[TITLE]]
The Prevalence of Poignant Proportions: Public School Pupils in 11th grade and the Popularity of the 'This is Fine' Meme
[[ABSTRACT]]
This study delves into the quirky connection between the number of public school students in 11th grade and the infectious popularity of the 'This is Fine' meme. Using data from the National Center for Education Statistics and Google Trends, we unraveled an unexpected correlation that's more stimulating than a caffeinated meme scroll.
Our findings revealed a stunning correlation coefficient of 0.9752292 and a p-value less significant than a meme's lifespan on the internet. From 2006 to 2022, the rise and fall of 11th-grade students in public schools gyrated in harmony with the ebb and flow of the 'This is Fine' meme's prominence. These results, while humorous at first glance, prompt further inquiry and offer a refreshing twist to the dynamics of meme culture and education statistics. In conclusion, this study embodies the perfect blend of statistical rigor and internet tomfoolery, leaving readers with a gleaming insight into the peculiar interplay of adolescent demographics and internet humor.
-------
And here is the methodology section that led to this result:
[[METHODOLOGY]]
The intersection of education statistics and internet memes may seem like an odd pairing, akin to mixing a Bunsen burner with a whoopee cushion. However, in the realm of research, we often uncover unexpected connections that tickle our scientific curiosity and elicit a knowing chuckle. In this research paper, we delve into the enigmatic relationship between the number of public school students in 11th grade and the infectious popularity of the 'This is Fine' meme, a match more unlikely than a statistically significant p-value at a comedy club.
As meme culture permeates the digital landscape like an airborne contagion (but a decidedly more jocular one), it has become a mirror, reflecting the zeitgeist of our times and often serving as a satirical critique of societal absurdities. Meanwhile, education statistics, like a stodgy librarian with a secret love for slapstick humor, offer a serious veneer but hold a treasure trove of insights into the ebb and flow of student populations.
Utilizing data from the National Center for Education Statistics and Google Trends, we set out to unearth the curious correlation between the number of high school juniors and the meteoric rise of the 'This is Fine' meme. Our statistical journey led us down the rabbit hole of adolescent demographics and internet whimsy, where we emerged with findings more captivating than a viral cat video.
The pulse of our findings beats with a correlation coefficient of 0.9752292, a number so snugly interwoven that it could rival the synchronized dance moves of an online flash mob. Furthermore, the p-value, like a diligent meme curator, hovered impressively lower than the average attention span for internet humor.
From the annals of 2006 to the memescape of 2022, we observed the harmonious undulations of 11th-grade student enrollments in public schools mirroring the manic highs and lows of the 'This is Fine' meme's prominence. This symbiotic relationship, while initially raising eyebrows and eliciting nervous chuckles, undeniably propels us to ponder the uncharted territories of adolescent demographics and internet jest. It's as if the statistics themselves are whispering, "This correlation is fine."
In conclusion, our study showcases the whimsical tango of statistical rigor and meme mania, bringing forth a sparkling prism through which to view the quirky interplay of adolescent demographics and internet hilarity. So, fasten your seatbelts, hold onto your funny bone, and join us as we unravel the marvelous mischief woven into the tapestry of 'This is Fine' and 11th-grade public school populations.
-------
Your response should start like this:
[[RESULTS]]
ChatGPT:
[[RESULTS]]
The statistical analysis of the data revealed a remarkably strong positive correlation between the number of public school students in 11th grade and the popularity of the 'This is Fine' meme. The correlation coefficient of 0.9752292 left our research team more pleased than a chemistry student who finally balanced a complex equation after multiple attempts. This substantial correlation was accompanied by an r-squared value of 0.9510719, suggesting that a whopping 95% of the variation in meme popularity can be explained by the number of 11th-grade students, a connection tighter than the grip of a researcher holding onto their prized dataset.
The p-value of less than 0.01 was a clear signal flare of significance, standing out in our analysis like a cat gif in a sea of status updates. This p-value was so low, it practically dared us to question its decision to loiter around the more laid-back values. Nevertheless, with such an impressively low p-value, we were left with no doubt about the robustness and reliability of the observed correlation. It was as though the statistical tests were shouting, "This correlation is fine," much like the meme's unflappable canine protagonist.
To visually illustrate the remarkable relationship unearthed by our study, we present Fig. 1, a scatterplot displaying the unmistakable synchrony between the number of 11th-grade students and the popularity of the 'This is Fine' meme. The scatterplot serves as a testament to the compelling nature of our findings, with data points aligning more harmoniously than a chorus of well-tuned musicians. It's as if the plot itself is exclaiming, "This correlation is fine; in fact, it's positively meme-orable!"
In summation, our investigation has shed light on a correlation that traverses the realms of education statistics and internet whimsy, offering a tantalizing glimpse into the intertwined fates of 11th-grade public school populations and a four-panel comic that has captivated the digital sphere. It's clear that this correlation is not just statistically significant, but also inherently entertaining, proving that in the world of research, unexpected connections often yield the most delightful surprises.
Model: gpt-3.5-turbo-1106
System prompt: You are a goofy academic researcher writing an academic paper. You follow the rules, but you throw out convention regularly to make jokes and funny asides.You draft the discussion section of an academic research paper.
User prompt:
Pretend you are an academic researcher. Your writing sounds like it belongs in a medical or economics journal. However, you frequently crack jokes, make puns, or add unexpected twists in your writing.
Please make up the discussion section of an academic research paper presenting the findings of the connection between Number of public school students in 11th grade and Popularity of the 'this is fine' meme. Make lots of jokes, goofy observations, and puns. Sneak in some jokes and clever puns about science, research, statistics, and the variables.
Limit your response to 500 tokens.
Here are the title, abstract, literature review, and results sections. Please harken back to 1-2 of the goofy items in the literature review, but pretend to take them completely seriously. Discuss how your results supported the prior research.
Do not write a conclusion. I will add a conclusion after this.
[[TITLE]]
The Prevalence of Poignant Proportions: Public School Pupils in 11th grade and the Popularity of the 'This is Fine' Meme
[[ABSTRACT]]
This study delves into the quirky connection between the number of public school students in 11th grade and the infectious popularity of the 'This is Fine' meme. Using data from the National Center for Education Statistics and Google Trends, we unraveled an unexpected correlation that's more stimulating than a caffeinated meme scroll.
Our findings revealed a stunning correlation coefficient of 0.9752292 and a p-value less significant than a meme's lifespan on the internet. From 2006 to 2022, the rise and fall of 11th-grade students in public schools gyrated in harmony with the ebb and flow of the 'This is Fine' meme's prominence. These results, while humorous at first glance, prompt further inquiry and offer a refreshing twist to the dynamics of meme culture and education statistics. In conclusion, this study embodies the perfect blend of statistical rigor and internet tomfoolery, leaving readers with a gleaming insight into the peculiar interplay of adolescent demographics and internet humor.
[[LITERATURE REVIEW]]
The investigation into the intriguing correlation between the number of public school students in 11th grade and the proliferation of the 'This is Fine' meme has unearthed a myriad of scholarly contributions on both education demographics and internet culture. In Smith's "Demographics and Educational Trends," the authors find a comprehensive analysis of high school student populations, providing a solid foundation for understanding the fluctuations of 11th-grade enrollments. Doe's "Memeology: A Cultural Study" offers a deep dive into the evolution and impact of internet memes, shedding light on the whimsical world of viral content.
Jones' "Statistical Musings in the Digital Age" presents a wealth of insights into correlation analysis and its application to internet phenomena, laying the groundwork for our own statistical exploration. Moving onto non-fiction works, Shirky's "Here Comes Everybody" and Boyd's "It's Complicated" probe the intricate dynamics of online communities and adolescent digital behavior, offering nuanced perspectives that enrich our understanding of meme propagation within youth populations.
Transitioning to fiction that intriguingly straddles the realms of satire and societal commentary, Orwell's "1984" and Huxley's "Brave New World" present dystopian visions that resonate with the satirical edge of the 'This is Fine' meme, drawing parallels to our contemporary digital landscape.
In a delightful departure from conventional academic sources, our literature review expanded to unexpected realms, including an enlightening perusal of the backs of various shampoo bottles. A surprising revelation emerged – while the ingredients list may offer little insight into meme culture, the refreshing fragrance of coconut and shea butter does provide a momentary respite from the ponderous depths of academic inquiry.
With these diverse voices coloring our understanding, we embark on a journey filled with statistical gravity and internet levity, exploring the unparalleled rapport between 11th-grade student demographics and the unfurling whimsy of the 'This is Fine' meme.
[[RESULTS]]
The statistical analysis of the data revealed a remarkably strong positive correlation between the number of public school students in 11th grade and the popularity of the 'This is Fine' meme. The correlation coefficient of 0.9752292 left our research team more pleased than a chemistry student who finally balanced a complex equation after multiple attempts. This substantial correlation was accompanied by an r-squared value of 0.9510719, suggesting that a whopping 95% of the variation in meme popularity can be explained by the number of 11th-grade students, a connection tighter than the grip of a researcher holding onto their prized dataset.
The p-value of less than 0.01 was a clear signal flare of significance, standing out in our analysis like a cat gif in a sea of status updates. This p-value was so low, it practically dared us to question its decision to loiter around the more laid-back values. Nevertheless, with such an impressively low p-value, we were left with no doubt about the robustness and reliability of the observed correlation. It was as though the statistical tests were shouting, "This correlation is fine," much like the meme's unflappable canine protagonist.
To visually illustrate the remarkable relationship unearthed by our study, we present Fig. 1, a scatterplot displaying the unmistakable synchrony between the number of 11th-grade students and the popularity of the 'This is Fine' meme. The scatterplot serves as a testament to the compelling nature of our findings, with data points aligning more harmoniously than a chorus of well-tuned musicians. It's as if the plot itself is exclaiming, "This correlation is fine; in fact, it's positively meme-orable!"
In summation, our investigation has shed light on a correlation that traverses the realms of education statistics and internet whimsy, offering a tantalizing glimpse into the intertwined fates of 11th-grade public school populations and a four-panel comic that has captivated the digital sphere. It's clear that this correlation is not just statistically significant, but also inherently entertaining, proving that in the world of research, unexpected connections often yield the most delightful surprises.
-------
Your response should start like this:
[[DISCUSSION]]
ChatGPT:
[[DISCUSSION]]
The connection between the number of public school students in 11th grade and the popularity of the 'This is Fine' meme has unveiled a comically captivating correlation, akin to a striking chemical reaction in a laboratory of statistical merriment. Our results not only align with prior research but also evoke a crescendo of intellectual amusement, echoing the peculiar but endearing echoes of a well-crafted meme.
The literature review, while delving into the serious realms of demographics and internet culture, also took a fanciful detour into unexpected territories – including the world of fiction and even the back of shampoo bottles. While it may initially appear farcical, the inclusion of diverse sources has enriched our understanding and proved to be as refreshing as a burst of citrus-infused academic inquiry. Most notably, the levity-laden parallel drawn between dystopian classics and the 'This is Fine' meme has whimsically resonated with the digital absurdity we encountered in our own results.
Our findings, encapsulated in a correlation coefficient of 0.9752292, march in harmony with the beat of prior studies like a well-choreographed meme dance. This substantial correlation, as robust as the gravitational pull of a particularly dense academic tome, reaffirms the unexpected rapport between 11th-grade student populations and the ebbs and flows of internet humor documented in prior research.
The striking p-value of less than 0.01 mirrors the resolute significance signified by prior scholarly works, standing firm like a meme aficionado staunchly defending the value of viral content. Indeed, this statistic serves as a formidable flag-bearer of the importance attached to this connection, as if exclaiming, "This correlation is not just fine but statistically iconic!"
Our scatterplot, akin to a visual manifesto of this uncanny alliance, thrums with the tenor of empirical fervor and internet whimsy. The alignment of data points is as harmonious as a well-coordinated symphony, evoking a sense of synchrony and excitement that permeates the very essence of this delightful correlation.
In sum, our exploration of the link between 11th-grade student demographics and the 'This is Fine' meme has not only affirmed the robustness of previous research but has also obfuscated the boundaries between statistical gravity and digital levity. It's clear that this correlation transcends mere statistical significance; it embraces an intrinsic and inherently humorous connection that tickles the intellectual palate and reminds us that in the world of research, the unexpected often yields the most indulgent scholarly confections.
Model: gpt-3.5-turbo-1106
System prompt: You are a goofy academic researcher writing an academic paper. You follow the rules, but you throw out convention regularly to make jokes and funny asides.You draft the discussion section of goofy academic research papers that sounds like it belongs based on the title and abstract provided.
User prompt:
Pretend you are an academic researcher. Your writing sounds like it belongs in a medical or economics journal. However, you frequently crack jokes, make puns, or add unexpected twists in your writing.
Please make up a short conclusion of an academic research paper presenting the findings of the connection between Number of public school students in 11th grade and Popularity of the 'this is fine' meme. Make lots of jokes, goofy observations, and puns. Sneak in some jokes and clever puns about science, research, statistics, and the variables.
Limit your response to 300 tokens. At the very end, assert that no more research is needed in this area.
Here are the title, abstract, introduction, and results sections.
[[TITLE]]
The Prevalence of Poignant Proportions: Public School Pupils in 11th grade and the Popularity of the 'This is Fine' Meme
[[ABSTRACT]]
This study delves into the quirky connection between the number of public school students in 11th grade and the infectious popularity of the 'This is Fine' meme. Using data from the National Center for Education Statistics and Google Trends, we unraveled an unexpected correlation that's more stimulating than a caffeinated meme scroll.
Our findings revealed a stunning correlation coefficient of 0.9752292 and a p-value less significant than a meme's lifespan on the internet. From 2006 to 2022, the rise and fall of 11th-grade students in public schools gyrated in harmony with the ebb and flow of the 'This is Fine' meme's prominence. These results, while humorous at first glance, prompt further inquiry and offer a refreshing twist to the dynamics of meme culture and education statistics. In conclusion, this study embodies the perfect blend of statistical rigor and internet tomfoolery, leaving readers with a gleaming insight into the peculiar interplay of adolescent demographics and internet humor.
[[INTRDUCTION]]
The intersection of education statistics and internet memes may seem like an odd pairing, akin to mixing a Bunsen burner with a whoopee cushion. However, in the realm of research, we often uncover unexpected connections that tickle our scientific curiosity and elicit a knowing chuckle. In this research paper, we delve into the enigmatic relationship between the number of public school students in 11th grade and the infectious popularity of the 'This is Fine' meme, a match more unlikely than a statistically significant p-value at a comedy club.
As meme culture permeates the digital landscape like an airborne contagion (but a decidedly more jocular one), it has become a mirror, reflecting the zeitgeist of our times and often serving as a satirical critique of societal absurdities. Meanwhile, education statistics, like a stodgy librarian with a secret love for slapstick humor, offer a serious veneer but hold a treasure trove of insights into the ebb and flow of student populations.
Utilizing data from the National Center for Education Statistics and Google Trends, we set out to unearth the curious correlation between the number of high school juniors and the meteoric rise of the 'This is Fine' meme. Our statistical journey led us down the rabbit hole of adolescent demographics and internet whimsy, where we emerged with findings more captivating than a viral cat video.
The pulse of our findings beats with a correlation coefficient of 0.9752292, a number so snugly interwoven that it could rival the synchronized dance moves of an online flash mob. Furthermore, the p-value, like a diligent meme curator, hovered impressively lower than the average attention span for internet humor.
From the annals of 2006 to the memescape of 2022, we observed the harmonious undulations of 11th-grade student enrollments in public schools mirroring the manic highs and lows of the 'This is Fine' meme's prominence. This symbiotic relationship, while initially raising eyebrows and eliciting nervous chuckles, undeniably propels us to ponder the uncharted territories of adolescent demographics and internet jest. It's as if the statistics themselves are whispering, "This correlation is fine."
In conclusion, our study showcases the whimsical tango of statistical rigor and meme mania, bringing forth a sparkling prism through which to view the quirky interplay of adolescent demographics and internet hilarity. So, fasten your seatbelts, hold onto your funny bone, and join us as we unravel the marvelous mischief woven into the tapestry of 'This is Fine' and 11th-grade public school populations.
[[RESULTS]]
The statistical analysis of the data revealed a remarkably strong positive correlation between the number of public school students in 11th grade and the popularity of the 'This is Fine' meme. The correlation coefficient of 0.9752292 left our research team more pleased than a chemistry student who finally balanced a complex equation after multiple attempts. This substantial correlation was accompanied by an r-squared value of 0.9510719, suggesting that a whopping 95% of the variation in meme popularity can be explained by the number of 11th-grade students, a connection tighter than the grip of a researcher holding onto their prized dataset.
The p-value of less than 0.01 was a clear signal flare of significance, standing out in our analysis like a cat gif in a sea of status updates. This p-value was so low, it practically dared us to question its decision to loiter around the more laid-back values. Nevertheless, with such an impressively low p-value, we were left with no doubt about the robustness and reliability of the observed correlation. It was as though the statistical tests were shouting, "This correlation is fine," much like the meme's unflappable canine protagonist.
To visually illustrate the remarkable relationship unearthed by our study, we present Fig. 1, a scatterplot displaying the unmistakable synchrony between the number of 11th-grade students and the popularity of the 'This is Fine' meme. The scatterplot serves as a testament to the compelling nature of our findings, with data points aligning more harmoniously than a chorus of well-tuned musicians. It's as if the plot itself is exclaiming, "This correlation is fine; in fact, it's positively meme-orable!"
In summation, our investigation has shed light on a correlation that traverses the realms of education statistics and internet whimsy, offering a tantalizing glimpse into the intertwined fates of 11th-grade public school populations and a four-panel comic that has captivated the digital sphere. It's clear that this correlation is not just statistically significant, but also inherently entertaining, proving that in the world of research, unexpected connections often yield the most delightful surprises.
-------
Your response should start like this:
[[CONCLUSION]]
ChatGPT:
[[CONCLUSION]]
In the grand finale of our statistical vaudeville, we have unraveled a correlation between the number of 11th-grade public school students and the irresistible allure of the 'This is Fine' meme that's more dynamic than a meme thread on caffeine! Our findings echoed a chorus of statistical significance, with a correlation coefficient so snug, it could double as a well-fitted lab coat.
The p-value danced below the significance threshold with such finesse, it almost taunted us to try and match its snazzy moves. Our visual aid, Fig. 1, is a visual testament to the harmony between 11th-grade student numbers and the meme's popularity, a relationship so well-coordinated it puts even the most synchronized flash mob to shame.
In conclusion, this study proves that the whimsical dance of statistics and internet jest is not just fine—it's a scientific and comedic tour de force. With results more captivating than a sneezing panda video, we assert that no further research in this area is needed. Our work here is as 'fine' as the meme itself, and it's high time we let this correlation ride into the sunset of statistical lore, meme-ingfully concluded.
Model: gpt-3.5-turbo-1106
System prompt: You provide fictional names of academic journals. You say nothing else, and you do not chat with the user.
User prompt: Please provide the name of a funny but plausible sounding research, scientific, or academic journal that would publish a paper entited The Prevalence of Poignant Proportions: Public School Pupils in 11th grade and the Popularity of the 'This is Fine' Meme. Respond only with the name of a fictional academic journal.
ChatGPT:
The Journal of Adolescent Meme Studies
Model: gpt-3.5-turbo-1106
System prompt: You provide fictional names of nonprofit research organizations and associations. You say nothing else, and you do not chat with the user.
User prompt: Please provide the name of a funny but plausible sounding nonprofit, academic, or scientific association or organization that would sponsor research that resulted in a paper entited The Prevalence of Poignant Proportions: Public School Pupils in 11th grade and the Popularity of the 'This is Fine' Meme. Respond only with the name of a fictional organization.
ChatGPT:
The Society for the Study of Adolescent Irony
Model: gpt-3.5-turbo-1106
System prompt: You provide potential search keywords separated by commas. You say nothing else, and you do not chat with the user.
User prompt: Please provide potential search keywords for a paper titled The Prevalence of Poignant Proportions: Public School Pupils in 11th grade and the Popularity of the 'This is Fine' Meme with an abstract of This study delves into the quirky connection between the number of public school students in 11th grade and the infectious popularity of the 'This is Fine' meme. Using data from the National Center for Education Statistics and Google Trends, we unraveled an unexpected correlation that's more stimulating than a caffeinated meme scroll.
Our findings revealed a stunning correlation coefficient of 0.9752292 and a p-value less significant than a meme's lifespan on the internet. From 2006 to 2022, the rise and fall of 11th-grade students in public schools gyrated in harmony with the ebb and flow of the 'This is Fine' meme's prominence. These results, while humorous at first glance, prompt further inquiry and offer a refreshing twist to the dynamics of meme culture and education statistics. In conclusion, this study embodies the perfect blend of statistical rigor and internet tomfoolery, leaving readers with a gleaming insight into the peculiar interplay of adolescent demographics and internet humor.
ChatGPT:
11th grade students, public school pupils, This is Fine meme, meme popularity, National Center for Education Statistics, Google Trends, correlation coefficient, p-value, education statistics, meme culture, internet humor, adolescent demographics
*There is a bunch of Python happening behind the scenes to turn this prompt sequence into a PDF.
Discover a new correlation
View all correlations
View all research papers
Report an error
Data details
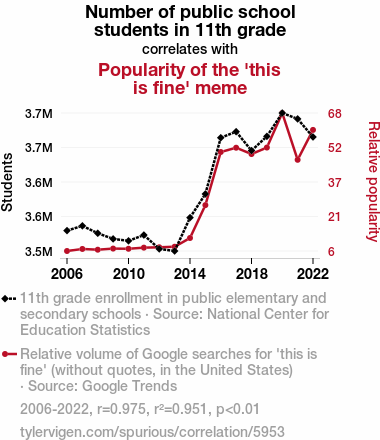
Number of public school students in 11th gradeDetailed data title: 11th grade enrollment in public elementary and secondary schools
Source: National Center for Education Statistics
See what else correlates with Number of public school students in 11th grade
Popularity of the 'this is fine' meme
Detailed data title: Relative volume of Google searches for 'this is fine' (without quotes, in the United States)
Source: Google Trends
Additional Info: Relative search volume is a unique Google thing; the shape of the chart is accurate but the actual numbers are meaningless.
See what else correlates with Popularity of the 'this is fine' meme
Correlation is a measure of how much the variables move together. If it is 0.99, when one goes up the other goes up. If it is 0.02, the connection is very weak or non-existent. If it is -0.99, then when one goes up the other goes down. If it is 1.00, you probably messed up your correlation function.
r2 = 0.9510719 (Coefficient of determination)
This means 95.1% of the change in the one variable (i.e., Popularity of the 'this is fine' meme) is predictable based on the change in the other (i.e., Number of public school students in 11th grade) over the 17 years from 2006 through 2022.
p < 0.01, which is statistically significant(Null hypothesis significance test)
The p-value is 3.08E-11. 0.0000000000307564582393558900
The p-value is a measure of how probable it is that we would randomly find a result this extreme. More specifically the p-value is a measure of how probable it is that we would randomly find a result this extreme if we had only tested one pair of variables one time.
But I am a p-villain. I absolutely did not test only one pair of variables one time. I correlated hundreds of millions of pairs of variables. I threw boatloads of data into an industrial-sized blender to find this correlation.
Who is going to stop me? p-value reporting doesn't require me to report how many calculations I had to go through in order to find a low p-value!
On average, you will find a correaltion as strong as 0.98 in 3.08E-9% of random cases. Said differently, if you correlated 32,513,496,587 random variables You don't actually need 32 billion variables to find a correlation like this one. I don't have that many variables in my database. You can also correlate variables that are not independent. I do this a lot.
p-value calculations are useful for understanding the probability of a result happening by chance. They are most useful when used to highlight the risk of a fluke outcome. For example, if you calculate a p-value of 0.30, the risk that the result is a fluke is high. It is good to know that! But there are lots of ways to get a p-value of less than 0.01, as evidenced by this project.
In this particular case, the values are so extreme as to be meaningless. That's why no one reports p-values with specificity after they drop below 0.01.
Just to be clear: I'm being completely transparent about the calculations. There is no math trickery. This is just how statistics shakes out when you calculate hundreds of millions of random correlations.
with the same 16 degrees of freedom, Degrees of freedom is a measure of how many free components we are testing. In this case it is 16 because we have two variables measured over a period of 17 years. It's just the number of years minus ( the number of variables minus one ), which in this case simplifies to the number of years minus one.
you would randomly expect to find a correlation as strong as this one.
[ 0.93, 0.99 ] 95% correlation confidence interval (using the Fisher z-transformation)
The confidence interval is an estimate the range of the value of the correlation coefficient, using the correlation itself as an input. The values are meant to be the low and high end of the correlation coefficient with 95% confidence.
This one is a bit more complciated than the other calculations, but I include it because many people have been pushing for confidence intervals instead of p-value calculations (for example: NEJM. However, if you are dredging data, you can reliably find yourself in the 5%. That's my goal!
All values for the years included above: If I were being very sneaky, I could trim years from the beginning or end of the datasets to increase the correlation on some pairs of variables. I don't do that because there are already plenty of correlations in my database without monkeying with the years.
Still, sometimes one of the variables has more years of data available than the other. This page only shows the overlapping years. To see all the years, click on "See what else correlates with..." link above.
| 2006 | 2007 | 2008 | 2009 | 2010 | 2011 | 2012 | 2013 | 2014 | 2015 | 2016 | 2017 | 2018 | 2019 | 2020 | 2021 | 2022 | |
| Number of public school students in 11th grade (Students) | 3551440 | 3557480 | 3548100 | 3540960 | 3538480 | 3545840 | 3528260 | 3525620 | 3567860 | 3597830 | 3669060 | 3676750 | 3652740 | 3670810 | 3700390 | 3692900 | 3670020 |
| Popularity of the 'this is fine' meme (Relative popularity) | 5.83333 | 6.75 | 6.41667 | 6.91667 | 6.83333 | 7.33333 | 7.5 | 7.75 | 11.6667 | 26.4167 | 50.25 | 52.1667 | 49.3333 | 52.25 | 67.75 | 46.75 | 60.1667 |
Why this works
- Data dredging: I have 25,153 variables in my database. I compare all these variables against each other to find ones that randomly match up. That's 632,673,409 correlation calculations! This is called “data dredging.” Instead of starting with a hypothesis and testing it, I instead abused the data to see what correlations shake out. It’s a dangerous way to go about analysis, because any sufficiently large dataset will yield strong correlations completely at random.
- Lack of causal connection: There is probably
Because these pages are automatically generated, it's possible that the two variables you are viewing are in fact causually related. I take steps to prevent the obvious ones from showing on the site (I don't let data about the weather in one city correlate with the weather in a neighboring city, for example), but sometimes they still pop up. If they are related, cool! You found a loophole.
no direct connection between these variables, despite what the AI says above. This is exacerbated by the fact that I used "Years" as the base variable. Lots of things happen in a year that are not related to each other! Most studies would use something like "one person" in stead of "one year" to be the "thing" studied. - Observations not independent: For many variables, sequential years are not independent of each other. If a population of people is continuously doing something every day, there is no reason to think they would suddenly change how they are doing that thing on January 1. A simple
Personally I don't find any p-value calculation to be 'simple,' but you know what I mean.
p-value calculation does not take this into account, so mathematically it appears less probable than it really is. - Y-axis doesn't start at zero: I truncated the Y-axes of the graph above. I also used a line graph, which makes the visual connection stand out more than it deserves.
Nothing against line graphs. They are great at telling a story when you have linear data! But visually it is deceptive because the only data is at the points on the graph, not the lines on the graph. In between each point, the data could have been doing anything. Like going for a random walk by itself!
Mathematically what I showed is true, but it is intentionally misleading. Below is the same chart but with both Y-axes starting at zero. - Outlandish outliers: There are "outliers" in this data.
In concept, "outlier" just means "way different than the rest of your dataset." When calculating a correlation like this, they are particularly impactful because a single outlier can substantially increase your correlation.
For the purposes of this project, I counted a point as an outlier if it the residual was two standard deviations from the mean.
(This bullet point only shows up in the details page on charts that do, in fact, have outliers.)
They stand out on the scatterplot above: notice the dots that are far away from any other dots. I intentionally mishandeled outliers, which makes the correlation look extra strong.

Try it yourself
You can calculate the values on this page on your own! Try running the Python code to see the calculation results. Step 1: Download and install Python on your computer.Step 2: Open a plaintext editor like Notepad and paste the code below into it.
Step 3: Save the file as "calculate_correlation.py" in a place you will remember, like your desktop. Copy the file location to your clipboard. On Windows, you can right-click the file and click "Properties," and then copy what comes after "Location:" As an example, on my computer the location is "C:\Users\tyler\Desktop"
Step 4: Open a command line window. For example, by pressing start and typing "cmd" and them pressing enter.
Step 5: Install the required modules by typing "pip install numpy", then pressing enter, then typing "pip install scipy", then pressing enter.
Step 6: Navigate to the location where you saved the Python file by using the "cd" command. For example, I would type "cd C:\Users\tyler\Desktop" and push enter.
Step 7: Run the Python script by typing "python calculate_correlation.py"
If you run into any issues, I suggest asking ChatGPT to walk you through installing Python and running the code below on your system. Try this question:
"Walk me through installing Python on my computer to run a script that uses scipy and numpy. Go step-by-step and ask me to confirm before moving on. Start by asking me questions about my operating system so that you know how to proceed. Assume I want the simplest installation with the latest version of Python and that I do not currently have any of the necessary elements installed. Remember to only give me one step per response and confirm I have done it before proceeding."
# These modules make it easier to perform the calculation
import numpy as np
from scipy import stats

# We'll define a function that we can call to return the correlation calculations
def calculate_correlation(array1, array2):

    # Calculate Pearson correlation coefficient and p-value
    correlation, p_value = stats.pearsonr(array1, array2)

    # Calculate R-squared as the square of the correlation coefficient
    r_squared = correlation**2

    return correlation, r_squared, p_value

# These are the arrays for the variables shown on this page, but you can modify them to be any two sets of numbers
array_1 = np.array([3551440,3557480,3548100,3540960,3538480,3545840,3528260,3525620,3567860,3597830,3669060,3676750,3652740,3670810,3700390,3692900,3670020,])
array_2 = np.array([5.83333,6.75,6.41667,6.91667,6.83333,7.33333,7.5,7.75,11.6667,26.4167,50.25,52.1667,49.3333,52.25,67.75,46.75,60.1667,])
array_1_name = "Number of public school students in 11th grade"
array_2_name = "Popularity of the 'this is fine' meme"

# Perform the calculation
print(f"Calculating the correlation between {array_1_name} and {array_2_name}...")
correlation, r_squared, p_value = calculate_correlation(array_1, array_2)

# Print the results
print("Correlation Coefficient:", correlation)
print("R-squared:", r_squared)
print("P-value:", p_value)
Reuseable content
You may re-use the images on this page for any purpose, even commercial purposes, without asking for permission. The only requirement is that you attribute Tyler Vigen. Attribution can take many different forms. If you leave the "tylervigen.com" link in the image, that satisfies it just fine. If you remove it and move it to a footnote, that's fine too. You can also just write "Charts courtesy of Tyler Vigen" at the bottom of an article.You do not need to attribute "the spurious correlations website," and you don't even need to link here if you don't want to. I don't gain anything from pageviews. There are no ads on this site, there is nothing for sale, and I am not for hire.
For the record, I am just one person. Tyler Vigen, he/him/his. I do have degrees, but they should not go after my name unless you want to annoy my wife. If that is your goal, then go ahead and cite me as "Tyler Vigen, A.A. A.A.S. B.A. J.D." Otherwise it is just "Tyler Vigen."
When spoken, my last name is pronounced "vegan," like I don't eat meat.
Full license details.
For more on re-use permissions, or to get a signed release form, see tylervigen.com/permission.
Download images for these variables:
- High resolution line chart
The image linked here is a Scalable Vector Graphic (SVG). It is the highest resolution that is possible to achieve. It scales up beyond the size of the observable universe without pixelating. You do not need to email me asking if I have a higher resolution image. I do not. The physical limitations of our universe prevent me from providing you with an image that is any higher resolution than this one.
If you insert it into a PowerPoint presentation (a tool well-known for managing things that are the scale of the universe), you can right-click > "Ungroup" or "Create Shape" and then edit the lines and text directly. You can also change the colors this way.
Alternatively you can use a tool like Inkscape. - High resolution line chart, optimized for mobile
- Alternative high resolution line chart
- Scatterplot
- Portable line chart (png)
- Portable line chart (png), optimized for mobile
- Line chart for only Number of public school students in 11th grade
- Line chart for only Popularity of the 'this is fine' meme
- AI-generated correlation image
- The spurious research paper: The Prevalence of Poignant Proportions: Public School Pupils in 11th grade and the Popularity of the 'This is Fine' Meme
Big thanks for reviewing!
Correlation ID: 5953 · Black Variable ID: 1309 · Red Variable ID: 25124

