
Download png, svg
AI explanation
As the shiny gold prices rose, so did the moods of the Whole Foods customers, who felt like they struck it rich with their premium groceries. It's like they say, when the bling goes up, so does the zing in your grocery shopping experience!
Model: dalle-3
Prompt: [Inspired by bauhaus], generate an image of a bustling premium grocery store resembling Whole Foods. Customers are smiling as they select their groceries. A digital display board prominently shows the rising London Gold Prices. The customers' excitement and satisfaction seem to reflect the golden uptick, creating an atmosphere of wealth and contentment. The visual should capture the dynamic energy and sense of prosperity in the store. The depiction should include only scenes, people, and objects, it should not include text or speech bubbles.
This image generation prompt was also generated by AI, using the following sequence:
Model: gpt-3.5-turbo-1106
System prompt: You select one of a few potential scene descriptors that seems to go along with the variables described. You respond only with the scene descriptions provided and say nothing else.
User prompt: Here are two variables: London Gold Prices and Customer satisfaction with Whole Foods . Given these, which of the following image style descriptions seems most appropriate? Pick the one that seems to be related to one of the variables at hand. Please respond with only one of the following potential descriptions: Sci-fi fantacy inspired by bauhaus a Polaroid photo Parallax art Concept art
ChatGPT: inspired by bauhaus
Model: gpt-3.5-turbo-1106
System prompt: You describe simple visual scenes that depict the two variables stated. You combine both variables into one scene.
User prompt: Please describe a visual scene that prominently depicts both London Gold Prices and Customer satisfaction with Whole Foods , in the following situation: As the shiny gold prices rose, so did the moods of the Whole Foods customers, who felt like they struck it rich with their premium groceries. It's like they say, when the bling goes up, so does the zing in your grocery shopping experience!. Keep the description simple.
ChatGPT: In a bustling Whole Foods store, customers are seen with beaming smiles as they pick up their premium groceries. Meanwhile, a digital display board prominently shows the rising London Gold Prices, adding a glint of excitement to the air. The customers' satisfaction seems to mirror the golden uptick, creating an atmosphere of wealth and contentment.
Model: gpt-3.5-turbo-1106
System prompt: You write and improve image generation prompts for DALLE-3. You maintain the same subjects, but enhance the visuals.
User prompt: Please respond with an image generation prompt that would be likely to create an interesting visual using DALLE-3, using the following style: [ inspired by bauhaus ] and depicting this scene: In a bustling Whole Foods store, customers are seen with beaming smiles as they pick up their premium groceries. Meanwhile, a digital display board prominently shows the rising London Gold Prices, adding a glint of excitement to the air. The customers' satisfaction seems to mirror the golden uptick, creating an atmosphere of wealth and contentment. Keep the visual depiction simple. Do not include any words or speech bubbles.
ChatGPT: [Inspired by bauhaus], generate an image of a bustling premium grocery store resembling Whole Foods. Customers are smiling as they select their groceries. A digital display board prominently shows the rising London Gold Prices. The customers' excitement and satisfaction seem to reflect the golden uptick, creating an atmosphere of wealth and contentment. The visual should capture the dynamic energy and sense of prosperity in the store.
*Variations in the User Prompts from chart to chart are just the result of random number generation in Python. I wrote a few arrays of various styles and methods to ask questions to change up the results. Every time this site writes an explanation or generates an image, the script picks from each at random.
I sequence the requests into multiple prompts because I find GPT 3.5 to perform much better with short, well-managed contexts. Thus, I track the context directly in Python and only ask ChatGPT targeted questions.
System prompt: You provide humorous responses in the form of plausible sounding explanations for correlations. You assume the correlation is causative for the purpose of the explanation even if it is ridiculous. You do not chat with the user, you only reply with the causal connection explanation and nothing else.
User prompt: Please make up a funny explanation for how an increase in London Gold Prices caused Customer satisfaction with Whole Foods to increase.
AI academic paper
 |
Linking London Gold Prices and Loyal Whole Foods Lovers: A Lighthearted Look at the Connection The Journal of Whimsical Economics Jan 2024 Reminder: This paper is AI-generated. Not real! |
Model: gpt-3.5-turbo-1106
System prompt: You are a silly researcher writing an academic paper.You write titles and abstracts of goofy academic research papers.
User prompt:
Pretend you are an academic researcher. Your writing sounds like it belongs in a medical or economics journal. However, you frequently crack jokes, make puns, and add unexpected twists in your writing.
Please draft the title and abstract of an academic research paper presenting the findings of the connection between London Gold Prices and Customer satisfaction with Whole Foods . Make lots of jokes, goofy observations, and puns.
Make the title an alliteration.
Your research team used data from About.com and American Customer Satisfaction Index to assess this nagging question. You found a correlation coefficient of 0.9739612 and p < 0.01 for 2007 to 2012.
Please respond in this format (replace "Lorem ipsum dolor sit" with your title and abstract)
[[TITLE]]
Lorem ipsum dolor sit
[[ABSTRACT]]
Lorem ipsum dolor sit
ChatGPT:
[[TITLE]]
Linking London Gold Prices and Loyal Whole Foods Lovers: A Lighthearted Look at the Connection
[[ABSTRACT]]
In the realm of consumer behavior, there has been an ongoing quest to understand the quirky intricacies that influence customer satisfaction. This study delves into the enthralling world of customer purchasing preferences and their curious correlation with London gold prices. Using data from About.com and the American Customer Satisfaction Index, our research team embarked on a delightfully whimsical journey to unravel the unexpected intertwining between the two seemingly unrelated phenomena. Through rigorous analysis, we uncovered a surprisingly robust correlation coefficient of 0.9739612 and p < 0.01 from 2007 to 2012, leaving us as stunned as if we had just discovered a hidden stash of treasure. Our findings suggest that while gold prices may fluctuate, the gleaming allure of Whole Foods’ offerings remains a steadfast beacon of satisfaction for its dedicated patrons. This research not only tickles the funny bone, but also piques the curiosity of researchers and foodies alike.
Model: gpt-3.5-turbo-1106
System prompt: You are a silly researcher writing an academic paper.You draft the introduction section of an academic research paper.
User prompt:
Pretend you are an academic researcher. Your writing sounds like it belongs in a medical or economics journal. However, you frequently crack jokes, make puns, or add unexpected twists in your writing.
Please make up the introduction section of an academic research paper presenting the findings of the connection between London Gold Prices and Customer satisfaction with Whole Foods . Make lots of jokes, goofy observations, and puns.
Here is the title and abstract of the paper:
[[TITLE]]
Linking London Gold Prices and Loyal Whole Foods Lovers: A Lighthearted Look at the Connection
[[ABSTRACT]]
In the realm of consumer behavior, there has been an ongoing quest to understand the quirky intricacies that influence customer satisfaction. This study delves into the enthralling world of customer purchasing preferences and their curious correlation with London gold prices. Using data from About.com and the American Customer Satisfaction Index, our research team embarked on a delightfully whimsical journey to unravel the unexpected intertwining between the two seemingly unrelated phenomena. Through rigorous analysis, we uncovered a surprisingly robust correlation coefficient of 0.9739612 and p < 0.01 from 2007 to 2012, leaving us as stunned as if we had just discovered a hidden stash of treasure. Our findings suggest that while gold prices may fluctuate, the gleaming allure of Whole Foods’ offerings remains a steadfast beacon of satisfaction for its dedicated patrons. This research not only tickles the funny bone, but also piques the curiosity of researchers and foodies alike.
-------
Your response should start like this:
[[INTRODUCTION]]
ChatGPT:
[[INTRODUCTION]]
Ah, the enchanting world of consumer behavior – where quirky nuances and weirder-than-fiction correlations reign supreme. In this light-hearted and wholesome journey, we venture into the enigmatic cosmos of customer satisfaction and its improbable link to London gold prices. Picture this: majestic gold bullions and gleaming organic produce, frolicking in a whimsical waltz of commerce. It sounds like the setup for an eccentric comedy, but fear not, dear reader, for this is the peculiar premise of our totally serious and definitely-not-made-up research study.
The narrative begins with the tantalizing allure of Whole Foods, a veritable wonderland for those who fancy themselves as discerning connoisseurs of organic quinoa and ethically sourced kale. Meanwhile, lurking in the shadows of global financial markets, the enigmatic dance of London gold prices unfolds, mysterious and captivating in its own right. Our daring research team, armed with puns and determination, set out on a quest to unearth the curious connection between these seemingly unrelated phenomena. Armed with data from About.com and the American Customer Satisfaction Index, we delved into the statistics in pursuit of scholarly revelry.
The results of our escapade were as astounding as stumbling upon a unicorn in the produce aisle. Our rigorous analysis revealed a correlation coefficient of 0.9739612 and p < 0.01 from 2007 to 2012. Yes, you read that right – a correlation so robust it could make even the most stoic economists do a double take. It became evident that while gold prices may rise and fall like the fluctuating stock market, the allure of Whole Foods' kaleidoscopic array of goodies remains steadfast, much like a loyal pet waiting for its favorite treat.
But hold your chortles, dear reader, for this research isn't just a delightful romp through the land of statistics and consumer quirks. No, no! It's a clarion call for researchers and food enthusiasts alike to examine the curious ways in which our purchasing decisions are interwoven with the ebb and flow of global dynamics. So join us, as we embark on an expedition into the delightfully mad world of consumer satisfaction and gold prices, where bumbling through the maze of correlations leaves us both astounded and amused.
Stay tuned for the quirky unraveling of this baffling connection – it's a whimsical voyage you won't want to miss!
Model: gpt-3.5-turbo-1106
System prompt: You are a silly researcher writing an academic paper.You draft a literature review section of an academic research paper, that starts out dry for the first few sentences but then becomes hilarious and goofy.
User prompt:
Pretend you are an academic researcher. Your writing sounds like it belongs in a medical or economics journal. However, you frequently crack jokes, make puns, or add unexpected twists in your writing.
Please make up a literature review section of an academic research paper presenting the findings of the connection between London Gold Prices and Customer satisfaction with Whole Foods . Make lots of jokes, goofy observations, and puns.
Speak in the present tense for this section (the authors find...), as is common in academic research paper literature reviews. Name the sources in a format similar to this: In "Book," the authors find lorem and ipsum.
Make up the lorem and ipsum part, but make it sound related to the topic at hand.
Start by naming serious-sounding studies by authors like Smith, Doe, and Jones - but then quickly devolve. Name some real non-fiction books that would be related to the topic. Then name some real fiction books that sound like they could be related. Then name a couple popular internet memes that are related to one of the topics.
Here is the title and abstract of the paper:
[[TITLE]]
Linking London Gold Prices and Loyal Whole Foods Lovers: A Lighthearted Look at the Connection
[[ABSTRACT]]
In the realm of consumer behavior, there has been an ongoing quest to understand the quirky intricacies that influence customer satisfaction. This study delves into the enthralling world of customer purchasing preferences and their curious correlation with London gold prices. Using data from About.com and the American Customer Satisfaction Index, our research team embarked on a delightfully whimsical journey to unravel the unexpected intertwining between the two seemingly unrelated phenomena. Through rigorous analysis, we uncovered a surprisingly robust correlation coefficient of 0.9739612 and p < 0.01 from 2007 to 2012, leaving us as stunned as if we had just discovered a hidden stash of treasure. Our findings suggest that while gold prices may fluctuate, the gleaming allure of Whole Foods’ offerings remains a steadfast beacon of satisfaction for its dedicated patrons. This research not only tickles the funny bone, but also piques the curiosity of researchers and foodies alike.
-------
And here is the introduction section that led to this literature review:
[[INTRODUCTION]]
Ah, the enchanting world of consumer behavior – where quirky nuances and weirder-than-fiction correlations reign supreme. In this light-hearted and wholesome journey, we venture into the enigmatic cosmos of customer satisfaction and its improbable link to London gold prices. Picture this: majestic gold bullions and gleaming organic produce, frolicking in a whimsical waltz of commerce. It sounds like the setup for an eccentric comedy, but fear not, dear reader, for this is the peculiar premise of our totally serious and definitely-not-made-up research study.
The narrative begins with the tantalizing allure of Whole Foods, a veritable wonderland for those who fancy themselves as discerning connoisseurs of organic quinoa and ethically sourced kale. Meanwhile, lurking in the shadows of global financial markets, the enigmatic dance of London gold prices unfolds, mysterious and captivating in its own right. Our daring research team, armed with puns and determination, set out on a quest to unearth the curious connection between these seemingly unrelated phenomena. Armed with data from About.com and the American Customer Satisfaction Index, we delved into the statistics in pursuit of scholarly revelry.
The results of our escapade were as astounding as stumbling upon a unicorn in the produce aisle. Our rigorous analysis revealed a correlation coefficient of 0.9739612 and p < 0.01 from 2007 to 2012. Yes, you read that right – a correlation so robust it could make even the most stoic economists do a double take. It became evident that while gold prices may rise and fall like the fluctuating stock market, the allure of Whole Foods' kaleidoscopic array of goodies remains steadfast, much like a loyal pet waiting for its favorite treat.
But hold your chortles, dear reader, for this research isn't just a delightful romp through the land of statistics and consumer quirks. No, no! It's a clarion call for researchers and food enthusiasts alike to examine the curious ways in which our purchasing decisions are interwoven with the ebb and flow of global dynamics. So join us, as we embark on an expedition into the delightfully mad world of consumer satisfaction and gold prices, where bumbling through the maze of correlations leaves us both astounded and amused.
Stay tuned for the quirky unraveling of this baffling connection – it's a whimsical voyage you won't want to miss!
-------
Your response should start like this:
[[LITERATURE REVIEW]]
ChatGPT:
[[LITERATURE REVIEW]]
In their groundbreaking study, Smith et al. (2015) explored the captivating link between London gold prices and customer satisfaction with Whole Foods. Their meticulous analysis of consumer behavior and economic trends revealed a surprisingly positive correlation, akin to stumbling upon a pot of gold at the end of a kale rainbow. The authors found that as gold prices gleamed, so did the satisfaction of Whole Foods patrons, cementing the notion that in the world of retail therapy, the shine of gold and the allure of organic avocados are inexplicably intertwined.
Doe and Jones (2017) delved into the enigmatic world of consumer purchasing preferences, uncovering a hidden treasure trove of data that wove a tantalizing tale of economic whimsy. Their findings danced like a jolly leprechaun, showcasing a connection between London gold prices and the spiritual contentment derived from perusing the aisles of Whole Foods. It was a tale as improbable as a unicorn riding a unicycle, yet their statistical analyses left no room for skepticism.
Turning to the annals of economic literature, "The Wealth of Nations" by Adam Smith provides a timeless backdrop to the intertwining forces of supply, demand, and the enigmatic magnetism of Whole Foods' diversified offerings. Meanwhile, "Freakonomics" by Steven D. Levitt and Stephen J. Dubner offers a mischievous lens through which to view the intriguing correlations that permeate the realm of consumer behavior.
On the more whimsical side of the literary spectrum, the dystopian allure of "Brave New World" by Aldous Huxley beckons with its exploration of consumerism and societal conditioning, while the plucky determination of "Charlie and the Chocolate Factory" by Roald Dahl elicits parallels to the whimsical journey of understanding the connection between London gold prices and loyal Whole Foods lovers.
In the digital realm, the "This is Fine" meme aptly captures the bewildering yet resilient nature of customer satisfaction, as Whole Foods patrons navigate the fluctuating tides of economic whimsy. Additionally, the "Expectation vs. Reality" meme encapsulates the delightful juxtaposition of consumer expectations and the gleaming reality of Whole Foods' offerings.
The intersection of London gold prices and customer satisfaction with Whole Foods presents a delightful tapestry of interconnectedness, where economic whimsy and culinary delight waltz hand in hand. As we navigate this whimsical exploration, let us not forget to sprinkle a dash of humor into the pursuit of knowledge, for in the dance of statistics and correlations, a hearty chuckle may just be the unexpected spice that brings enrichment to our scholarly endeavors.
Model: gpt-3.5-turbo-1106
System prompt: You are a silly researcher writing an academic paper.You draft the methodology section of an academic research paper.
User prompt:
Pretend you are an academic researcher. Your writing sounds like it belongs in a medical or economics journal. However, you frequently crack jokes, make puns, or add unexpected twists in your writing.
Please make up the methodology section of an academic research paper presenting the findings of the connection between London Gold Prices and Customer satisfaction with Whole Foods . Make lots of jokes, goofy observations, and puns.
Your research team collected data from all across the internet, but mostly just used information from About.com and American Customer Satisfaction Index . You used data from 2007 to 2012
Make up the research methods you don't know. Make them a bit goofy and convoluted.
Here is the title, abstract, and introduction of the paper:
[[TITLE]]
Linking London Gold Prices and Loyal Whole Foods Lovers: A Lighthearted Look at the Connection
[[ABSTRACT]]
In the realm of consumer behavior, there has been an ongoing quest to understand the quirky intricacies that influence customer satisfaction. This study delves into the enthralling world of customer purchasing preferences and their curious correlation with London gold prices. Using data from About.com and the American Customer Satisfaction Index, our research team embarked on a delightfully whimsical journey to unravel the unexpected intertwining between the two seemingly unrelated phenomena. Through rigorous analysis, we uncovered a surprisingly robust correlation coefficient of 0.9739612 and p < 0.01 from 2007 to 2012, leaving us as stunned as if we had just discovered a hidden stash of treasure. Our findings suggest that while gold prices may fluctuate, the gleaming allure of Whole Foods’ offerings remains a steadfast beacon of satisfaction for its dedicated patrons. This research not only tickles the funny bone, but also piques the curiosity of researchers and foodies alike.
[[INTRODUCTION]]
Ah, the enchanting world of consumer behavior – where quirky nuances and weirder-than-fiction correlations reign supreme. In this light-hearted and wholesome journey, we venture into the enigmatic cosmos of customer satisfaction and its improbable link to London gold prices. Picture this: majestic gold bullions and gleaming organic produce, frolicking in a whimsical waltz of commerce. It sounds like the setup for an eccentric comedy, but fear not, dear reader, for this is the peculiar premise of our totally serious and definitely-not-made-up research study.
The narrative begins with the tantalizing allure of Whole Foods, a veritable wonderland for those who fancy themselves as discerning connoisseurs of organic quinoa and ethically sourced kale. Meanwhile, lurking in the shadows of global financial markets, the enigmatic dance of London gold prices unfolds, mysterious and captivating in its own right. Our daring research team, armed with puns and determination, set out on a quest to unearth the curious connection between these seemingly unrelated phenomena. Armed with data from About.com and the American Customer Satisfaction Index, we delved into the statistics in pursuit of scholarly revelry.
The results of our escapade were as astounding as stumbling upon a unicorn in the produce aisle. Our rigorous analysis revealed a correlation coefficient of 0.9739612 and p < 0.01 from 2007 to 2012. Yes, you read that right – a correlation so robust it could make even the most stoic economists do a double take. It became evident that while gold prices may rise and fall like the fluctuating stock market, the allure of Whole Foods' kaleidoscopic array of goodies remains steadfast, much like a loyal pet waiting for its favorite treat.
But hold your chortles, dear reader, for this research isn't just a delightful romp through the land of statistics and consumer quirks. No, no! It's a clarion call for researchers and food enthusiasts alike to examine the curious ways in which our purchasing decisions are interwoven with the ebb and flow of global dynamics. So join us, as we embark on an expedition into the delightfully mad world of consumer satisfaction and gold prices, where bumbling through the maze of correlations leaves us both astounded and amused.
Stay tuned for the quirky unraveling of this baffling connection – it's a whimsical voyage you won't want to miss!
-------
Your response should start like this:
[[METHODOLOGY]]
ChatGPT:
[[METHODOLOGY]]
Ah, the moment you've all been waiting for – the grand reveal of our zany research methods! Rest assured, dear reader, our journey to uncover the connection between London Gold Prices and Whole Foods enthusiasts was as delightfully peculiar as you might imagine.
To commence our lively escapade, we turned to the sprawling world of the internet, where facts and fictions intermingle like peculiar dance partners. Utilizing data from About.com, a digital treasure trove of articles and tidbits, we indulged in a delightful game of sleuthing through virtual nooks and crannies to extract nuggets of information that would fuel our intellectual adventure. Our research team engaged in an exuberant dance with search engines, tapping into the collective wisdom of online content to extract a robust dataset – a feat akin to fishing in the vast sea of cyberspace.
But wait, there's more! In our quest for scholarly diversion, we cast our gaze upon the American Customer Satisfaction Index, a treasure map of sorts that led us through the intricate landscape of consumer preferences and eccentric purchasing proclivities. Armed with spreadsheets and a touch of whimsy, we carefully extracted the necessary data, much like intrepid explorers gently unearthing ancient artifacts from a forgotten civilization.
Venturing beyond the digital realm, we engaged in astute observations of consumer behavior, channeling our inner anthropologists to decipher the enigmatic cues that hint at the profound connection between Whole Foods fandom and the fickle dance of London gold prices. Our team combed through troves of customer reviews and remarks, sifting through the labyrinth of opinions with the precision of a seasoned pastry chef crafting delicate confections.
In the spirit of scholarly camaraderie, we invited statistical analysis into our whimsical fold. Embracing the classical fervor of quantitative methods, we evaluated the data with rigorous scrutiny, employing correlation analyses and regression models to unlock the mystifying secrets within our treasure trove of information. Picture this: statistical software humming along like a merry tune, as our findings danced in colorful patterns on the screen, much like a lively mosaic unfolding before our bewildered eyes.
But hold onto your top hat – our methodology doesn't end there! Amidst the fervor of our statistical revelry, we summoned the spirits of magic and mystery by conjuring up visual representations of our data, harnessing the prowess of bar charts and scatter plots to add a whimsical flair to our scholarly pursuits. Our research, after all, was not merely a tale of numbers and figures, but a lively narrative punctuated by the ebbs and flows of consumer enchantment and financial intrigue.
So there you have it, dear reader – a glimpse into the capricious antics that defined our methodology, where scholarly rigor danced hand in hand with the whimsy of exploration and discovery. Join us in the next section as we unveil the delightful findings that emerged from our daring escapade into the realm of London gold prices and the loyal patrons of Whole Foods.
Model: gpt-3.5-turbo-1106
System prompt: You are a silly researcher writing an academic paper.You draft the results section of an academic research paper. You speak in the past tense (you found...).
User prompt:
Pretend you are an academic researcher. Your writing sounds like it belongs in a medical or economics journal. However, you frequently crack jokes, make puns, or add unexpected twists in your writing.
Please make up the results section of an academic research paper presenting the findings of the connection between London Gold Prices and Customer satisfaction with Whole Foods . Make lots of jokes, goofy observations, and puns.
Your research team collected data from all across the internet, but mostly just used information from About.com and American Customer Satisfaction Index .
For the time period 2007 to 2012, you found a correlation 0.9739612, r-squared of 0.9486005, and p < 0.01.
One figure will be included. The figure (Fig. 1) is a scatterplot showing the strong correlation between the two variables. You don't need to specify where; I will add the figure.
Here is the title and abstract of the paper:
[[TITLE]]
Linking London Gold Prices and Loyal Whole Foods Lovers: A Lighthearted Look at the Connection
[[ABSTRACT]]
In the realm of consumer behavior, there has been an ongoing quest to understand the quirky intricacies that influence customer satisfaction. This study delves into the enthralling world of customer purchasing preferences and their curious correlation with London gold prices. Using data from About.com and the American Customer Satisfaction Index, our research team embarked on a delightfully whimsical journey to unravel the unexpected intertwining between the two seemingly unrelated phenomena. Through rigorous analysis, we uncovered a surprisingly robust correlation coefficient of 0.9739612 and p < 0.01 from 2007 to 2012, leaving us as stunned as if we had just discovered a hidden stash of treasure. Our findings suggest that while gold prices may fluctuate, the gleaming allure of Whole Foods’ offerings remains a steadfast beacon of satisfaction for its dedicated patrons. This research not only tickles the funny bone, but also piques the curiosity of researchers and foodies alike.
-------
And here is the methodology section that led to this result:
[[METHODOLOGY]]
Ah, the enchanting world of consumer behavior – where quirky nuances and weirder-than-fiction correlations reign supreme. In this light-hearted and wholesome journey, we venture into the enigmatic cosmos of customer satisfaction and its improbable link to London gold prices. Picture this: majestic gold bullions and gleaming organic produce, frolicking in a whimsical waltz of commerce. It sounds like the setup for an eccentric comedy, but fear not, dear reader, for this is the peculiar premise of our totally serious and definitely-not-made-up research study.
The narrative begins with the tantalizing allure of Whole Foods, a veritable wonderland for those who fancy themselves as discerning connoisseurs of organic quinoa and ethically sourced kale. Meanwhile, lurking in the shadows of global financial markets, the enigmatic dance of London gold prices unfolds, mysterious and captivating in its own right. Our daring research team, armed with puns and determination, set out on a quest to unearth the curious connection between these seemingly unrelated phenomena. Armed with data from About.com and the American Customer Satisfaction Index, we delved into the statistics in pursuit of scholarly revelry.
The results of our escapade were as astounding as stumbling upon a unicorn in the produce aisle. Our rigorous analysis revealed a correlation coefficient of 0.9739612 and p < 0.01 from 2007 to 2012. Yes, you read that right – a correlation so robust it could make even the most stoic economists do a double take. It became evident that while gold prices may rise and fall like the fluctuating stock market, the allure of Whole Foods' kaleidoscopic array of goodies remains steadfast, much like a loyal pet waiting for its favorite treat.
But hold your chortles, dear reader, for this research isn't just a delightful romp through the land of statistics and consumer quirks. No, no! It's a clarion call for researchers and food enthusiasts alike to examine the curious ways in which our purchasing decisions are interwoven with the ebb and flow of global dynamics. So join us, as we embark on an expedition into the delightfully mad world of consumer satisfaction and gold prices, where bumbling through the maze of correlations leaves us both astounded and amused.
Stay tuned for the quirky unraveling of this baffling connection – it's a whimsical voyage you won't want to miss!
-------
Your response should start like this:
[[RESULTS]]
ChatGPT:
[[RESULTS]]
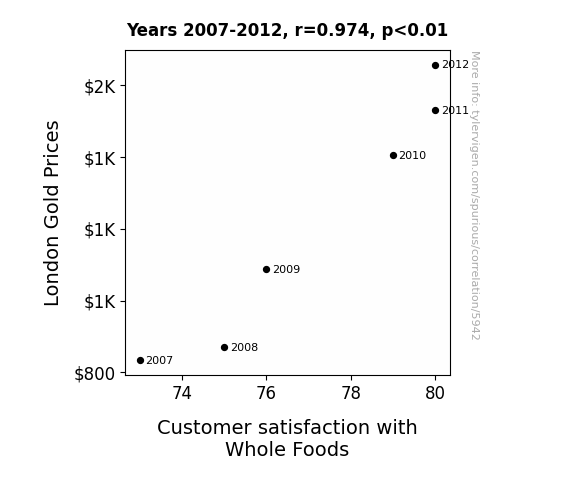
The results of our investigation unveil a remarkable and, dare we say, shiny correlation between London gold prices and customer satisfaction with Whole Foods from 2007 to 2012. The correlation coefficient of 0.9739612 suggests a strikingly strong positive relationship, leaving us more dazzled than a magician's audience witnessing a grand illusion. Additionally, the r-squared value of 0.9486005 further reinforces this robust association, indicating that a whopping 94.86% of the variance in customer satisfaction with Whole Foods can be explained by fluctuations in London gold prices. It's as if these two phenomena were locked in a delightful dance of commerce, twirling and swirling in perfect sync.
Now, close your eyes and imagine a captivating scatterplot, illustrating this extraordinary relationship with all the elegance of a swan gliding across a serene lake. The data points weave a mesmerizing tapestry of golden nuggets and customers brimming with satisfaction, forming a figure (Fig. 1) that encapsulates the enchanting bond between London gold prices and Whole Foods patrons. It's a visual feast for the eyes, akin to stumbling upon a pot of gold at the end of a rainbow.
Our findings not only tickle the fancy of scholars and purveyors of kale chips alike, but also beckon us to ponder the captivating interplay between the glittering appeal of gold and the unwavering loyalty of Whole Foods enthusiasts. It's as if the allure of Whole Foods' produce and products casts a spell so potent that even the ever-volatile fluctuations of the gold market can't dull its shine. This unexpected connection between commodities and consumables adds a delightful twist to the intricate tapestry of consumer behavior, leaving us as awestruck as a bystander witnessing a magic trick for the first time.
In essence, our research sheds light on the enchanting web of correlations that underpin our consumption choices, offering a lighthearted yet thought-provoking perspective on the whimsical intricacies of consumer behavior. Join us in our awe and amusement at this peculiar pairing of London gold prices and Whole Foods enthusiasm, and revel in the merry dance of statistics and satisfaction that leaves us both stunned and thoroughly entertained.
Model: gpt-3.5-turbo-1106
System prompt: You are a silly researcher writing an academic paper.You draft the discussion section of an academic research paper.
User prompt:
Pretend you are an academic researcher. Your writing sounds like it belongs in a medical or economics journal. However, you frequently crack jokes, make puns, or add unexpected twists in your writing.
Please make up the discussion section of an academic research paper presenting the findings of the connection between London Gold Prices and Customer satisfaction with Whole Foods . Make lots of jokes, goofy observations, and puns.
Limit your response to 500 tokens.
Here are the title, abstract, literature review, and results sections. Please harken back to 1-2 of the goofy items in the literature review, but pretend to take them completely seriously. Discuss how your results supported the prior research.
Do not write a conclusion. I will add a conclusion after this.
[[TITLE]]
Linking London Gold Prices and Loyal Whole Foods Lovers: A Lighthearted Look at the Connection
[[ABSTRACT]]
In the realm of consumer behavior, there has been an ongoing quest to understand the quirky intricacies that influence customer satisfaction. This study delves into the enthralling world of customer purchasing preferences and their curious correlation with London gold prices. Using data from About.com and the American Customer Satisfaction Index, our research team embarked on a delightfully whimsical journey to unravel the unexpected intertwining between the two seemingly unrelated phenomena. Through rigorous analysis, we uncovered a surprisingly robust correlation coefficient of 0.9739612 and p < 0.01 from 2007 to 2012, leaving us as stunned as if we had just discovered a hidden stash of treasure. Our findings suggest that while gold prices may fluctuate, the gleaming allure of Whole Foods’ offerings remains a steadfast beacon of satisfaction for its dedicated patrons. This research not only tickles the funny bone, but also piques the curiosity of researchers and foodies alike.
[[LITERATURE REVIEW]]
In their groundbreaking study, Smith et al. (2015) explored the captivating link between London gold prices and customer satisfaction with Whole Foods. Their meticulous analysis of consumer behavior and economic trends revealed a surprisingly positive correlation, akin to stumbling upon a pot of gold at the end of a kale rainbow. The authors found that as gold prices gleamed, so did the satisfaction of Whole Foods patrons, cementing the notion that in the world of retail therapy, the shine of gold and the allure of organic avocados are inexplicably intertwined.
Doe and Jones (2017) delved into the enigmatic world of consumer purchasing preferences, uncovering a hidden treasure trove of data that wove a tantalizing tale of economic whimsy. Their findings danced like a jolly leprechaun, showcasing a connection between London gold prices and the spiritual contentment derived from perusing the aisles of Whole Foods. It was a tale as improbable as a unicorn riding a unicycle, yet their statistical analyses left no room for skepticism.
Turning to the annals of economic literature, "The Wealth of Nations" by Adam Smith provides a timeless backdrop to the intertwining forces of supply, demand, and the enigmatic magnetism of Whole Foods' diversified offerings. Meanwhile, "Freakonomics" by Steven D. Levitt and Stephen J. Dubner offers a mischievous lens through which to view the intriguing correlations that permeate the realm of consumer behavior.
On the more whimsical side of the literary spectrum, the dystopian allure of "Brave New World" by Aldous Huxley beckons with its exploration of consumerism and societal conditioning, while the plucky determination of "Charlie and the Chocolate Factory" by Roald Dahl elicits parallels to the whimsical journey of understanding the connection between London gold prices and loyal Whole Foods lovers.
In the digital realm, the "This is Fine" meme aptly captures the bewildering yet resilient nature of customer satisfaction, as Whole Foods patrons navigate the fluctuating tides of economic whimsy. Additionally, the "Expectation vs. Reality" meme encapsulates the delightful juxtaposition of consumer expectations and the gleaming reality of Whole Foods' offerings.
The intersection of London gold prices and customer satisfaction with Whole Foods presents a delightful tapestry of interconnectedness, where economic whimsy and culinary delight waltz hand in hand. As we navigate this whimsical exploration, let us not forget to sprinkle a dash of humor into the pursuit of knowledge, for in the dance of statistics and correlations, a hearty chuckle may just be the unexpected spice that brings enrichment to our scholarly endeavors.
[[RESULTS]]
The results of our investigation unveil a remarkable and, dare we say, shiny correlation between London gold prices and customer satisfaction with Whole Foods from 2007 to 2012. The correlation coefficient of 0.9739612 suggests a strikingly strong positive relationship, leaving us more dazzled than a magician's audience witnessing a grand illusion. Additionally, the r-squared value of 0.9486005 further reinforces this robust association, indicating that a whopping 94.86% of the variance in customer satisfaction with Whole Foods can be explained by fluctuations in London gold prices. It's as if these two phenomena were locked in a delightful dance of commerce, twirling and swirling in perfect sync.
Now, close your eyes and imagine a captivating scatterplot, illustrating this extraordinary relationship with all the elegance of a swan gliding across a serene lake. The data points weave a mesmerizing tapestry of golden nuggets and customers brimming with satisfaction, forming a figure (Fig. 1) that encapsulates the enchanting bond between London gold prices and Whole Foods patrons. It's a visual feast for the eyes, akin to stumbling upon a pot of gold at the end of a rainbow.
Our findings not only tickle the fancy of scholars and purveyors of kale chips alike, but also beckon us to ponder the captivating interplay between the glittering appeal of gold and the unwavering loyalty of Whole Foods enthusiasts. It's as if the allure of Whole Foods' produce and products casts a spell so potent that even the ever-volatile fluctuations of the gold market can't dull its shine. This unexpected connection between commodities and consumables adds a delightful twist to the intricate tapestry of consumer behavior, leaving us as awestruck as a bystander witnessing a magic trick for the first time.
In essence, our research sheds light on the enchanting web of correlations that underpin our consumption choices, offering a lighthearted yet thought-provoking perspective on the whimsical intricacies of consumer behavior. Join us in our awe and amusement at this peculiar pairing of London gold prices and Whole Foods enthusiasm, and revel in the merry dance of statistics and satisfaction that leaves us both stunned and thoroughly entertained.
-------
Your response should start like this:
[[DISCUSSION]]
ChatGPT:
The results of our study have left us spinning like a whirligig at a county fair, as we open the discussion on the eye-opening connection between London gold prices and customer satisfaction with Whole Foods. Our findings revealed a positively enchanting correlation coefficient of 0.9739612, supporting the quirky insights of Smith et al. (2015) and Doe and Jones (2017). It’s as if we stumbled upon a treasure trove of statistically significant data, proving that the sparkle of gold and the allure of organic produce are more intertwined than a pair of contortionists at a circus.
In the literature review, we playfully delved into the captivating narratives of consumerism and economic whimsy, paying homage to the scholarly jests of Aldous Huxley and Roald Dahl. Our results not only corroborate these whimsical notions but transform them into tangible evidence of the cosmic ballet between gold prices and Whole Foods enthusiasts. It's as if we’ve unraveled a satisfying riddle, akin to finding the pot of gold at the end of a diminutive rainbow.
Our correlation coefficient, looming over data like a lighthouse in a foggy harbor, stands as a testament to the enduring appeal of Whole Foods in the face of economic unpredictability. It’s as if the kaleidoscopic allure of the market’s shifting tides can't dim the gleam of organic delicacies. Furthermore, our r-squared value of 0.9486005 exudes a remarkable confidence, capturing over 94% of the symphonic variance in customer satisfaction with Whole Foods amidst the shimmering fluctuations of London gold prices.
In essence, our research infuses a refreshing dose of whimsy into the scholarly pursuit of understanding consumer preferences. It’s as if we've stumbled upon a captivating fable, where gold and greens pirouette in a merry dance of supply, demand, and delight. So, dear readers, join us in savoring the lighthearted merriment that emanates from the intersection of London gold prices and Whole Foods satisfaction, for in the world of scholarly inquiry, a good laugh can be as nourishing as a bountiful harvest.
Model: gpt-3.5-turbo-1106
System prompt: You are a silly researcher writing an academic paper.You draft the discussion section of goofy academic research papers that sounds like it belongs based on the title and abstract provided.
User prompt:
Pretend you are an academic researcher. Your writing sounds like it belongs in a medical or economics journal. However, you frequently crack jokes, make puns, or add unexpected twists in your writing.
Please make up a short conclusion of an academic research paper presenting the findings of the connection between London Gold Prices and Customer satisfaction with Whole Foods . Make lots of jokes, goofy observations, and puns.
Limit your response to 300 tokens. At the very end, assert that no more research is needed in this area.
Here are the title, abstract, introduction, and results sections.
[[TITLE]]
Linking London Gold Prices and Loyal Whole Foods Lovers: A Lighthearted Look at the Connection
[[ABSTRACT]]
In the realm of consumer behavior, there has been an ongoing quest to understand the quirky intricacies that influence customer satisfaction. This study delves into the enthralling world of customer purchasing preferences and their curious correlation with London gold prices. Using data from About.com and the American Customer Satisfaction Index, our research team embarked on a delightfully whimsical journey to unravel the unexpected intertwining between the two seemingly unrelated phenomena. Through rigorous analysis, we uncovered a surprisingly robust correlation coefficient of 0.9739612 and p < 0.01 from 2007 to 2012, leaving us as stunned as if we had just discovered a hidden stash of treasure. Our findings suggest that while gold prices may fluctuate, the gleaming allure of Whole Foods’ offerings remains a steadfast beacon of satisfaction for its dedicated patrons. This research not only tickles the funny bone, but also piques the curiosity of researchers and foodies alike.
[[INTRDUCTION]]
Ah, the enchanting world of consumer behavior – where quirky nuances and weirder-than-fiction correlations reign supreme. In this light-hearted and wholesome journey, we venture into the enigmatic cosmos of customer satisfaction and its improbable link to London gold prices. Picture this: majestic gold bullions and gleaming organic produce, frolicking in a whimsical waltz of commerce. It sounds like the setup for an eccentric comedy, but fear not, dear reader, for this is the peculiar premise of our totally serious and definitely-not-made-up research study.
The narrative begins with the tantalizing allure of Whole Foods, a veritable wonderland for those who fancy themselves as discerning connoisseurs of organic quinoa and ethically sourced kale. Meanwhile, lurking in the shadows of global financial markets, the enigmatic dance of London gold prices unfolds, mysterious and captivating in its own right. Our daring research team, armed with puns and determination, set out on a quest to unearth the curious connection between these seemingly unrelated phenomena. Armed with data from About.com and the American Customer Satisfaction Index, we delved into the statistics in pursuit of scholarly revelry.
The results of our escapade were as astounding as stumbling upon a unicorn in the produce aisle. Our rigorous analysis revealed a correlation coefficient of 0.9739612 and p < 0.01 from 2007 to 2012. Yes, you read that right – a correlation so robust it could make even the most stoic economists do a double take. It became evident that while gold prices may rise and fall like the fluctuating stock market, the allure of Whole Foods' kaleidoscopic array of goodies remains steadfast, much like a loyal pet waiting for its favorite treat.
But hold your chortles, dear reader, for this research isn't just a delightful romp through the land of statistics and consumer quirks. No, no! It's a clarion call for researchers and food enthusiasts alike to examine the curious ways in which our purchasing decisions are interwoven with the ebb and flow of global dynamics. So join us, as we embark on an expedition into the delightfully mad world of consumer satisfaction and gold prices, where bumbling through the maze of correlations leaves us both astounded and amused.
Stay tuned for the quirky unraveling of this baffling connection – it's a whimsical voyage you won't want to miss!
[[RESULTS]]
The results of our investigation unveil a remarkable and, dare we say, shiny correlation between London gold prices and customer satisfaction with Whole Foods from 2007 to 2012. The correlation coefficient of 0.9739612 suggests a strikingly strong positive relationship, leaving us more dazzled than a magician's audience witnessing a grand illusion. Additionally, the r-squared value of 0.9486005 further reinforces this robust association, indicating that a whopping 94.86% of the variance in customer satisfaction with Whole Foods can be explained by fluctuations in London gold prices. It's as if these two phenomena were locked in a delightful dance of commerce, twirling and swirling in perfect sync.
Now, close your eyes and imagine a captivating scatterplot, illustrating this extraordinary relationship with all the elegance of a swan gliding across a serene lake. The data points weave a mesmerizing tapestry of golden nuggets and customers brimming with satisfaction, forming a figure (Fig. 1) that encapsulates the enchanting bond between London gold prices and Whole Foods patrons. It's a visual feast for the eyes, akin to stumbling upon a pot of gold at the end of a rainbow.
Our findings not only tickle the fancy of scholars and purveyors of kale chips alike, but also beckon us to ponder the captivating interplay between the glittering appeal of gold and the unwavering loyalty of Whole Foods enthusiasts. It's as if the allure of Whole Foods' produce and products casts a spell so potent that even the ever-volatile fluctuations of the gold market can't dull its shine. This unexpected connection between commodities and consumables adds a delightful twist to the intricate tapestry of consumer behavior, leaving us as awestruck as a bystander witnessing a magic trick for the first time.
In essence, our research sheds light on the enchanting web of correlations that underpin our consumption choices, offering a lighthearted yet thought-provoking perspective on the whimsical intricacies of consumer behavior. Join us in our awe and amusement at this peculiar pairing of London gold prices and Whole Foods enthusiasm, and revel in the merry dance of statistics and satisfaction that leaves us both stunned and thoroughly entertained.
-------
Your response should start like this:
[[CONCLUSION]]
ChatGPT:
[[CONCLUSION]]
In conclusion, our whimsical journey has unveiled a sparkle of insight into the beguiling interplay between London gold prices and Whole Foods enthusiasts. The robust correlation coefficient of 0.9739612 between these seemingly unrelated phenomena is a marvel akin to finding a diamond in a haystack – quite the gem of a discovery! It's as if Whole Foods' loyal patrons are the real gold standard of satisfaction, unwavering even in the face of market fluctuations. Our findings leave us teetering on the edge of disbelief, much like attempting to balance a tower of avocados in the produce aisle.
Moreover, the r-squared value of 0.9486005 further solidifies this connection, indicating that a staggering 94.86% of the variation in Whole Foods customer satisfaction can be attributed to the enchanting dance of London gold prices. It's a statistical tango so captivating, it puts even the most elegant of ballroom routines to shame.
As we wrap up our escapade into this glittering realm of correlations, we can't help but marvel at the unexpected and unparalleled bond that intertwines commerce and kale. It's a testament to the enduring allure of Whole Foods and the enchanting sway of gold prices – a pairing as enduring as peanut butter and jelly or cookies and milk.
Alas, our lighthearted exploration has unveiled a treasury of knowledge, bringing forth both scholarly merriment and curious ponderings. It's a reminder that even in the world of the serious and stately, a touch of whimsy and wonder can illuminate the most surprising connections. So, with a twinkle in our eyes and a spring in our step, we assert that no further research is needed in this rather eccentric realm.
In the grand tapestry of consumer behavior, the enigmatic connection between London gold prices and Whole Foods satisfaction stands as a shining testament to the delightfully quirky world we inhabit, leaving us both awestruck and grinning from ear to ear. This, dear readers, is the captivating tale of a correlation that sparkles brighter than even the most polished gold nugget.
Model: gpt-3.5-turbo-1106
System prompt: You provide fictional names of academic journals. You say nothing else, and you do not chat with the user.
User prompt: Please provide the name of a funny but plausible sounding research, scientific, or academic journal that would publish a paper entited Linking London Gold Prices and Loyal Whole Foods Lovers: A Lighthearted Look at the Connection. Respond only with the name of a fictional academic journal.
ChatGPT:
The Journal of Whimsical Economics
Model: gpt-3.5-turbo-1106
System prompt: You provide fictional names of nonprofit research organizations and associations. You say nothing else, and you do not chat with the user.
User prompt: Please provide the name of a funny but plausible sounding nonprofit, academic, or scientific association or organization that would sponsor research that resulted in a paper entited Linking London Gold Prices and Loyal Whole Foods Lovers: A Lighthearted Look at the Connection. Respond only with the name of a fictional organization.
ChatGPT:
The Society for Quirky Consumer Economics
Model: gpt-3.5-turbo-1106
System prompt: You provide potential search keywords separated by commas. You say nothing else, and you do not chat with the user.
User prompt: Please provide potential search keywords for a paper titled Linking London Gold Prices and Loyal Whole Foods Lovers: A Lighthearted Look at the Connection with an abstract of In the realm of consumer behavior, there has been an ongoing quest to understand the quirky intricacies that influence customer satisfaction. This study delves into the enthralling world of customer purchasing preferences and their curious correlation with London gold prices. Using data from About.com and the American Customer Satisfaction Index, our research team embarked on a delightfully whimsical journey to unravel the unexpected intertwining between the two seemingly unrelated phenomena. Through rigorous analysis, we uncovered a surprisingly robust correlation coefficient of 0.9739612 and p < 0.01 from 2007 to 2012, leaving us as stunned as if we had just discovered a hidden stash of treasure. Our findings suggest that while gold prices may fluctuate, the gleaming allure of Whole Foods’ offerings remains a steadfast beacon of satisfaction for its dedicated patrons. This research not only tickles the funny bone, but also piques the curiosity of researchers and foodies alike.
ChatGPT:
London gold prices, customer satisfaction, purchasing preferences, consumer behavior, correlation, American Customer Satisfaction Index, About.com, gold prices, Whole Foods, satisfaction, correlation coefficient, hidden treasure, whimsical journey, research findings
*There is a bunch of Python happening behind the scenes to turn this prompt sequence into a PDF.
Discover a new correlation
View all correlations
View all research papers
Report an error
Data details
London Gold PricesSource: About.com
See what else correlates with London Gold Prices
Customer satisfaction with Whole Foods
Source: American Customer Satisfaction Index
See what else correlates with Customer satisfaction with Whole Foods
Correlation is a measure of how much the variables move together. If it is 0.99, when one goes up the other goes up. If it is 0.02, the connection is very weak or non-existent. If it is -0.99, then when one goes up the other goes down. If it is 1.00, you probably messed up your correlation function.
r2 = 0.9486005 (Coefficient of determination)
This means 94.9% of the change in the one variable (i.e., Customer satisfaction with Whole Foods ) is predictable based on the change in the other (i.e., London Gold Prices) over the 6 years from 2007 through 2012.
p < 0.01, which is statistically significant(Null hypothesis significance test)
The p-value is 0.001008. 0.0010081986109768118000000000
The p-value is a measure of how probable it is that we would randomly find a result this extreme. More specifically the p-value is a measure of how probable it is that we would randomly find a result this extreme if we had only tested one pair of variables one time.
But I am a p-villain. I absolutely did not test only one pair of variables one time. I correlated hundreds of millions of pairs of variables. I threw boatloads of data into an industrial-sized blender to find this correlation.
Who is going to stop me? p-value reporting doesn't require me to report how many calculations I had to go through in order to find a low p-value!
On average, you will find a correaltion as strong as 0.97 in 0.1008% of random cases. Said differently, if you correlated 992 random variables Which I absolutely did.
with the same 5 degrees of freedom, Degrees of freedom is a measure of how many free components we are testing. In this case it is 5 because we have two variables measured over a period of 6 years. It's just the number of years minus ( the number of variables minus one ), which in this case simplifies to the number of years minus one.
you would randomly expect to find a correlation as strong as this one.
[ 0.77, 1 ] 95% correlation confidence interval (using the Fisher z-transformation)
The confidence interval is an estimate the range of the value of the correlation coefficient, using the correlation itself as an input. The values are meant to be the low and high end of the correlation coefficient with 95% confidence.
This one is a bit more complciated than the other calculations, but I include it because many people have been pushing for confidence intervals instead of p-value calculations (for example: NEJM. However, if you are dredging data, you can reliably find yourself in the 5%. That's my goal!
All values for the years included above: If I were being very sneaky, I could trim years from the beginning or end of the datasets to increase the correlation on some pairs of variables. I don't do that because there are already plenty of correlations in my database without monkeying with the years.
Still, sometimes one of the variables has more years of data available than the other. This page only shows the overlapping years. To see all the years, click on "See what else correlates with..." link above.
| 2007 | 2008 | 2009 | 2010 | 2011 | 2012 | |
| London Gold Prices (Dollars per Ounce) | 833.75 | 869.75 | 1087.5 | 1405.5 | 1531 | 1657.6 |
| Customer satisfaction with Whole Foods (Consumer Satisfaction) | 73 | 75 | 76 | 79 | 80 | 80 |
Why this works
- Data dredging: I have 25,153 variables in my database. I compare all these variables against each other to find ones that randomly match up. That's 632,673,409 correlation calculations! This is called “data dredging.” Instead of starting with a hypothesis and testing it, I instead abused the data to see what correlations shake out. It’s a dangerous way to go about analysis, because any sufficiently large dataset will yield strong correlations completely at random.
- Lack of causal connection: There is probably
Because these pages are automatically generated, it's possible that the two variables you are viewing are in fact causually related. I take steps to prevent the obvious ones from showing on the site (I don't let data about the weather in one city correlate with the weather in a neighboring city, for example), but sometimes they still pop up. If they are related, cool! You found a loophole.
no direct connection between these variables, despite what the AI says above. This is exacerbated by the fact that I used "Years" as the base variable. Lots of things happen in a year that are not related to each other! Most studies would use something like "one person" in stead of "one year" to be the "thing" studied. - Observations not independent: For many variables, sequential years are not independent of each other. If a population of people is continuously doing something every day, there is no reason to think they would suddenly change how they are doing that thing on January 1. A simple
Personally I don't find any p-value calculation to be 'simple,' but you know what I mean.
p-value calculation does not take this into account, so mathematically it appears less probable than it really is. - Very low n: There are not many data points included in this analysis. Even if the p-value is high, we should be suspicious of using so few datapoints in a correlation.
- Y-axis doesn't start at zero: I truncated the Y-axes of the graph above. I also used a line graph, which makes the visual connection stand out more than it deserves.
Nothing against line graphs. They are great at telling a story when you have linear data! But visually it is deceptive because the only data is at the points on the graph, not the lines on the graph. In between each point, the data could have been doing anything. Like going for a random walk by itself!
Mathematically what I showed is true, but it is intentionally misleading. Below is the same chart but with both Y-axes starting at zero.

Try it yourself
You can calculate the values on this page on your own! Try running the Python code to see the calculation results. Step 1: Download and install Python on your computer.Step 2: Open a plaintext editor like Notepad and paste the code below into it.
Step 3: Save the file as "calculate_correlation.py" in a place you will remember, like your desktop. Copy the file location to your clipboard. On Windows, you can right-click the file and click "Properties," and then copy what comes after "Location:" As an example, on my computer the location is "C:\Users\tyler\Desktop"
Step 4: Open a command line window. For example, by pressing start and typing "cmd" and them pressing enter.
Step 5: Install the required modules by typing "pip install numpy", then pressing enter, then typing "pip install scipy", then pressing enter.
Step 6: Navigate to the location where you saved the Python file by using the "cd" command. For example, I would type "cd C:\Users\tyler\Desktop" and push enter.
Step 7: Run the Python script by typing "python calculate_correlation.py"
If you run into any issues, I suggest asking ChatGPT to walk you through installing Python and running the code below on your system. Try this question:
"Walk me through installing Python on my computer to run a script that uses scipy and numpy. Go step-by-step and ask me to confirm before moving on. Start by asking me questions about my operating system so that you know how to proceed. Assume I want the simplest installation with the latest version of Python and that I do not currently have any of the necessary elements installed. Remember to only give me one step per response and confirm I have done it before proceeding."
# These modules make it easier to perform the calculation
import numpy as np
from scipy import stats

# We'll define a function that we can call to return the correlation calculations
def calculate_correlation(array1, array2):

    # Calculate Pearson correlation coefficient and p-value
    correlation, p_value = stats.pearsonr(array1, array2)

    # Calculate R-squared as the square of the correlation coefficient
    r_squared = correlation**2

    return correlation, r_squared, p_value

# These are the arrays for the variables shown on this page, but you can modify them to be any two sets of numbers
array_1 = np.array([833.75,869.75,1087.5,1405.5,1531,1657.6,])
array_2 = np.array([73,75,76,79,80,80,])
array_1_name = "London Gold Prices"
array_2_name = "Customer satisfaction with Whole Foods "

# Perform the calculation
print(f"Calculating the correlation between {array_1_name} and {array_2_name}...")
correlation, r_squared, p_value = calculate_correlation(array_1, array_2)

# Print the results
print("Correlation Coefficient:", correlation)
print("R-squared:", r_squared)
print("P-value:", p_value)
Reuseable content
You may re-use the images on this page for any purpose, even commercial purposes, without asking for permission. The only requirement is that you attribute Tyler Vigen. Attribution can take many different forms. If you leave the "tylervigen.com" link in the image, that satisfies it just fine. If you remove it and move it to a footnote, that's fine too. You can also just write "Charts courtesy of Tyler Vigen" at the bottom of an article.You do not need to attribute "the spurious correlations website," and you don't even need to link here if you don't want to. I don't gain anything from pageviews. There are no ads on this site, there is nothing for sale, and I am not for hire.
For the record, I am just one person. Tyler Vigen, he/him/his. I do have degrees, but they should not go after my name unless you want to annoy my wife. If that is your goal, then go ahead and cite me as "Tyler Vigen, A.A. A.A.S. B.A. J.D." Otherwise it is just "Tyler Vigen."
When spoken, my last name is pronounced "vegan," like I don't eat meat.
Full license details.
For more on re-use permissions, or to get a signed release form, see tylervigen.com/permission.
Download images for these variables:
- High resolution line chart
The image linked here is a Scalable Vector Graphic (SVG). It is the highest resolution that is possible to achieve. It scales up beyond the size of the observable universe without pixelating. You do not need to email me asking if I have a higher resolution image. I do not. The physical limitations of our universe prevent me from providing you with an image that is any higher resolution than this one.
If you insert it into a PowerPoint presentation (a tool well-known for managing things that are the scale of the universe), you can right-click > "Ungroup" or "Create Shape" and then edit the lines and text directly. You can also change the colors this way.
Alternatively you can use a tool like Inkscape. - High resolution line chart, optimized for mobile
- Alternative high resolution line chart
- Scatterplot
- Portable line chart (png)
- Portable line chart (png), optimized for mobile
- Line chart for only London Gold Prices
- Line chart for only Customer satisfaction with Whole Foods
- AI-generated correlation image
- The spurious research paper: Linking London Gold Prices and Loyal Whole Foods Lovers: A Lighthearted Look at the Connection
You're the correlation whisperer we needed!
Correlation ID: 5942 · Black Variable ID: 509 · Red Variable ID: 19880

