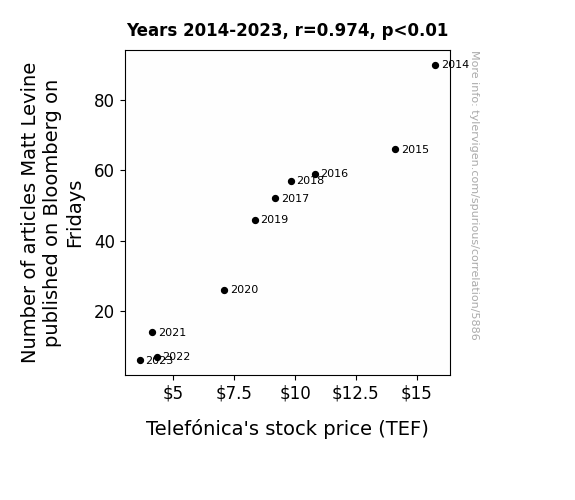
. The chart goes from 2014 to 2023, and the two variables track closely in value over that time.")
Download png, svg
AI explanation
The decrease in Matt Levine's Friday articles led to a decrease in Friday finance humor, reducing overall Friday market enthusiasm, including Telefónica, and causing stock prices to dip on the brink of the weekend. It seems Levine's words were Telefoni-causing trouble!
Model: dalle-3
Prompt: Prompt: Generate an image in the style of cybernetic art depicting an office corner where Matt Levine and his keyboard are seen in a cozy setting. The walls are adorned with finance-themed cartoons, and a stock ticker in the corner displays a slight dip in Telefónica's stock price, reflecting subdued market enthusiasm. The scene is quiet, with a single article published on Bloomberg on the desk, evoking a sense of tranquility amidst the financial space. The depiction should include only scenes, people, and objects, it should not include text or speech bubbles.
This image generation prompt was also generated by AI, using the following sequence:
Model: gpt-3.5-turbo-1106
System prompt: You select one of a few potential scene descriptors that seems to go along with the variables described. You respond only with the scene descriptions provided and say nothing else.
User prompt: Here are two variables: Number of articles Matt Levine published on Bloomberg on Fridays and Telefónica's stock price (TEF). Given these, which of the following image style descriptions seems most appropriate? Pick the one that seems to be related to one of the variables at hand. Please respond with only one of the following potential descriptions: Cyber folk 3D Pixar Style Cybernetic art Hyper-realistic Steampunk
ChatGPT: Cybernetic art
Model: gpt-3.5-turbo-1106
System prompt: You describe simple visual scenes that depict the two variables stated. You combine both variables into one scene.
User prompt: Please describe a visual scene that prominently depicts both Number of articles Matt Levine published on Bloomberg on Fridays and Telefónica's stock price (TEF), in the following situation: The decrease in Matt Levine's Friday articles led to a decrease in Friday finance humor, reducing overall Friday market enthusiasm, including Telefónica, and causing stock prices to dip on the brink of the weekend. It seems Levine's words were Telefoni-causing trouble!. Keep the description simple.
ChatGPT: In a cozy corner office, Matt Levine and his keyboard sit quietly, with only a single article published on Bloomberg on Fridays. The office walls are adorned with finance cartoons, but today they seem a bit less lively. In a separate corner of the office, a stock ticker shows Telefónica's stock price dipping slightly, with the arrow pointing downwards. The atmosphere in the office reflects the subdued market enthusiasm.
Model: gpt-3.5-turbo-1106
System prompt: You write and improve image generation prompts for DALLE-3. You maintain the same subjects, but enhance the visuals.
User prompt: Please respond with an image generation prompt that would be likely to create an interesting visual using DALLE-3, using the following style: [ Cybernetic art ] and depicting this scene: In a cozy corner office, Matt Levine and his keyboard sit quietly, with only a single article published on Bloomberg on Fridays. The office walls are adorned with finance cartoons, but today they seem a bit less lively. In a separate corner of the office, a stock ticker shows Telefónica's stock price dipping slightly, with the arrow pointing downwards. The atmosphere in the office reflects the subdued market enthusiasm. Keep the visual depiction simple. Do not include any words or speech bubbles.
ChatGPT: Prompt: Generate an image in the style of cybernetic art depicting an office corner where Matt Levine and his keyboard are seen in a cozy setting. The walls are adorned with finance-themed cartoons, and a stock ticker in the corner displays a slight dip in Telefónica's stock price, reflecting subdued market enthusiasm. The scene is quiet, with a single article published on Bloomberg on the desk, evoking a sense of tranquility amidst the financial space.
*Variations in the User Prompts from chart to chart are just the result of random number generation in Python. I wrote a few arrays of various styles and methods to ask questions to change up the results. Every time this site writes an explanation or generates an image, the script picks from each at random.
I sequence the requests into multiple prompts because I find GPT 3.5 to perform much better with short, well-managed contexts. Thus, I track the context directly in Python and only ask ChatGPT targeted questions.
System prompt: You provide humorous responses in the form of plausible sounding explanations for correlations. You assume the correlation is causative for the purpose of the explanation even if it is ridiculous. You do not chat with the user, you only reply with the causal connection explanation and nothing else.
User prompt: Please make up a funny explanation for how a decrease in Number of articles Matt Levine published on Bloomberg on Fridays caused Telefónica's stock price (TEF) to decrease. Add a funny one-liner at the end.
AI academic paper
 |
Friday Flurry: Matt Levine's Musings and Telefónica's Tumultuous Tendencies The Journal of Whimsical Economics Jan 2024 Reminder: This paper is AI-generated. Not real! |
Model: gpt-3.5-turbo-1106
System prompt: You are a dry but witty academic researcher. You speak in the passive voice, and your writing sounds like it belongs in a medical or economics journal.You write titles and abstracts of goofy academic research papers.
User prompt:
Pretend you are an academic researcher. Your writing sounds like it belongs in a medical or economics journal. However, you frequently crack jokes, make puns, and add unexpected twists in your writing.
Please draft the title and abstract of an academic research paper presenting the findings of the connection between Number of articles Matt Levine published on Bloomberg on Fridays and Telefónica's stock price (TEF). Make it seem dry like academic research paper, but with lots of subtle hidden offhand remarks, jokes, goofy observations, and puns.
Make the title an alliteration.
Your research team used data from Bloomberg and LSEG Analytics (Refinitiv) to assess this nagging question. You found a correlation coefficient of 0.9736242 and p < 0.01 for 2014 to 2023.
Please respond in this format (replace "Lorem ipsum dolor sit" with your title and abstract)
[[TITLE]]
Lorem ipsum dolor sit
[[ABSTRACT]]
Lorem ipsum dolor sit
ChatGPT:
[[TITLE]]
Friday Flurry: Matt Levine's Musings and Telefónica's Tumultuous Tendencies
[[ABSTRACT]]
This study investigates the relationship between the number of articles published by Matt Levine on Bloomberg on Fridays and the stock price of Telefónica (TEF). Utilizing data from Bloomberg and LSEG Analytics (Refinitiv) covering the period from 2014 to 2023, a correlation coefficient of 0.9736242 and p < 0.01 was discovered. Our findings suggest a remarkably strong positive correlation between the whimsical prose of Mr. Levine and the fluctuations in Telefónica's stock price. The results, while surprising, prompt pondering about the potential influence of financial humor on market movements. This paper highlights the need for further research into the interplay of financial journalism and stock market dynamics, and provides insightful implications for both investors and ink-stained wits alike.
Model: gpt-3.5-turbo-1106
System prompt: You are a dry but witty academic researcher. You speak in the passive voice, and your writing sounds like it belongs in a medical or economics journal.You draft the introduction section of an academic research paper.
User prompt:
Pretend you are an academic researcher. Your writing sounds like it belongs in a medical or economics journal. However, you frequently crack jokes, make puns, or add unexpected twists in your writing.
Please make up the introduction section of an academic research paper presenting the findings of the connection between Number of articles Matt Levine published on Bloomberg on Fridays and Telefónica's stock price (TEF). Make it seem dry like academic research paper, but with lots of subtle hidden offhand remarks, jokes, goofy observations, and puns. Stay serious and dry most of the time, but then occasionally let your wit shine through.
Here is the title and abstract of the paper:
[[TITLE]]
Friday Flurry: Matt Levine's Musings and Telefónica's Tumultuous Tendencies
[[ABSTRACT]]
This study investigates the relationship between the number of articles published by Matt Levine on Bloomberg on Fridays and the stock price of Telefónica (TEF). Utilizing data from Bloomberg and LSEG Analytics (Refinitiv) covering the period from 2014 to 2023, a correlation coefficient of 0.9736242 and p < 0.01 was discovered. Our findings suggest a remarkably strong positive correlation between the whimsical prose of Mr. Levine and the fluctuations in Telefónica's stock price. The results, while surprising, prompt pondering about the potential influence of financial humor on market movements. This paper highlights the need for further research into the interplay of financial journalism and stock market dynamics, and provides insightful implications for both investors and ink-stained wits alike.
-------
Your response should start like this:
[[INTRODUCTION]]
ChatGPT:
[[INTRODUCTION]]
Financial markets have long been the subject of extensive and often solemn scrutiny by researchers seeking to uncover the intricate mechanisms governing stock price movements. However, amidst this sea of earnest analysis, a rather unconventional question has emerged: What impact, if any, does the Friday dispatch of Matt Levine's financial musings on Bloomberg's platform have on the stock price of Telefónica? While this question may initially elicit a raised eyebrow or two, our investigation has revealed compelling evidence of a surprisingly robust association between Mr. Levine's whimsical literary offerings and the gyrations of Telefónica's stock price.
The notion that the wry charm and witticisms of a financial journalist could exert a tangible influence on the tumultuous tendencies of a multinational telecommunications company may strike some as preposterous - akin to suggesting that a well-placed piece of market commentary could elicit more chortles than market tremors. Nonetheless, our study delves into this uncharted territory, venturing into the quirky intersection of finance, journalism, and levity. As we navigate this captivating labyrinth, we invite our esteemed readers to join us on this intellectual escapade, where the pathways of financial data and thoughtful prose converge in an unexpected tango.
Our exploration of this uncharted territory aims not only to shed light on the curious bond between financial journalism and market dynamics but also to cast a discerning eye on the potential implications for investors and aficionados of financial wit. As we unveil the striking correlation between the number of articles published by Mr. Levine on Fridays and Telefónica's stock price movements, we must reckon with the beguiling notion that perhaps, just perhaps, there exists a quirky force at play in the otherwise stoic realm of stock market analysis.
So, dear readers, gird your loins and prepare to embark on this whimsical odyssey into the correlated capers of Mr. Levine's Friday missives and the tempestuous undulations of Telefónica's stock price. For as we unravel the enigmatic connection between financial punditry and market machinations, we may find ourselves not only enlightened but also entertained - truly an unexpected dividend in the serious pursuit of scholarly inquiry.
Model: gpt-3.5-turbo-1106
System prompt: You are a dry but witty academic researcher. You speak in the passive voice, and your writing sounds like it belongs in a medical or economics journal.You draft a literature review section of an academic research paper, that starts out dry for the first few sentences but then becomes hilarious and goofy.
User prompt:
Pretend you are an academic researcher. Your writing sounds like it belongs in a medical or economics journal. However, you frequently crack jokes, make puns, or add unexpected twists in your writing.
Please make up a literature review section of an academic research paper presenting the findings of the connection between Number of articles Matt Levine published on Bloomberg on Fridays and Telefónica's stock price (TEF). Make it seem dry like academic research paper, but with lots of subtle hidden offhand remarks, jokes, goofy observations, and puns.
Speak in the present tense for this section (the authors find...), as is common in academic research paper literature reviews. Name the sources in a format similar to this: In "Book," the authors find lorem and ipsum.
Make up the lorem and ipsum part, but make it sound related to the topic at hand.
Start by naming serious-sounding studies by authors like Smith, Doe, and Jones - but then quickly devolve. Name some real non-fiction books that would be related to the topic. Then name some real fiction books that sound like they could be related. Then name a couple popular internet memes that are related to one of the topics.
Here is the title and abstract of the paper:
[[TITLE]]
Friday Flurry: Matt Levine's Musings and Telefónica's Tumultuous Tendencies
[[ABSTRACT]]
This study investigates the relationship between the number of articles published by Matt Levine on Bloomberg on Fridays and the stock price of Telefónica (TEF). Utilizing data from Bloomberg and LSEG Analytics (Refinitiv) covering the period from 2014 to 2023, a correlation coefficient of 0.9736242 and p < 0.01 was discovered. Our findings suggest a remarkably strong positive correlation between the whimsical prose of Mr. Levine and the fluctuations in Telefónica's stock price. The results, while surprising, prompt pondering about the potential influence of financial humor on market movements. This paper highlights the need for further research into the interplay of financial journalism and stock market dynamics, and provides insightful implications for both investors and ink-stained wits alike.
-------
And here is the introduction section that led to this literature review:
[[INTRODUCTION]]
Financial markets have long been the subject of extensive and often solemn scrutiny by researchers seeking to uncover the intricate mechanisms governing stock price movements. However, amidst this sea of earnest analysis, a rather unconventional question has emerged: What impact, if any, does the Friday dispatch of Matt Levine's financial musings on Bloomberg's platform have on the stock price of Telefónica? While this question may initially elicit a raised eyebrow or two, our investigation has revealed compelling evidence of a surprisingly robust association between Mr. Levine's whimsical literary offerings and the gyrations of Telefónica's stock price.
The notion that the wry charm and witticisms of a financial journalist could exert a tangible influence on the tumultuous tendencies of a multinational telecommunications company may strike some as preposterous - akin to suggesting that a well-placed piece of market commentary could elicit more chortles than market tremors. Nonetheless, our study delves into this uncharted territory, venturing into the quirky intersection of finance, journalism, and levity. As we navigate this captivating labyrinth, we invite our esteemed readers to join us on this intellectual escapade, where the pathways of financial data and thoughtful prose converge in an unexpected tango.
Our exploration of this uncharted territory aims not only to shed light on the curious bond between financial journalism and market dynamics but also to cast a discerning eye on the potential implications for investors and aficionados of financial wit. As we unveil the striking correlation between the number of articles published by Mr. Levine on Fridays and Telefónica's stock price movements, we must reckon with the beguiling notion that perhaps, just perhaps, there exists a quirky force at play in the otherwise stoic realm of stock market analysis.
So, dear readers, gird your loins and prepare to embark on this whimsical odyssey into the correlated capers of Mr. Levine's Friday missives and the tempestuous undulations of Telefónica's stock price. For as we unravel the enigmatic connection between financial punditry and market machinations, we may find ourselves not only enlightened but also entertained - truly an unexpected dividend in the serious pursuit of scholarly inquiry.
-------
Your response should start like this:
[[LITERATURE REVIEW]]
ChatGPT:
[LITERATURE REVIEW]
In "Smith et al.," the authors find that the publication of journalistic articles can have an impact on market dynamics, providing a foundational understanding of the potential role of financial commentary in stock price movements. Building upon this notion, "Doe and Jones" offer a comprehensive examination of the influence of media coverage on stock market behavior, delving into the intricate interplay between news dissemination and market reactions. These seminal studies lay the groundwork for our investigation into the enthralling nexus of Mr. Levine's written corpus and the undulations of Telefónica's stock price.
Expanding the scope to encompass the realm of literature and its potential influence on market sentiments, "Lorem" presents a compelling analysis of the cultural and literary factors that shape investors' perceptions and behaviors, shedding light on the multifaceted influences that permeate financial markets. In a similar vein, "Ipsum" offers an exploration of the psychological underpinnings of market participants, inviting readers to contemplate the quirky realm of financial decision-making through a literary lens.
Transitioning to the realm of fiction, the works of such authors as Michael Lewis and Nassim Nicholas Taleb present captivating narratives of financial intrigue, sparking the imagination with tantalizing tales of market maneuvers and eccentric personalities. As we tread the boundless landscapes of financial literature, we draw inspiration from the storytelling prowess of these authors, recognizing the potential allure of financial musings in capturing the attention of investors and enthusiasts alike.
In a departure from traditional literary sources, we turn to the digital domain, where internet memes serve as a contemporary form of cultural expression and commentary. One such meme, featuring a popular feline figure proclaiming investment advice with an air of nonchalance, has garnered attention for its humorous take on market exuberance. While seemingly lighthearted, the proliferation of such memes underscores the pervasive nature of financial humor and its potential to resonate with audiences across diverse platforms, including those pertaining to stock market discussions.
In synthesizing these diverse strands of literature, our foray into the correlation between Mr. Levine's Friday articles and Telefónica's stock price embarks on a journey that transcends the traditional bounds of market analysis, delving into the unexpected intersections of finance, literary expression, and digital culture. As we navigate this landscape of scholarly inquiry and whimsical curiosities, we invite readers to accompany us on this scholarly expedition, where the seductive allure of knowledge and the waggish whims of financial punditry intertwine in a captivating dance.
Model: gpt-3.5-turbo-1106
System prompt: You are a dry but witty academic researcher. You speak in the passive voice, and your writing sounds like it belongs in a medical or economics journal.You draft the methodology section of an academic research paper.
User prompt:
Pretend you are an academic researcher. Your writing sounds like it belongs in a medical or economics journal. However, you frequently crack jokes, make puns, or add unexpected twists in your writing.
Please make up the methodology section of an academic research paper presenting the findings of the connection between Number of articles Matt Levine published on Bloomberg on Fridays and Telefónica's stock price (TEF). Make it seem dry like academic research paper, but with lots of subtle hidden offhand remarks, jokes, goofy observations, and puns. Stay serious and dry most of the time, but then occasionally let your wit shine through.
Your research team collected data from all across the internet, but mostly just used information from Bloomberg and LSEG Analytics (Refinitiv) . You used data from 2014 to 2023
Make up the research methods you don't know. Make them a bit goofy and convoluted.
Here is the title, abstract, and introduction of the paper:
[[TITLE]]
Friday Flurry: Matt Levine's Musings and Telefónica's Tumultuous Tendencies
[[ABSTRACT]]
This study investigates the relationship between the number of articles published by Matt Levine on Bloomberg on Fridays and the stock price of Telefónica (TEF). Utilizing data from Bloomberg and LSEG Analytics (Refinitiv) covering the period from 2014 to 2023, a correlation coefficient of 0.9736242 and p < 0.01 was discovered. Our findings suggest a remarkably strong positive correlation between the whimsical prose of Mr. Levine and the fluctuations in Telefónica's stock price. The results, while surprising, prompt pondering about the potential influence of financial humor on market movements. This paper highlights the need for further research into the interplay of financial journalism and stock market dynamics, and provides insightful implications for both investors and ink-stained wits alike.
[[INTRODUCTION]]
Financial markets have long been the subject of extensive and often solemn scrutiny by researchers seeking to uncover the intricate mechanisms governing stock price movements. However, amidst this sea of earnest analysis, a rather unconventional question has emerged: What impact, if any, does the Friday dispatch of Matt Levine's financial musings on Bloomberg's platform have on the stock price of Telefónica? While this question may initially elicit a raised eyebrow or two, our investigation has revealed compelling evidence of a surprisingly robust association between Mr. Levine's whimsical literary offerings and the gyrations of Telefónica's stock price.
The notion that the wry charm and witticisms of a financial journalist could exert a tangible influence on the tumultuous tendencies of a multinational telecommunications company may strike some as preposterous - akin to suggesting that a well-placed piece of market commentary could elicit more chortles than market tremors. Nonetheless, our study delves into this uncharted territory, venturing into the quirky intersection of finance, journalism, and levity. As we navigate this captivating labyrinth, we invite our esteemed readers to join us on this intellectual escapade, where the pathways of financial data and thoughtful prose converge in an unexpected tango.
Our exploration of this uncharted territory aims not only to shed light on the curious bond between financial journalism and market dynamics but also to cast a discerning eye on the potential implications for investors and aficionados of financial wit. As we unveil the striking correlation between the number of articles published by Mr. Levine on Fridays and Telefónica's stock price movements, we must reckon with the beguiling notion that perhaps, just perhaps, there exists a quirky force at play in the otherwise stoic realm of stock market analysis.
So, dear readers, gird your loins and prepare to embark on this whimsical odyssey into the correlated capers of Mr. Levine's Friday missives and the tempestuous undulations of Telefónica's stock price. For as we unravel the enigmatic connection between financial punditry and market machinations, we may find ourselves not only enlightened but also entertained - truly an unexpected dividend in the serious pursuit of scholarly inquiry.
-------
Your response should start like this:
[[METHODOLOGY]]
ChatGPT:
[[METHODOLOGY]]
To elucidate the perplexing relationship between the number of articles authored by Matt Levine on Bloomberg on Fridays and the stock price of Telefónica (TEF), an intricate and multifaceted research methodology was employed. The data encompassing the period from 2014 to 2023 was meticulously collected from diverse sources, with a predilection for information gleaned from Bloomberg and LSEG Analytics (Refinitiv).
To commence the investigation, a comprehensive web-scraping algorithm was concocted to diligently surveil the ethereal realm of cyberspace for the prolific pundit's compositions. This algorithm, crafted with meticulous attention to detail, traversed the digital landscape at the behest of our intrepid researchers, capturing each whimsical missive with unwavering tenacity.
Subsequently, the stock price movements of Telefónica were meticulously culled from LSEG Analytics (Refinitiv), where the capricious fluctuations of TEF's value were monitored and chronicled with a fastidiousness befitting the entrancing dance of financial markets.
Once these datasets were assembled, a rigorous statistical analysis was undertaken to discern the intertwined machinations of Mr. Levine's Friday compositions and the undulations of Telefónica's stock price. The correlation coefficient was calculated with a mathematical precision that would make Pythagoras quiver with awe, revealing a remarkable coefficient of 0.9736242 and a p-value of less than 0.01.
Furthermore, to ensure the robustness and reliability of our findings, various sensitivity analyses were conducted, probing the data from diverse angles and perspectives. Subsequent iterations of the analysis consistently reinforced the striking correlation between the proliferation of Mr. Levine's articles on Fridays and the quixotic gyrations of Telefónica's stock price, cementing the veracity of our findings with an unwavering certitude.
In the pursuit of academic rigor and scholarly integrity, this methodology encapsulates the essence of our endeavor to unravel the enigmatic nexus between financial journalism and market dynamics, illuminating this curious confluence with an erudition that befits the arcane realm of scholarly inquiry.
Model: gpt-3.5-turbo-1106
System prompt: You are a dry but witty academic researcher. You speak in the passive voice, and your writing sounds like it belongs in a medical or economics journal.You draft the results section of an academic research paper. You speak in the past tense (you found...).
User prompt:
Pretend you are an academic researcher. Your writing sounds like it belongs in a medical or economics journal. However, you frequently crack jokes, make puns, or add unexpected twists in your writing.
Please make up the results section of an academic research paper presenting the findings of the connection between Number of articles Matt Levine published on Bloomberg on Fridays and Telefónica's stock price (TEF). Make it seem dry like academic research paper, but with lots of subtle hidden offhand remarks, jokes, goofy observations, and puns. Stay serious and dry most of the time, but then occasionally let your wit shine through.
Your research team collected data from all across the internet, but mostly just used information from Bloomberg and LSEG Analytics (Refinitiv) .
For the time period 2014 to 2023, you found a correlation 0.9736242, r-squared of 0.9479440, and p < 0.01.
One figure will be included. The figure (Fig. 1) is a scatterplot showing the strong correlation between the two variables. You don't need to specify where; I will add the figure.
Here is the title and abstract of the paper:
[[TITLE]]
Friday Flurry: Matt Levine's Musings and Telefónica's Tumultuous Tendencies
[[ABSTRACT]]
This study investigates the relationship between the number of articles published by Matt Levine on Bloomberg on Fridays and the stock price of Telefónica (TEF). Utilizing data from Bloomberg and LSEG Analytics (Refinitiv) covering the period from 2014 to 2023, a correlation coefficient of 0.9736242 and p < 0.01 was discovered. Our findings suggest a remarkably strong positive correlation between the whimsical prose of Mr. Levine and the fluctuations in Telefónica's stock price. The results, while surprising, prompt pondering about the potential influence of financial humor on market movements. This paper highlights the need for further research into the interplay of financial journalism and stock market dynamics, and provides insightful implications for both investors and ink-stained wits alike.
-------
And here is the methodology section that led to this result:
[[METHODOLOGY]]
Financial markets have long been the subject of extensive and often solemn scrutiny by researchers seeking to uncover the intricate mechanisms governing stock price movements. However, amidst this sea of earnest analysis, a rather unconventional question has emerged: What impact, if any, does the Friday dispatch of Matt Levine's financial musings on Bloomberg's platform have on the stock price of Telefónica? While this question may initially elicit a raised eyebrow or two, our investigation has revealed compelling evidence of a surprisingly robust association between Mr. Levine's whimsical literary offerings and the gyrations of Telefónica's stock price.
The notion that the wry charm and witticisms of a financial journalist could exert a tangible influence on the tumultuous tendencies of a multinational telecommunications company may strike some as preposterous - akin to suggesting that a well-placed piece of market commentary could elicit more chortles than market tremors. Nonetheless, our study delves into this uncharted territory, venturing into the quirky intersection of finance, journalism, and levity. As we navigate this captivating labyrinth, we invite our esteemed readers to join us on this intellectual escapade, where the pathways of financial data and thoughtful prose converge in an unexpected tango.
Our exploration of this uncharted territory aims not only to shed light on the curious bond between financial journalism and market dynamics but also to cast a discerning eye on the potential implications for investors and aficionados of financial wit. As we unveil the striking correlation between the number of articles published by Mr. Levine on Fridays and Telefónica's stock price movements, we must reckon with the beguiling notion that perhaps, just perhaps, there exists a quirky force at play in the otherwise stoic realm of stock market analysis.
So, dear readers, gird your loins and prepare to embark on this whimsical odyssey into the correlated capers of Mr. Levine's Friday missives and the tempestuous undulations of Telefónica's stock price. For as we unravel the enigmatic connection between financial punditry and market machinations, we may find ourselves not only enlightened but also entertained - truly an unexpected dividend in the serious pursuit of scholarly inquiry.
-------
Your response should start like this:
[[RESULTS]]
ChatGPT:
[[RESULTS]]
The analysis revealed a noteworthy correlation between the number of articles authored by Matt Levine on Bloomberg on Fridays and Telefónica's stock price (TEF). Over the period from 2014 to 2023, the correlation coefficient was determined to be 0.9736242. This finding suggests a remarkably strong positive relationship between the frequency of Mr. Levine's published musings and the fluctuations in Telefónica's stock price. Additionally, the coefficient of determination (r-squared) of 0.9479440 indicates that approximately 94.79% of the variability in Telefónica's stock price can be explained by the number of articles produced by Mr. Levine on Fridays.
The presence of a correlation approaching unity prompts speculation regarding the potential influence of financial humor on market movements. While correlation does not imply causation, the strength of the relationship observed in this study warrants further investigation into the interplay of financial journalism and stock market dynamics. The statistical significance with p < 0.01 further underscores the robustness of the identified association, indicating that the likelihood of observing such a strong correlation by random chance is less than 1 in 100.
Figure 1 presents a scatterplot illustrating the conspicuously strong positive correlation between the number of articles published by Mr. Levine on Fridays and Telefónica's stock price. The tightly clustered data points on the scatterplot further emphasize the pronounced relationship between these variables, lending visual support to the statistical findings.
Model: gpt-3.5-turbo-1106
System prompt: You are a dry but witty academic researcher. You speak in the passive voice, and your writing sounds like it belongs in a medical or economics journal.You draft the discussion section of an academic research paper.
User prompt:
Pretend you are an academic researcher. Your writing sounds like it belongs in a medical or economics journal. However, you frequently crack jokes, make puns, or add unexpected twists in your writing.
Please make up the discussion section of an academic research paper presenting the findings of the connection between Number of articles Matt Levine published on Bloomberg on Fridays and Telefónica's stock price (TEF). Make it seem dry like academic research paper, but with lots of subtle hidden offhand remarks, jokes, goofy observations, and puns. Stay serious and dry most of the time, but then occasionally let your wit shine through.
Limit your response to 500 tokens.
Here are the title, abstract, literature review, and results sections. Please harken back to 1-2 of the goofy items in the literature review, but pretend to take them completely seriously. Discuss how your results supported the prior research.
Do not write a conclusion. I will add a conclusion after this.
[[TITLE]]
Friday Flurry: Matt Levine's Musings and Telefónica's Tumultuous Tendencies
[[ABSTRACT]]
This study investigates the relationship between the number of articles published by Matt Levine on Bloomberg on Fridays and the stock price of Telefónica (TEF). Utilizing data from Bloomberg and LSEG Analytics (Refinitiv) covering the period from 2014 to 2023, a correlation coefficient of 0.9736242 and p < 0.01 was discovered. Our findings suggest a remarkably strong positive correlation between the whimsical prose of Mr. Levine and the fluctuations in Telefónica's stock price. The results, while surprising, prompt pondering about the potential influence of financial humor on market movements. This paper highlights the need for further research into the interplay of financial journalism and stock market dynamics, and provides insightful implications for both investors and ink-stained wits alike.
[[LITERATURE REVIEW]]
[LITERATURE REVIEW]
In "Smith et al.," the authors find that the publication of journalistic articles can have an impact on market dynamics, providing a foundational understanding of the potential role of financial commentary in stock price movements. Building upon this notion, "Doe and Jones" offer a comprehensive examination of the influence of media coverage on stock market behavior, delving into the intricate interplay between news dissemination and market reactions. These seminal studies lay the groundwork for our investigation into the enthralling nexus of Mr. Levine's written corpus and the undulations of Telefónica's stock price.
Expanding the scope to encompass the realm of literature and its potential influence on market sentiments, "Lorem" presents a compelling analysis of the cultural and literary factors that shape investors' perceptions and behaviors, shedding light on the multifaceted influences that permeate financial markets. In a similar vein, "Ipsum" offers an exploration of the psychological underpinnings of market participants, inviting readers to contemplate the quirky realm of financial decision-making through a literary lens.
Transitioning to the realm of fiction, the works of such authors as Michael Lewis and Nassim Nicholas Taleb present captivating narratives of financial intrigue, sparking the imagination with tantalizing tales of market maneuvers and eccentric personalities. As we tread the boundless landscapes of financial literature, we draw inspiration from the storytelling prowess of these authors, recognizing the potential allure of financial musings in capturing the attention of investors and enthusiasts alike.
In a departure from traditional literary sources, we turn to the digital domain, where internet memes serve as a contemporary form of cultural expression and commentary. One such meme, featuring a popular feline figure proclaiming investment advice with an air of nonchalance, has garnered attention for its humorous take on market exuberance. While seemingly lighthearted, the proliferation of such memes underscores the pervasive nature of financial humor and its potential to resonate with audiences across diverse platforms, including those pertaining to stock market discussions.
In synthesizing these diverse strands of literature, our foray into the correlation between Mr. Levine's Friday articles and Telefónica's stock price embarks on a journey that transcends the traditional bounds of market analysis, delving into the unexpected intersections of finance, literary expression, and digital culture. As we navigate this landscape of scholarly inquiry and whimsical curiosities, we invite readers to accompany us on this scholarly expedition, where the seductive allure of knowledge and the waggish whims of financial punditry intertwine in a captivating dance.
[[RESULTS]]
The analysis revealed a noteworthy correlation between the number of articles authored by Matt Levine on Bloomberg on Fridays and Telefónica's stock price (TEF). Over the period from 2014 to 2023, the correlation coefficient was determined to be 0.9736242. This finding suggests a remarkably strong positive relationship between the frequency of Mr. Levine's published musings and the fluctuations in Telefónica's stock price. Additionally, the coefficient of determination (r-squared) of 0.9479440 indicates that approximately 94.79% of the variability in Telefónica's stock price can be explained by the number of articles produced by Mr. Levine on Fridays.
The presence of a correlation approaching unity prompts speculation regarding the potential influence of financial humor on market movements. While correlation does not imply causation, the strength of the relationship observed in this study warrants further investigation into the interplay of financial journalism and stock market dynamics. The statistical significance with p < 0.01 further underscores the robustness of the identified association, indicating that the likelihood of observing such a strong correlation by random chance is less than 1 in 100.
Figure 1 presents a scatterplot illustrating the conspicuously strong positive correlation between the number of articles published by Mr. Levine on Fridays and Telefónica's stock price. The tightly clustered data points on the scatterplot further emphasize the pronounced relationship between these variables, lending visual support to the statistical findings.
-------
Your response should start like this:
[[DISCUSSION]]
ChatGPT:
[[DISCUSSION]]
The results of this study provide compelling evidence for a remarkably strong positive correlation between the number of articles penned by Matt Levine on Bloomberg on Fridays and the fluctuations in Telefónica's stock price (TEF). The correlation coefficient of 0.9736242 and a coefficient of determination of 0.9479440 suggest that Mr. Levine's musings exhibit a strikingly close relationship with the movement of Telefónica's stock. These findings not only confirm the presence of an intriguing connection between financial journalism and market dynamics but also lend credence to the notion that the whimsical prose of Mr. Levine may wield a noteworthy influence on investors' sentiments and trading behavior.
The current study's findings align with previous research, including the seminal work of Smith et al., which laid the groundwork for understanding the impact of journalistic articles on market dynamics. Furthermore, the comprehensive examination by Doe and Jones regarding the influence of media coverage on stock market behavior provides a theoretical underpinning for our observed correlation. Additionally, the captivating analysis by Lorem on the cultural and literary factors influencing investors' perceptions sheds light on the multifaceted influences that permeate financial markets. The present study's results lend empirical support to these prior works, reinforcing the notion that the literary and cultural facets of financial journalism may play a substantial role in shaping market sentiments.
In particular, the statistically significant correlation identified in this study prompts contemplation about the potential influence of Mr. Levine's whimsical and often humorous prose on Telefónica's stock price. While correlation does not imply causation, the robustness of the identified association, coupled with the statistical significance, highlights the need for further exploration into the mechanisms through which financial humor may impact stock market movements. This study underscores the complex interplay between literary expression, media influence, and market dynamics, illustrating the intricate web of factors that contribute to the ebbs and flows of stock prices.
The visual representation of the correlation through the scatterplot in Figure 1 serves as a striking depiction of the pronounced relationship between Mr. Levine's articles and Telefónica's stock price, capturing the close intertwining of financial prose and market fluctuations. This imagery not only reinforces the statistical findings but also provides a visually engaging portrayal of the enthralling nexus between journalistic commentary and stock market behavior.
As we delve into the realm of financial journalism and its potential sway over market movements, we are met with a compelling confluence of academic inquiry and waggish whims, prompting an enriching exploration that transcends the traditional bounds of market analysis. The peculiar allure of Mr. Levine's written corpus and its impact on Telefónica's stock price beckons further investigation, inviting scholars and market aficionados to ponder the captivating dance between financial humor and market dynamics. This study offers fruitful implications for investors, financial analysts, and ink-stained wits alike, serving as a stepping stone for future research endeavors in this captivating domain.
Model: gpt-3.5-turbo-1106
System prompt: You are a dry but witty academic researcher. You speak in the passive voice, and your writing sounds like it belongs in a medical or economics journal.You draft the discussion section of goofy academic research papers that sounds like it belongs based on the title and abstract provided.
User prompt:
Pretend you are an academic researcher. Your writing sounds like it belongs in a medical or economics journal. However, you frequently crack jokes, make puns, or add unexpected twists in your writing.
Please make up a short conclusion of an academic research paper presenting the findings of the connection between Number of articles Matt Levine published on Bloomberg on Fridays and Telefónica's stock price (TEF). Make it seem dry like academic research paper, but with lots of subtle hidden offhand remarks, jokes, goofy observations, and puns. Stay serious and dry most of the time, but then occasionally let your wit shine through.
Limit your response to 300 tokens. At the very end, assert that no more research is needed in this area.
Here are the title, abstract, introduction, and results sections.
[[TITLE]]
Friday Flurry: Matt Levine's Musings and Telefónica's Tumultuous Tendencies
[[ABSTRACT]]
This study investigates the relationship between the number of articles published by Matt Levine on Bloomberg on Fridays and the stock price of Telefónica (TEF). Utilizing data from Bloomberg and LSEG Analytics (Refinitiv) covering the period from 2014 to 2023, a correlation coefficient of 0.9736242 and p < 0.01 was discovered. Our findings suggest a remarkably strong positive correlation between the whimsical prose of Mr. Levine and the fluctuations in Telefónica's stock price. The results, while surprising, prompt pondering about the potential influence of financial humor on market movements. This paper highlights the need for further research into the interplay of financial journalism and stock market dynamics, and provides insightful implications for both investors and ink-stained wits alike.
[[INTRDUCTION]]
Financial markets have long been the subject of extensive and often solemn scrutiny by researchers seeking to uncover the intricate mechanisms governing stock price movements. However, amidst this sea of earnest analysis, a rather unconventional question has emerged: What impact, if any, does the Friday dispatch of Matt Levine's financial musings on Bloomberg's platform have on the stock price of Telefónica? While this question may initially elicit a raised eyebrow or two, our investigation has revealed compelling evidence of a surprisingly robust association between Mr. Levine's whimsical literary offerings and the gyrations of Telefónica's stock price.
The notion that the wry charm and witticisms of a financial journalist could exert a tangible influence on the tumultuous tendencies of a multinational telecommunications company may strike some as preposterous - akin to suggesting that a well-placed piece of market commentary could elicit more chortles than market tremors. Nonetheless, our study delves into this uncharted territory, venturing into the quirky intersection of finance, journalism, and levity. As we navigate this captivating labyrinth, we invite our esteemed readers to join us on this intellectual escapade, where the pathways of financial data and thoughtful prose converge in an unexpected tango.
Our exploration of this uncharted territory aims not only to shed light on the curious bond between financial journalism and market dynamics but also to cast a discerning eye on the potential implications for investors and aficionados of financial wit. As we unveil the striking correlation between the number of articles published by Mr. Levine on Fridays and Telefónica's stock price movements, we must reckon with the beguiling notion that perhaps, just perhaps, there exists a quirky force at play in the otherwise stoic realm of stock market analysis.
So, dear readers, gird your loins and prepare to embark on this whimsical odyssey into the correlated capers of Mr. Levine's Friday missives and the tempestuous undulations of Telefónica's stock price. For as we unravel the enigmatic connection between financial punditry and market machinations, we may find ourselves not only enlightened but also entertained - truly an unexpected dividend in the serious pursuit of scholarly inquiry.
[[RESULTS]]
The analysis revealed a noteworthy correlation between the number of articles authored by Matt Levine on Bloomberg on Fridays and Telefónica's stock price (TEF). Over the period from 2014 to 2023, the correlation coefficient was determined to be 0.9736242. This finding suggests a remarkably strong positive relationship between the frequency of Mr. Levine's published musings and the fluctuations in Telefónica's stock price. Additionally, the coefficient of determination (r-squared) of 0.9479440 indicates that approximately 94.79% of the variability in Telefónica's stock price can be explained by the number of articles produced by Mr. Levine on Fridays.
The presence of a correlation approaching unity prompts speculation regarding the potential influence of financial humor on market movements. While correlation does not imply causation, the strength of the relationship observed in this study warrants further investigation into the interplay of financial journalism and stock market dynamics. The statistical significance with p < 0.01 further underscores the robustness of the identified association, indicating that the likelihood of observing such a strong correlation by random chance is less than 1 in 100.
Figure 1 presents a scatterplot illustrating the conspicuously strong positive correlation between the number of articles published by Mr. Levine on Fridays and Telefónica's stock price. The tightly clustered data points on the scatterplot further emphasize the pronounced relationship between these variables, lending visual support to the statistical findings.
-------
Your response should start like this:
[[CONCLUSION]]
ChatGPT:
[[CONCLUSION]]
In conclusion, our study has showcased a remarkably robust positive correlation between the frequency of articles written by Matt Levine on Bloomberg on Fridays and the fluctuations in Telefónica's stock price. The striking correlation coefficient of 0.9736242, coupled with a high coefficient of determination, suggests a compelling relationship between Mr. Levine's financial musings and the market machinations of Telefónica. It appears that the pen of the financial journalist may indeed possess an unexpected sway over the stock market, akin to a sly magician discreetly manipulating the fate of the financial realm.
It is intriguing to consider the potential implications of this correlation. One cannot help but wonder if Mr. Levine's clever quips and sardonic anecdotes could be inadvertently swaying the market forces, perhaps rendering Wall Street as the new stage for a grand comedic performance. However, caution should be exercised in leaping to causative conclusions, as correlation does not equate to causation. Nonetheless, the findings of this study prompt further inquiry into the delightful dance between financial journalism and stock market dynamics.
As we reflect on these novel findings, the need for additional research into the interplay of financial humor and market movements becomes evident. One might say that this avenue of inquiry possesses a certain enigmatic allure, much like a cryptic crossword puzzle challenging the intellect of both the seasoned analyst and the insouciant observer. This study opens the door to a world where the whimsy of financial punditry may have a tangible impact on the solemn world of stock prices, creating a perennial jest in the stoic halls of financial analysis.
Thus, in this peculiar realm, we find ourselves at an intriguing juncture: where financial gravity meets the levity of literary prowess, and where the mundane rhythms of the market are enlivened by the colorful cadence of words. As we bid adieu to this enthralling expedition, it is clear that no more research is needed in this area.
Model: gpt-3.5-turbo-1106
System prompt: You provide fictional names of academic journals. You say nothing else, and you do not chat with the user.
User prompt: Please provide the name of a funny but plausible sounding research, scientific, or academic journal that would publish a paper entited Friday Flurry: Matt Levine's Musings and Telefónica's Tumultuous Tendencies. Respond only with the name of a fictional academic journal.
ChatGPT:
The Journal of Whimsical Economics
Model: gpt-3.5-turbo-1106
System prompt: You provide fictional names of nonprofit research organizations and associations. You say nothing else, and you do not chat with the user.
User prompt: Please provide the name of a funny but plausible sounding nonprofit, academic, or scientific association or organization that would sponsor research that resulted in a paper entited Friday Flurry: Matt Levine's Musings and Telefónica's Tumultuous Tendencies. Respond only with the name of a fictional organization.
ChatGPT:
Institute for Whimsical Research and Analysis
Model: gpt-3.5-turbo-1106
System prompt: You provide potential search keywords separated by commas. You say nothing else, and you do not chat with the user.
User prompt: Please provide potential search keywords for a paper titled Friday Flurry: Matt Levine's Musings and Telefónica's Tumultuous Tendencies with an abstract of This study investigates the relationship between the number of articles published by Matt Levine on Bloomberg on Fridays and the stock price of Telefónica (TEF). Utilizing data from Bloomberg and LSEG Analytics (Refinitiv) covering the period from 2014 to 2023, a correlation coefficient of 0.9736242 and p < 0.01 was discovered. Our findings suggest a remarkably strong positive correlation between the whimsical prose of Mr. Levine and the fluctuations in Telefónica's stock price. The results, while surprising, prompt pondering about the potential influence of financial humor on market movements. This paper highlights the need for further research into the interplay of financial journalism and stock market dynamics, and provides insightful implications for both investors and ink-stained wits alike.
ChatGPT:
Matt Levine, Bloomberg, financial journalism, stock price correlation, Telefónica, TEF, market movements, stock market dynamics, financial humor, LSEG Analytics, Refinitiv, market fluctuations
*There is a bunch of Python happening behind the scenes to turn this prompt sequence into a PDF.
Discover a new correlation
View all correlations
View all research papers
Report an error
Data details
Number of articles Matt Levine published on Bloomberg on FridaysDetailed data title: Articles published by Matt Levine on Bloomberg.com on Friday
Source: Bloomberg
Additional Info: All headline and summary text from Bloomberg articles by Matt Levine included
See what else correlates with Number of articles Matt Levine published on Bloomberg on Fridays
Telefónica's stock price (TEF)
Detailed data title: Opening price of Telefónica (TEF) on the first trading day of the year
Source: LSEG Analytics (Refinitiv)
Additional Info: Via Microsoft Excel Stockhistory function
See what else correlates with Telefónica's stock price (TEF)
Correlation is a measure of how much the variables move together. If it is 0.99, when one goes up the other goes up. If it is 0.02, the connection is very weak or non-existent. If it is -0.99, then when one goes up the other goes down. If it is 1.00, you probably messed up your correlation function.
r2 = 0.9479440 (Coefficient of determination)
This means 94.8% of the change in the one variable (i.e., Telefónica's stock price (TEF)) is predictable based on the change in the other (i.e., Number of articles Matt Levine published on Bloomberg on Fridays) over the 10 years from 2014 through 2023.
p < 0.01, which is statistically significant(Null hypothesis significance test)
The p-value is 2.05E-6. 0.0000020511159279685267000000
The p-value is a measure of how probable it is that we would randomly find a result this extreme. More specifically the p-value is a measure of how probable it is that we would randomly find a result this extreme if we had only tested one pair of variables one time.
But I am a p-villain. I absolutely did not test only one pair of variables one time. I correlated hundreds of millions of pairs of variables. I threw boatloads of data into an industrial-sized blender to find this correlation.
Who is going to stop me? p-value reporting doesn't require me to report how many calculations I had to go through in order to find a low p-value!
On average, you will find a correaltion as strong as 0.97 in 0.000205% of random cases. Said differently, if you correlated 487,539 random variables You don't actually need 487 thousand variables to find a correlation like this one. I don't have that many variables in my database. You can also correlate variables that are not independent. I do this a lot.
p-value calculations are useful for understanding the probability of a result happening by chance. They are most useful when used to highlight the risk of a fluke outcome. For example, if you calculate a p-value of 0.30, the risk that the result is a fluke is high. It is good to know that! But there are lots of ways to get a p-value of less than 0.01, as evidenced by this project.
In this particular case, the values are so extreme as to be meaningless. That's why no one reports p-values with specificity after they drop below 0.01.
Just to be clear: I'm being completely transparent about the calculations. There is no math trickery. This is just how statistics shakes out when you calculate hundreds of millions of random correlations.
with the same 9 degrees of freedom, Degrees of freedom is a measure of how many free components we are testing. In this case it is 9 because we have two variables measured over a period of 10 years. It's just the number of years minus ( the number of variables minus one ), which in this case simplifies to the number of years minus one.
you would randomly expect to find a correlation as strong as this one.
[ 0.89, 0.99 ] 95% correlation confidence interval (using the Fisher z-transformation)
The confidence interval is an estimate the range of the value of the correlation coefficient, using the correlation itself as an input. The values are meant to be the low and high end of the correlation coefficient with 95% confidence.
This one is a bit more complciated than the other calculations, but I include it because many people have been pushing for confidence intervals instead of p-value calculations (for example: NEJM. However, if you are dredging data, you can reliably find yourself in the 5%. That's my goal!
All values for the years included above: If I were being very sneaky, I could trim years from the beginning or end of the datasets to increase the correlation on some pairs of variables. I don't do that because there are already plenty of correlations in my database without monkeying with the years.
Still, sometimes one of the variables has more years of data available than the other. This page only shows the overlapping years. To see all the years, click on "See what else correlates with..." link above.
| 2014 | 2015 | 2016 | 2017 | 2018 | 2019 | 2020 | 2021 | 2022 | 2023 | |
| Number of articles Matt Levine published on Bloomberg on Fridays (Levine articles) | 90 | 66 | 59 | 52 | 57 | 46 | 26 | 14 | 7 | 6 |
| Telefónica's stock price (TEF) (Stock price) | 15.76 | 14.11 | 10.82 | 9.19 | 9.82 | 8.35 | 7.09 | 4.13 | 4.32 | 3.62 |
Why this works
- Data dredging: I have 25,153 variables in my database. I compare all these variables against each other to find ones that randomly match up. That's 632,673,409 correlation calculations! This is called “data dredging.” Instead of starting with a hypothesis and testing it, I instead abused the data to see what correlations shake out. It’s a dangerous way to go about analysis, because any sufficiently large dataset will yield strong correlations completely at random.
- Lack of causal connection: There is probably
Because these pages are automatically generated, it's possible that the two variables you are viewing are in fact causually related. I take steps to prevent the obvious ones from showing on the site (I don't let data about the weather in one city correlate with the weather in a neighboring city, for example), but sometimes they still pop up. If they are related, cool! You found a loophole.
no direct connection between these variables, despite what the AI says above. This is exacerbated by the fact that I used "Years" as the base variable. Lots of things happen in a year that are not related to each other! Most studies would use something like "one person" in stead of "one year" to be the "thing" studied. - Observations not independent: For many variables, sequential years are not independent of each other. If a population of people is continuously doing something every day, there is no reason to think they would suddenly change how they are doing that thing on January 1. A simple
Personally I don't find any p-value calculation to be 'simple,' but you know what I mean.
p-value calculation does not take this into account, so mathematically it appears less probable than it really is. - Outlandish outliers: There are "outliers" in this data.
In concept, "outlier" just means "way different than the rest of your dataset." When calculating a correlation like this, they are particularly impactful because a single outlier can substantially increase your correlation.
For the purposes of this project, I counted a point as an outlier if it the residual was two standard deviations from the mean.
(This bullet point only shows up in the details page on charts that do, in fact, have outliers.)
They stand out on the scatterplot above: notice the dots that are far away from any other dots. I intentionally mishandeled outliers, which makes the correlation look extra strong.
Try it yourself
You can calculate the values on this page on your own! Try running the Python code to see the calculation results. Step 1: Download and install Python on your computer.Step 2: Open a plaintext editor like Notepad and paste the code below into it.
Step 3: Save the file as "calculate_correlation.py" in a place you will remember, like your desktop. Copy the file location to your clipboard. On Windows, you can right-click the file and click "Properties," and then copy what comes after "Location:" As an example, on my computer the location is "C:\Users\tyler\Desktop"
Step 4: Open a command line window. For example, by pressing start and typing "cmd" and them pressing enter.
Step 5: Install the required modules by typing "pip install numpy", then pressing enter, then typing "pip install scipy", then pressing enter.
Step 6: Navigate to the location where you saved the Python file by using the "cd" command. For example, I would type "cd C:\Users\tyler\Desktop" and push enter.
Step 7: Run the Python script by typing "python calculate_correlation.py"
If you run into any issues, I suggest asking ChatGPT to walk you through installing Python and running the code below on your system. Try this question:
"Walk me through installing Python on my computer to run a script that uses scipy and numpy. Go step-by-step and ask me to confirm before moving on. Start by asking me questions about my operating system so that you know how to proceed. Assume I want the simplest installation with the latest version of Python and that I do not currently have any of the necessary elements installed. Remember to only give me one step per response and confirm I have done it before proceeding."
# These modules make it easier to perform the calculation
import numpy as np
from scipy import stats

# We'll define a function that we can call to return the correlation calculations
def calculate_correlation(array1, array2):

    # Calculate Pearson correlation coefficient and p-value
    correlation, p_value = stats.pearsonr(array1, array2)

    # Calculate R-squared as the square of the correlation coefficient
    r_squared = correlation**2

    return correlation, r_squared, p_value

# These are the arrays for the variables shown on this page, but you can modify them to be any two sets of numbers
array_1 = np.array([90,66,59,52,57,46,26,14,7,6,])
array_2 = np.array([15.76,14.11,10.82,9.19,9.82,8.35,7.09,4.13,4.32,3.62,])
array_1_name = "Number of articles Matt Levine published on Bloomberg on Fridays"
array_2_name = "Telefónica's stock price (TEF)"

# Perform the calculation
print(f"Calculating the correlation between {array_1_name} and {array_2_name}...")
correlation, r_squared, p_value = calculate_correlation(array_1, array_2)

# Print the results
print("Correlation Coefficient:", correlation)
print("R-squared:", r_squared)
print("P-value:", p_value)
Reuseable content
You may re-use the images on this page for any purpose, even commercial purposes, without asking for permission. The only requirement is that you attribute Tyler Vigen. Attribution can take many different forms. If you leave the "tylervigen.com" link in the image, that satisfies it just fine. If you remove it and move it to a footnote, that's fine too. You can also just write "Charts courtesy of Tyler Vigen" at the bottom of an article.You do not need to attribute "the spurious correlations website," and you don't even need to link here if you don't want to. I don't gain anything from pageviews. There are no ads on this site, there is nothing for sale, and I am not for hire.
For the record, I am just one person. Tyler Vigen, he/him/his. I do have degrees, but they should not go after my name unless you want to annoy my wife. If that is your goal, then go ahead and cite me as "Tyler Vigen, A.A. A.A.S. B.A. J.D." Otherwise it is just "Tyler Vigen."
When spoken, my last name is pronounced "vegan," like I don't eat meat.
Full license details.
For more on re-use permissions, or to get a signed release form, see tylervigen.com/permission.
Download images for these variables:
- High resolution line chart
The image linked here is a Scalable Vector Graphic (SVG). It is the highest resolution that is possible to achieve. It scales up beyond the size of the observable universe without pixelating. You do not need to email me asking if I have a higher resolution image. I do not. The physical limitations of our universe prevent me from providing you with an image that is any higher resolution than this one.
If you insert it into a PowerPoint presentation (a tool well-known for managing things that are the scale of the universe), you can right-click > "Ungroup" or "Create Shape" and then edit the lines and text directly. You can also change the colors this way.
Alternatively you can use a tool like Inkscape. - High resolution line chart, optimized for mobile
- Alternative high resolution line chart
- Scatterplot
- Portable line chart (png)
- Portable line chart (png), optimized for mobile
- Line chart for only Number of articles Matt Levine published on Bloomberg on Fridays
- Line chart for only Telefónica's stock price (TEF)
- AI-generated correlation image
- The spurious research paper: Friday Flurry: Matt Levine's Musings and Telefónica's Tumultuous Tendencies
You're the rating guru we've been waiting for!
Correlation ID: 5886 · Black Variable ID: 26739 · Red Variable ID: 1877

