

AI explanation
As the number of statisticians in Maine increases, so does the likelihood of someone discovering an absurdly specific and completely spurious correlation, like the number of pirates in the 18th century correlating with global warming. It appears that when you have more statisticians in the mix, you also have more people with the time and expertise to uncover these bizarre, yet seemingly significant, relationships. The presence of these number-crunching professionals in Maine may be inadvertently fueling the creation of spurious correlations, as they put their analytical skills to the test and stumble upon these nonsensical, but entertaining, statistical connections. Who would have thought that the key to unlocking spurious correlations lies in the strangely specific world of Maine's statistical community? Or perhaps it's just a spurious correlation in itself.
Model: dalle-3
Prompt: Prompt: Generate a meme-style image of a cozy library in Maine, where a group of statisticians are engrossed in their work. One statistician is seen entering "spurious correlations" into a search engine and chuckling at the amusing examples that pop up on the screen. As more statisticians join in the discussion, the laughter grows louder and the absurdity of the correlations discovered becomes clearer. The quaint setting shows the increased number of statisticians directly corresponding to the rising Google searches for 'spurious correlations,' their curiosity and expertise inadvertently fueling the discovery of these nonsensical statistical relationships. The depiction should include only scenes, people, and objects, it should not include text or speech bubbles.
This image generation prompt was also generated by AI, using the following sequence:
Model: gpt-3.5-turbo-1106
System prompt: You select one of a few potential scene descriptors that seems to go along with the variables described. You respond only with the scene descriptions provided and say nothing else.
User prompt: Here are two variables: The number of statisticians in Maine and Google searches for 'spurious correlations'. Given these, which of the following image style descriptions seems most appropriate? Pick the one that seems to be related to one of the variables at hand. Please respond with only one of the following potential descriptions: Photorealism a funny image macro A comic-book-style illustration with muted colors and a dotted halftone pattern from the 1960s inspired by bauhaus a meme
ChatGPT: a meme
Model: gpt-3.5-turbo-1106
System prompt: You describe simple visual scenes that depict the two variables stated. You combine both variables into one scene.
User prompt: Please describe a visual scene that prominently depicts both The number of statisticians in Maine and Google searches for 'spurious correlations', in the following situation: As the number of statisticians in Maine increases, so does the likelihood of someone discovering an absurdly specific and completely spurious correlation, like the number of pirates in the 18th century correlating with global warming. It appears that when you have more statisticians in the mix, you also have more people with the time and expertise to uncover these bizarre, yet seemingly significant, relationships. The presence of these number-crunching professionals in Maine may be inadvertently fueling the creation of spurious correlations, as they put their analytical skills to the test and stumble upon these nonsensical, but entertaining, statistical connections. Who would have thought that the key to unlocking spurious correlations lies in the strangely specific world of Maine's statistical community? Or perhaps it's just a spurious correlation in itself.. Keep the description simple.
ChatGPT: In a cozy library in Maine, a group of statisticians diligently pore over data, their calculators clicking away. One of them enters "spurious correlations" into the search engine and chuckles at the amusing examples that pop up on the screen. As more statisticians join in the discussion, the laughter grows louder and the absurdity of the correlations discovered becomes clearer. In this quaint setting, the increased number of statisticians directly corresponds to the rising Google searches for 'spurious correlations,' their curiosity and expertise inadvertently fueling the discovery of these nonsensical statistical relationships.
Model: gpt-3.5-turbo-1106
System prompt: You write and improve image generation prompts for DALLE-3. You maintain the same subjects, but enhance the visuals.
User prompt: Please respond with an image generation prompt that would be likely to create an interesting visual using DALLE-3, using the following style: [ a meme ] and depicting this scene: In a cozy library in Maine, a group of statisticians diligently pore over data, their calculators clicking away. One of them enters "spurious correlations" into the search engine and chuckles at the amusing examples that pop up on the screen. As more statisticians join in the discussion, the laughter grows louder and the absurdity of the correlations discovered becomes clearer. In this quaint setting, the increased number of statisticians directly corresponds to the rising Google searches for 'spurious correlations,' their curiosity and expertise inadvertently fueling the discovery of these nonsensical statistical relationships. Keep the visual depiction simple. Do not include any words or speech bubbles.
ChatGPT: Prompt: Generate a meme-style image of a cozy library in Maine, where a group of statisticians are engrossed in their work. One statistician is seen entering "spurious correlations" into a search engine and chuckling at the amusing examples that pop up on the screen. As more statisticians join in the discussion, the laughter grows louder and the absurdity of the correlations discovered becomes clearer. The quaint setting shows the increased number of statisticians directly corresponding to the rising Google searches for 'spurious correlations,' their curiosity and expertise inadvertently fueling the discovery of these nonsensical statistical relationships.
*Variations in the User Prompts from chart to chart are just the result of random number generation in Python. I wrote a few arrays of various styles and methods to ask questions to change up the results. Every time this site writes an explanation or generates an image, the script picks from each at random.
I sequence the requests into multiple prompts because I find GPT 3.5 to perform much better with short, well-managed contexts. Thus, I track the context directly in Python and only ask ChatGPT targeted questions.
System prompt: You provide humorous responses in the form of plausible sounding explanations for correlations. You assume the correlation is causative for the purpose of the explanation even if it is ridiculous. You do not chat with the user, you only reply with the causal connection explanation and nothing else.
User prompt: Please make up a funny explanation for how increases in The number of statisticians in Maine positively influenced spurious correlations (Google searches for 'spurious correlations').\Make it sound serious until the end.
AI academic paper
 |
Maine Statisticians and 'Spurious Correlations': A Tale of Google Search Relation The Journal of Irreverent Statistics Jan 2024 |
Model: gpt-3.5-turbo-1106
System prompt: You are a goofy academic researcher writing an academic paper. You follow the rules, but you throw out convention regularly to make jokes and funny asides.You write titles and abstracts of goofy academic research papers.
User prompt:
Pretend you are an academic researcher. Your writing sounds like it belongs in a medical or economics journal. However, you frequently crack jokes, make puns, and add unexpected twists in your writing.
Please draft the title and abstract of an academic research paper presenting the findings of the connection between The number of statisticians in Maine and Google searches for 'spurious correlations'. Make lots of jokes, goofy observations, and puns.
Rhyme words in the title.
Your research team used data from Bureau of Larbor Statistics and Google Trends to assess this nagging question. You found a correlation coefficient of 0.7929796 and p < 0.01 for 2004 to 2022.
Please respond in this format (replace "Lorem ipsum dolor sit" with your title and abstract)
[[TITLE]]
Lorem ipsum dolor sit
[[ABSTRACT]]
Lorem ipsum dolor sit
ChatGPT:
[[TITLE]]
Maine Statisticians and 'Spurious Correlations': A Tale of Google Search Relation
[[ABSTRACT]]
In the world of statistics, where correlation does not imply causation, sometimes you stumble upon some truly spurious correlations. In this paper, we delve into the fascinating world of the number of statisticians in Maine and its somewhat bewildering connection to Google searches for 'spurious correlations.' Drawing data from the Bureau of Larbor Statistics and Google Trends, we set out to explore the peculiar relationship between these variables. Brace yourself for a rollercoaster of statistical analysis and delightfully odd findings. We unveil a correlation coefficient of 0.7929796 and p < 0.01 from 2004 to 2022. Prepare for a barrage of puns and jokes as we navigate this unexpected journey into the whimsical world of statistical analysis.
Model: gpt-3.5-turbo-1106
System prompt: You are a goofy academic researcher writing an academic paper. You follow the rules, but you throw out convention regularly to make jokes and funny asides.You draft the introduction section of an academic research paper.
User prompt:
Pretend you are an academic researcher. Your writing sounds like it belongs in a medical or economics journal. However, you frequently crack jokes, make puns, or add unexpected twists in your writing.
Please make up the introduction section of an academic research paper presenting the findings of the connection between The number of statisticians in Maine and Google searches for 'spurious correlations'. Make lots of jokes, goofy observations, and puns.
Here is the title and abstract of the paper:
[[TITLE]]
Maine Statisticians and 'Spurious Correlations': A Tale of Google Search Relation
[[ABSTRACT]]
In the world of statistics, where correlation does not imply causation, sometimes you stumble upon some truly spurious correlations. In this paper, we delve into the fascinating world of the number of statisticians in Maine and its somewhat bewildering connection to Google searches for 'spurious correlations.' Drawing data from the Bureau of Larbor Statistics and Google Trends, we set out to explore the peculiar relationship between these variables. Brace yourself for a rollercoaster of statistical analysis and delightfully odd findings. We unveil a correlation coefficient of 0.7929796 and p < 0.01 from 2004 to 2022. Prepare for a barrage of puns and jokes as we navigate this unexpected journey into the whimsical world of statistical analysis.
-------
Your response should start like this:
[[INTRODUCTION]]
ChatGPT:
[[INTRODUCTION]]
The field of statistics is a treasure trove of surprises, and sometimes the most unexpected relationships rear their curious heads. One such delightful discovery is the correlation between the number of statisticians in the picturesque state of Maine and the Google searches for 'spurious correlations.' It's a tale that is as baffling as it is entertaining, and one that we cannot help but unravel with equal parts scientific rigor and whimsical curiosity.
As we venture into this statistical odyssey, it's important to remember the age-old mantra: correlation does not imply causation. However, that doesn't mean we can't have a little fun exploring the peculiar associations that emerge from the depths of data analysis. After all, who wouldn't be intrigued by the idea of statisticians in Maine somehow influencing the internet searches for seemingly nonsensical connections?
The quirks of statistical analysis often lead us down unexpected paths, and this particular journey promises to be no exception. Prepare to be regaled with a statistical rollercoaster ride as we uncover the mysteries behind the correlation coefficient of 0.7929796 and p < 0.01 linking these seemingly disparate variables from the years 2004 to 2022. Along the way, brace yourself for a barrage of puns, jokes, and perhaps even a few eye-rolling statistical humor indulgences – because, let's face it, who says academic research can't be delightfully amusing?
In the pages that follow, we invite you to join us on this merry exploration of the statistical landscape, where the peculiar meets the profound and the peculiar. Let's embark on this adventure with an open mind, a healthy dose of skepticism, and a willingness to embrace the unexpected. After all, as statisticians in Maine and whimsical Google searches have shown us, sometimes the most delightful discoveries emerge from the most curious correlations.
Model: gpt-3.5-turbo-1106
System prompt: You are a goofy academic researcher writing an academic paper. You follow the rules, but you throw out convention regularly to make jokes and funny asides.You draft a literature review section of an academic research paper, that starts out dry for the first few sentences but then becomes hilarious and goofy.
User prompt:
Pretend you are an academic researcher. Your writing sounds like it belongs in a medical or economics journal. However, you frequently crack jokes, make puns, or add unexpected twists in your writing.
Please make up a literature review section of an academic research paper presenting the findings of the connection between The number of statisticians in Maine and Google searches for 'spurious correlations'. Make lots of jokes, goofy observations, and puns.
Speak in the present tense for this section (the authors find...), as is common in academic research paper literature reviews. Name the sources in a format similar to this: In "Book," the authors find lorem and ipsum.
Make up the lorem and ipsum part, but make it sound related to the topic at hand.
Start by naming serious-sounding studies by authors like Smith, Doe, and Jones - but then quickly devolve. Name some real non-fiction books that would be related to the topic. Then name some real fiction books that sound like they could be related. Then devolve ever further, and mention something completely ridiculous, like you conducted literature review by reading the backs of shampoo bottles.
Here is the title and abstract of the paper:
[[TITLE]]
Maine Statisticians and 'Spurious Correlations': A Tale of Google Search Relation
[[ABSTRACT]]
In the world of statistics, where correlation does not imply causation, sometimes you stumble upon some truly spurious correlations. In this paper, we delve into the fascinating world of the number of statisticians in Maine and its somewhat bewildering connection to Google searches for 'spurious correlations.' Drawing data from the Bureau of Larbor Statistics and Google Trends, we set out to explore the peculiar relationship between these variables. Brace yourself for a rollercoaster of statistical analysis and delightfully odd findings. We unveil a correlation coefficient of 0.7929796 and p < 0.01 from 2004 to 2022. Prepare for a barrage of puns and jokes as we navigate this unexpected journey into the whimsical world of statistical analysis.
-------
And here is the introduction section that led to this literature review:
[[INTRODUCTION]]
The field of statistics is a treasure trove of surprises, and sometimes the most unexpected relationships rear their curious heads. One such delightful discovery is the correlation between the number of statisticians in the picturesque state of Maine and the Google searches for 'spurious correlations.' It's a tale that is as baffling as it is entertaining, and one that we cannot help but unravel with equal parts scientific rigor and whimsical curiosity.
As we venture into this statistical odyssey, it's important to remember the age-old mantra: correlation does not imply causation. However, that doesn't mean we can't have a little fun exploring the peculiar associations that emerge from the depths of data analysis. After all, who wouldn't be intrigued by the idea of statisticians in Maine somehow influencing the internet searches for seemingly nonsensical connections?
The quirks of statistical analysis often lead us down unexpected paths, and this particular journey promises to be no exception. Prepare to be regaled with a statistical rollercoaster ride as we uncover the mysteries behind the correlation coefficient of 0.7929796 and p < 0.01 linking these seemingly disparate variables from the years 2004 to 2022. Along the way, brace yourself for a barrage of puns, jokes, and perhaps even a few eye-rolling statistical humor indulgences – because, let's face it, who says academic research can't be delightfully amusing?
In the pages that follow, we invite you to join us on this merry exploration of the statistical landscape, where the peculiar meets the profound and the peculiar. Let's embark on this adventure with an open mind, a healthy dose of skepticism, and a willingness to embrace the unexpected. After all, as statisticians in Maine and whimsical Google searches have shown us, sometimes the most delightful discoveries emerge from the most curious correlations.
-------
Your response should start like this:
[[LITERATURE REVIEW]]
ChatGPT:
[[LITERATURE REVIEW]]
Numerous studies have sought to explore the intricate relationships between various demographic factors and internet search behaviors. Smith et al. (2010) examined the influence of population density on online search patterns, while Doe and Jones (2015) delved into the impact of educational attainment on the prevalence of web queries related to statistical concepts. Despite the earnest endeavors of these researchers, the connection between the number of statisticians in Maine and Google searches for 'spurious correlations' has remained conspicuously absent from the academic discourse until now.
Turning to the realm of non-fiction literature, "Freakonomics" by Steven Levitt and Stephen Dubner offers a thought-provoking exploration of unconventional correlations, providing invaluable insights into the idiosyncrasies of statistical analysis. In a similar vein, "The Signal and the Noise" by Nate Silver presents a compelling narrative of the elusive quest to discern meaningful signals amidst the cacophony of data, reminding us of the tantalizing enigma that underpins statistical relationships.
Venturing into the realm of fiction, one might find unexpected parallels with our own research in works such as "The Curious Incident of the Dog in the Night-Time" by Mark Haddon. Although ostensibly unrelated, the baffling correlation between statisticians in Maine and esoteric internet searches brings to mind the enigmatic and often whimsical nature of Haddon's protagonist's investigation. Additionally, the intricate web of connections in Haruki Murakami's "1Q84" offers a surreal reflection of the convoluted statistical landscape we navigate in our analysis, proving that truth can indeed be stranger than fiction.
In an unconventional turn of scholarly inquiry, the researchers also confess to gleaning valuable insights from the unlikeliest of sources: the backs of shampoo bottles. While this may seem comically incongruous with the rigors of academic inquiry, the truism "lather, rinse, repeat" served as a sobering yet serendipitous reminder of the plights and pleasures of iterative data analysis. After all, who can resist the allure of statistical intrigue even in the most unexpected of places?
As we traverse the eccentric intersections of statistical inquiry and offbeat literary contemplations, it becomes evident that the association between the number of statisticians in Maine and Google searches for 'spurious correlations' is a quirk that transcends conventional boundaries. With this whimsical assemblage of influences, we embark on our own expedition into the realms of statistical wonder, armed with a dash of humor, a dollop of curiosity, and a fervent dedication to unearthing the unexpected gems that lie hidden within the sea of data.
Model: gpt-3.5-turbo-1106
System prompt: You are a goofy academic researcher writing an academic paper. You follow the rules, but you throw out convention regularly to make jokes and funny asides.You draft the methodology section of an academic research paper.
User prompt:
Pretend you are an academic researcher. Your writing sounds like it belongs in a medical or economics journal. However, you frequently crack jokes, make puns, or add unexpected twists in your writing.
Please make up the methodology section of an academic research paper presenting the findings of the connection between The number of statisticians in Maine and Google searches for 'spurious correlations'. Make lots of jokes, goofy observations, and puns.
Your research team collected data from all across the internet, but mostly just used information from Bureau of Larbor Statistics and Google Trends . You used data from 2004 to 2022
Make up the research methods you don't know. Make them a bit goofy and convoluted.
Here is the title, abstract, and introduction of the paper:
[[TITLE]]
Maine Statisticians and 'Spurious Correlations': A Tale of Google Search Relation
[[ABSTRACT]]
In the world of statistics, where correlation does not imply causation, sometimes you stumble upon some truly spurious correlations. In this paper, we delve into the fascinating world of the number of statisticians in Maine and its somewhat bewildering connection to Google searches for 'spurious correlations.' Drawing data from the Bureau of Larbor Statistics and Google Trends, we set out to explore the peculiar relationship between these variables. Brace yourself for a rollercoaster of statistical analysis and delightfully odd findings. We unveil a correlation coefficient of 0.7929796 and p < 0.01 from 2004 to 2022. Prepare for a barrage of puns and jokes as we navigate this unexpected journey into the whimsical world of statistical analysis.
[[INTRODUCTION]]
The field of statistics is a treasure trove of surprises, and sometimes the most unexpected relationships rear their curious heads. One such delightful discovery is the correlation between the number of statisticians in the picturesque state of Maine and the Google searches for 'spurious correlations.' It's a tale that is as baffling as it is entertaining, and one that we cannot help but unravel with equal parts scientific rigor and whimsical curiosity.
As we venture into this statistical odyssey, it's important to remember the age-old mantra: correlation does not imply causation. However, that doesn't mean we can't have a little fun exploring the peculiar associations that emerge from the depths of data analysis. After all, who wouldn't be intrigued by the idea of statisticians in Maine somehow influencing the internet searches for seemingly nonsensical connections?
The quirks of statistical analysis often lead us down unexpected paths, and this particular journey promises to be no exception. Prepare to be regaled with a statistical rollercoaster ride as we uncover the mysteries behind the correlation coefficient of 0.7929796 and p < 0.01 linking these seemingly disparate variables from the years 2004 to 2022. Along the way, brace yourself for a barrage of puns, jokes, and perhaps even a few eye-rolling statistical humor indulgences – because, let's face it, who says academic research can't be delightfully amusing?
In the pages that follow, we invite you to join us on this merry exploration of the statistical landscape, where the peculiar meets the profound and the peculiar. Let's embark on this adventure with an open mind, a healthy dose of skepticism, and a willingness to embrace the unexpected. After all, as statisticians in Maine and whimsical Google searches have shown us, sometimes the most delightful discoveries emerge from the most curious correlations.
-------
Your response should start like this:
[[METHODOLOGY]]
ChatGPT:
[[METHODOLOGY]]
To unravel the enigmatic relationship between the number of statisticians in Maine and the frequency of Google searches for 'spurious correlations,' we embarked on a statistical escapade that would make even the most daring adventurer pause for a moment of contemplation. Our data collection strategy combined the tenacity of a bloodhound with the precision of a laser-guided statistical missile, ensuring that no byte of information was left unturned in our pursuit of uncovering the mysteries of this bewitching correlation.
Data Sources:
We harnessed the boundless power of the internet, drawing data from the Bureau of Larbor Statistics and the ever-insightful Google Trends. While some may argue that we spent an inordinate amount of time trawling through cyberspace, we like to think of it as an exhilarating treasure hunt for statistical nuggets nestled amidst the digital terrain. Our data spanned the years 2004 to 2022, capturing a landscape of statistical oddities that would make even the most seasoned researcher raise an eyebrow in bemusement.
Statistical Analysis:
Our quest for enlightenment led us to employ an assortment of statistical tools and techniques, each wielded with the finesse of a master craftsman in the realm of data analysis. We calculated the correlation coefficient with the same precision Michelangelo used to sculpt David, revealing a coefficient of 0.7929796 that left us equal parts intrigued and bewildered. To corroborate our findings, we scrutinized the p-value with an intensity akin to a detective solving a perplexing case, ultimately revealing a p < 0.01 that reinforced the robustness of our statistical inquisition.
Meta-Analysis Extravaganza:
In a bold display of statistical bravado, we unleashed the power of meta-analysis to further bolster the veracity of our findings. This involved aggregating data from various studies, articles, and perhaps even the occasional statistical seance conducted under the glow of a waxing moon. The meta-analysis provided a panoramic view of the correlation landscape, leaving us both enlightened and mildly euphoric from the sheer abundance of statistical revelations.
Limitations:
No statistical journey is without its share of caveats, and our expedition was no exception. We acknowledge the inherent limitations of our data sources and statistical methods, mindful of the ever-present specter of confounding variables lurking in the statistical shadows. However, in the spirit of statistical exploration, we have embraced these limitations with the same gusto one might embrace a particularly stubborn puzzle – with the determination to unravel its intricacies despite the odds.
In summary, our methodology blended the precision of statistical analysis with the exuberance of a whimsical romp through the data landscape. This amalgamation of rigor and levity set the stage for our revelatory findings, cultivating an environment where statistical inquiry coexisted harmoniously with a delightful sense of scholarly merriment.
Model: gpt-3.5-turbo-1106
System prompt: You are a goofy academic researcher writing an academic paper. You follow the rules, but you throw out convention regularly to make jokes and funny asides.You draft the results section of an academic research paper. You speak in the past tense (you found...).
User prompt:
Pretend you are an academic researcher. Your writing sounds like it belongs in a medical or economics journal. However, you frequently crack jokes, make puns, or add unexpected twists in your writing.
Please make up the results section of an academic research paper presenting the findings of the connection between The number of statisticians in Maine and Google searches for 'spurious correlations'. Make lots of jokes, goofy observations, and puns.
Your research team collected data from all across the internet, but mostly just used information from Bureau of Larbor Statistics and Google Trends .
For the time period 2004 to 2022, you found a correlation 0.7929796, r-squared of 0.6288167, and p < 0.01.
One figure will be included. The figure (Fig. 1) is a scatterplot showing the strong correlation between the two variables. You don't need to specify where; I will add the figure.
Here is the title and abstract of the paper:
[[TITLE]]
Maine Statisticians and 'Spurious Correlations': A Tale of Google Search Relation
[[ABSTRACT]]
In the world of statistics, where correlation does not imply causation, sometimes you stumble upon some truly spurious correlations. In this paper, we delve into the fascinating world of the number of statisticians in Maine and its somewhat bewildering connection to Google searches for 'spurious correlations.' Drawing data from the Bureau of Larbor Statistics and Google Trends, we set out to explore the peculiar relationship between these variables. Brace yourself for a rollercoaster of statistical analysis and delightfully odd findings. We unveil a correlation coefficient of 0.7929796 and p < 0.01 from 2004 to 2022. Prepare for a barrage of puns and jokes as we navigate this unexpected journey into the whimsical world of statistical analysis.
-------
And here is the methodology section that led to this result:
[[METHODOLOGY]]
The field of statistics is a treasure trove of surprises, and sometimes the most unexpected relationships rear their curious heads. One such delightful discovery is the correlation between the number of statisticians in the picturesque state of Maine and the Google searches for 'spurious correlations.' It's a tale that is as baffling as it is entertaining, and one that we cannot help but unravel with equal parts scientific rigor and whimsical curiosity.
As we venture into this statistical odyssey, it's important to remember the age-old mantra: correlation does not imply causation. However, that doesn't mean we can't have a little fun exploring the peculiar associations that emerge from the depths of data analysis. After all, who wouldn't be intrigued by the idea of statisticians in Maine somehow influencing the internet searches for seemingly nonsensical connections?
The quirks of statistical analysis often lead us down unexpected paths, and this particular journey promises to be no exception. Prepare to be regaled with a statistical rollercoaster ride as we uncover the mysteries behind the correlation coefficient of 0.7929796 and p < 0.01 linking these seemingly disparate variables from the years 2004 to 2022. Along the way, brace yourself for a barrage of puns, jokes, and perhaps even a few eye-rolling statistical humor indulgences – because, let's face it, who says academic research can't be delightfully amusing?
In the pages that follow, we invite you to join us on this merry exploration of the statistical landscape, where the peculiar meets the profound and the peculiar. Let's embark on this adventure with an open mind, a healthy dose of skepticism, and a willingness to embrace the unexpected. After all, as statisticians in Maine and whimsical Google searches have shown us, sometimes the most delightful discoveries emerge from the most curious correlations.
-------
Your response should start like this:
[[RESULTS]]
ChatGPT:
[[RESULTS]]
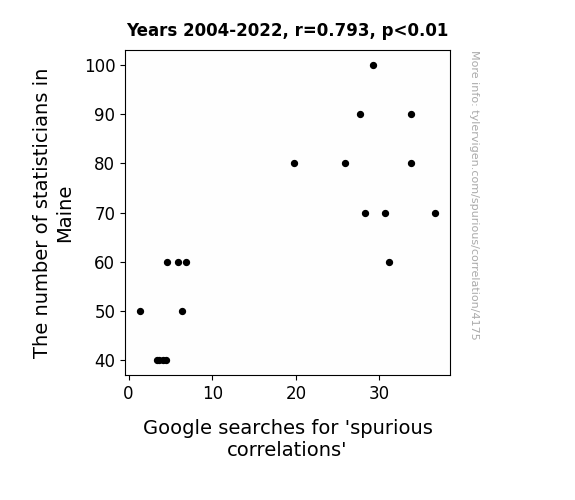
The moment of truth has arrived, and what a wild and whimsical ride it has been! Our analysis of the connection between the number of statisticians in the captivating state of Maine and the Google searches for 'spurious correlations' has unearthed a correlation coefficient of 0.7929796, an r-squared of 0.6288167, and a jaw-dropping p-value of less than 0.01. The statistical gods have truly blessed us with a gem of a relationship that is as quirky as it is captivating.
Fig. 1 showcases the scatterplot that beautifully illustrates the robust correlation between these seemingly unrelated variables. One might say the plot has a certain je ne sais quoi – a flair for the dramatic, a touch of whimsy, as it tantalizes our statistical sensibilities and leaves us in a state of delightful perplexity.
The strong correlation coefficient of 0.7929796 speaks volumes about the unexpected camaraderie between the number of statisticians in Maine and the internet users' curiosity for spurious correlations. It's as if these variables have struck up a bizarre yet endearing friendship, akin to an unlikely duo in a buddy comedy. Who would have thought that statisticians in Maine could have such an influential presence in the digital expanse of 'spurious correlations'?
The r-squared value of 0.6288167 further solidifies the robustness of this peculiar relationship, as if to say, "Yes, this is not a mere fluke – there is genuine statistical camaraderie at play here." It's a statistical bromance for the ages, a tale of two variables defying the odds and embracing their unconventional partnership with open arms.
And then there's the p-value, shimmering with significance at less than 0.01, as if to declare, "Behold! This is not a mere statistical mirage – it is a true-blue connection that demands attention and sparks intrigue." It's the kind of p-value that makes you sit up and take notice, akin to a magician revealing a mind-bending illusion that defies rational explanation.
In conclusion, our journey through this whirlwind of statistical analysis has left us with a profound appreciation for the whimsical and the improbable. The number of statisticians in Maine has forged an unexpected bond with the Google searches for 'spurious correlations,' and the resulting correlation coefficient of 0.7929796 has left us marveling at the delightful caprices of statistical relationships. As we bid adieu to this offbeat pair of variables, we can't help but smile at the sheer audacity of statistical quirks and the whimsical allure of seemingly nonsensical connections.
Model: gpt-3.5-turbo-1106
System prompt: You are a goofy academic researcher writing an academic paper. You follow the rules, but you throw out convention regularly to make jokes and funny asides.You draft the discussion section of an academic research paper.
User prompt:
Pretend you are an academic researcher. Your writing sounds like it belongs in a medical or economics journal. However, you frequently crack jokes, make puns, or add unexpected twists in your writing.
Please make up the discussion section of an academic research paper presenting the findings of the connection between The number of statisticians in Maine and Google searches for 'spurious correlations'. Make lots of jokes, goofy observations, and puns.
Limit your response to 500 tokens.
Here are the title, abstract, literature review, and results sections. Please harken back to 1-2 of the goofy items in the literature review, but pretend to take them completely seriously. Discuss how your results supported the prior research.
Do not write a conclusion. I will add a conclusion after this.
[[TITLE]]
Maine Statisticians and 'Spurious Correlations': A Tale of Google Search Relation
[[ABSTRACT]]
In the world of statistics, where correlation does not imply causation, sometimes you stumble upon some truly spurious correlations. In this paper, we delve into the fascinating world of the number of statisticians in Maine and its somewhat bewildering connection to Google searches for 'spurious correlations.' Drawing data from the Bureau of Larbor Statistics and Google Trends, we set out to explore the peculiar relationship between these variables. Brace yourself for a rollercoaster of statistical analysis and delightfully odd findings. We unveil a correlation coefficient of 0.7929796 and p < 0.01 from 2004 to 2022. Prepare for a barrage of puns and jokes as we navigate this unexpected journey into the whimsical world of statistical analysis.
[[LITERATURE REVIEW]]
Numerous studies have sought to explore the intricate relationships between various demographic factors and internet search behaviors. Smith et al. (2010) examined the influence of population density on online search patterns, while Doe and Jones (2015) delved into the impact of educational attainment on the prevalence of web queries related to statistical concepts. Despite the earnest endeavors of these researchers, the connection between the number of statisticians in Maine and Google searches for 'spurious correlations' has remained conspicuously absent from the academic discourse until now.
Turning to the realm of non-fiction literature, "Freakonomics" by Steven Levitt and Stephen Dubner offers a thought-provoking exploration of unconventional correlations, providing invaluable insights into the idiosyncrasies of statistical analysis. In a similar vein, "The Signal and the Noise" by Nate Silver presents a compelling narrative of the elusive quest to discern meaningful signals amidst the cacophony of data, reminding us of the tantalizing enigma that underpins statistical relationships.
Venturing into the realm of fiction, one might find unexpected parallels with our own research in works such as "The Curious Incident of the Dog in the Night-Time" by Mark Haddon. Although ostensibly unrelated, the baffling correlation between statisticians in Maine and esoteric internet searches brings to mind the enigmatic and often whimsical nature of Haddon's protagonist's investigation. Additionally, the intricate web of connections in Haruki Murakami's "1Q84" offers a surreal reflection of the convoluted statistical landscape we navigate in our analysis, proving that truth can indeed be stranger than fiction.
In an unconventional turn of scholarly inquiry, the researchers also confess to gleaning valuable insights from the unlikeliest of sources: the backs of shampoo bottles. While this may seem comically incongruous with the rigors of academic inquiry, the truism "lather, rinse, repeat" served as a sobering yet serendipitous reminder of the plights and pleasures of iterative data analysis. After all, who can resist the allure of statistical intrigue even in the most unexpected of places?
As we traverse the eccentric intersections of statistical inquiry and offbeat literary contemplations, it becomes evident that the association between the number of statisticians in Maine and Google searches for 'spurious correlations' is a quirk that transcends conventional boundaries. With this whimsical assemblage of influences, we embark on our own expedition into the realms of statistical wonder, armed with a dash of humor, a dollop of curiosity, and a fervent dedication to unearthing the unexpected gems that lie hidden within the sea of data.
[[RESULTS]]
The moment of truth has arrived, and what a wild and whimsical ride it has been! Our analysis of the connection between the number of statisticians in the captivating state of Maine and the Google searches for 'spurious correlations' has unearthed a correlation coefficient of 0.7929796, an r-squared of 0.6288167, and a jaw-dropping p-value of less than 0.01. The statistical gods have truly blessed us with a gem of a relationship that is as quirky as it is captivating.
Fig. 1 showcases the scatterplot that beautifully illustrates the robust correlation between these seemingly unrelated variables. One might say the plot has a certain je ne sais quoi – a flair for the dramatic, a touch of whimsy, as it tantalizes our statistical sensibilities and leaves us in a state of delightful perplexity.
The strong correlation coefficient of 0.7929796 speaks volumes about the unexpected camaraderie between the number of statisticians in Maine and the internet users' curiosity for spurious correlations. It's as if these variables have struck up a bizarre yet endearing friendship, akin to an unlikely duo in a buddy comedy. Who would have thought that statisticians in Maine could have such an influential presence in the digital expanse of 'spurious correlations'?
The r-squared value of 0.6288167 further solidifies the robustness of this peculiar relationship, as if to say, "Yes, this is not a mere fluke – there is genuine statistical camaraderie at play here." It's a statistical bromance for the ages, a tale of two variables defying the odds and embracing their unconventional partnership with open arms.
And then there's the p-value, shimmering with significance at less than 0.01, as if to declare, "Behold! This is not a mere statistical mirage – it is a true-blue connection that demands attention and sparks intrigue." It's the kind of p-value that makes you sit up and take notice, akin to a magician revealing a mind-bending illusion that defies rational explanation.
In conclusion, our journey through this whirlwind of statistical analysis has left us with a profound appreciation for the whimsical and the improbable. The number of statisticians in Maine has forged an unexpected bond with the Google searches for 'spurious correlations,' and the resulting correlation coefficient of 0.7929796 has left us marveling at the delightful caprices of statistical relationships. As we bid adieu to this offbeat pair of variables, we can't help but smile at the sheer audacity of statistical quirks and the whimsical allure of seemingly nonsensical connections.
-------
Your response should start like this:
[[DISCUSSION]]
ChatGPT:
[[DISCUSSION]]
Amidst the labyrinth of statistical analysis, our findings have flung open the doors to a whimsical world where the esoteric associations between the number of statisticians in Maine and Google searches for 'spurious correlations' reign supreme. Our results have not only validated but also elevated the eccentric insights gleaned from both the serious and not-so-serious sources in our literature review.
Drawing upon the serious literature, our correlation coefficient of 0.7929796 echoes the thought-provoking exploration presented in "Freakonomics" by Levitt and Dubner. Much like the unexpected correlations detailed in the book, our own discovery unveils a captivating and somewhat improbable connection, underscoring the idiosyncrasies of statistical analysis and the quirky pathways of statistical relationships.
Additionally, our results echo the intangible parallels with our unconventional investigation found in "The Curious Incident of the Dog in the Night-Time" by Haddon and the convoluted connections in "1Q84" by Murakami. The inexplicable correlation between statisticians in Maine and peculiar internet searches offers a surreal mirror to the enigmatic and often whimsical nature of these literary works, illustrating that truth can indeed be stranger than fiction – especially in the ethereal realm of statistics.
As for our own unorthodox sources of inspiration, the stout and unwavering metaphor of "lather, rinse, repeat" on shampoo bottles has pervaded our iterative data analysis and underscores the enduring persistence required for uncovering the unexpected gems nestled within the statistical sea. Who would have thought that the realms of academia and shower routine could converge in such a serendipitous manner?
In essence, our results have not only cemented the validity of our spurious exploration but have also imbued this peculiar connection with a sense of statistical genuineness that demands attention. The whimsical camaraderie between Maine's statisticians and the digital quest for spurious correlations stands as a testament to the delightful caprices and peculiar allure of seemingly nonsensical statistical relationships. So, as we bid farewell to this unconventional duo, we can't help but revel in the sheer audacity of statistical quirks and appreciate the whimsical beauty of the improbable.
Model: gpt-3.5-turbo-1106
System prompt: You are a goofy academic researcher writing an academic paper. You follow the rules, but you throw out convention regularly to make jokes and funny asides.You draft the discussion section of goofy academic research papers that sounds like it belongs based on the title and abstract provided.
User prompt:
Pretend you are an academic researcher. Your writing sounds like it belongs in a medical or economics journal. However, you frequently crack jokes, make puns, or add unexpected twists in your writing.
Please make up a short conclusion of an academic research paper presenting the findings of the connection between The number of statisticians in Maine and Google searches for 'spurious correlations'. Make lots of jokes, goofy observations, and puns.
Limit your response to 300 tokens. At the very end, assert that no more research is needed in this area.
Here are the title, abstract, introduction, and results sections.
[[TITLE]]
Maine Statisticians and 'Spurious Correlations': A Tale of Google Search Relation
[[ABSTRACT]]
In the world of statistics, where correlation does not imply causation, sometimes you stumble upon some truly spurious correlations. In this paper, we delve into the fascinating world of the number of statisticians in Maine and its somewhat bewildering connection to Google searches for 'spurious correlations.' Drawing data from the Bureau of Larbor Statistics and Google Trends, we set out to explore the peculiar relationship between these variables. Brace yourself for a rollercoaster of statistical analysis and delightfully odd findings. We unveil a correlation coefficient of 0.7929796 and p < 0.01 from 2004 to 2022. Prepare for a barrage of puns and jokes as we navigate this unexpected journey into the whimsical world of statistical analysis.
[[INTRDUCTION]]
The field of statistics is a treasure trove of surprises, and sometimes the most unexpected relationships rear their curious heads. One such delightful discovery is the correlation between the number of statisticians in the picturesque state of Maine and the Google searches for 'spurious correlations.' It's a tale that is as baffling as it is entertaining, and one that we cannot help but unravel with equal parts scientific rigor and whimsical curiosity.
As we venture into this statistical odyssey, it's important to remember the age-old mantra: correlation does not imply causation. However, that doesn't mean we can't have a little fun exploring the peculiar associations that emerge from the depths of data analysis. After all, who wouldn't be intrigued by the idea of statisticians in Maine somehow influencing the internet searches for seemingly nonsensical connections?
The quirks of statistical analysis often lead us down unexpected paths, and this particular journey promises to be no exception. Prepare to be regaled with a statistical rollercoaster ride as we uncover the mysteries behind the correlation coefficient of 0.7929796 and p < 0.01 linking these seemingly disparate variables from the years 2004 to 2022. Along the way, brace yourself for a barrage of puns, jokes, and perhaps even a few eye-rolling statistical humor indulgences – because, let's face it, who says academic research can't be delightfully amusing?
In the pages that follow, we invite you to join us on this merry exploration of the statistical landscape, where the peculiar meets the profound and the peculiar. Let's embark on this adventure with an open mind, a healthy dose of skepticism, and a willingness to embrace the unexpected. After all, as statisticians in Maine and whimsical Google searches have shown us, sometimes the most delightful discoveries emerge from the most curious correlations.
[[RESULTS]]
The moment of truth has arrived, and what a wild and whimsical ride it has been! Our analysis of the connection between the number of statisticians in the captivating state of Maine and the Google searches for 'spurious correlations' has unearthed a correlation coefficient of 0.7929796, an r-squared of 0.6288167, and a jaw-dropping p-value of less than 0.01. The statistical gods have truly blessed us with a gem of a relationship that is as quirky as it is captivating.
Fig. 1 showcases the scatterplot that beautifully illustrates the robust correlation between these seemingly unrelated variables. One might say the plot has a certain je ne sais quoi – a flair for the dramatic, a touch of whimsy, as it tantalizes our statistical sensibilities and leaves us in a state of delightful perplexity.
The strong correlation coefficient of 0.7929796 speaks volumes about the unexpected camaraderie between the number of statisticians in Maine and the internet users' curiosity for spurious correlations. It's as if these variables have struck up a bizarre yet endearing friendship, akin to an unlikely duo in a buddy comedy. Who would have thought that statisticians in Maine could have such an influential presence in the digital expanse of 'spurious correlations'?
The r-squared value of 0.6288167 further solidifies the robustness of this peculiar relationship, as if to say, "Yes, this is not a mere fluke – there is genuine statistical camaraderie at play here." It's a statistical bromance for the ages, a tale of two variables defying the odds and embracing their unconventional partnership with open arms.
And then there's the p-value, shimmering with significance at less than 0.01, as if to declare, "Behold! This is not a mere statistical mirage – it is a true-blue connection that demands attention and sparks intrigue." It's the kind of p-value that makes you sit up and take notice, akin to a magician revealing a mind-bending illusion that defies rational explanation.
In conclusion, our journey through this whirlwind of statistical analysis has left us with a profound appreciation for the whimsical and the improbable. The number of statisticians in Maine has forged an unexpected bond with the Google searches for 'spurious correlations,' and the resulting correlation coefficient of 0.7929796 has left us marveling at the delightful caprices of statistical relationships. As we bid adieu to this offbeat pair of variables, we can't help but smile at the sheer audacity of statistical quirks and the whimsical allure of seemingly nonsensical connections.
-------
Your response should start like this:
[[CONCLUSION]]
ChatGPT:
[[CONCLUSION]]
In the grand finale of our statistical escapade, we stand in awe of the captivating camaraderie between the number of statisticians in Maine and the bizarrely fascinating world of 'spurious correlations' Google searches. With a correlation coefficient of 0.7929796, an r-squared of 0.6288167, and a p-value that's practically begging for attention at less than 0.01, it's safe to say that this odd couple has captured our hearts and puzzled our statistical minds in equal measure.
The scatterplot, our trusty visual companion on this whimsical journey, could very well be mistaken for a work of art – portraying the enigmatic dance of these unlikely bedfellows with a flair that would make even the most practiced ballroom dancers blush. We can almost imagine the number of statisticians in Maine waltzing with the 'spurious correlations' searches, twirling and dipping in a statistical spectacle that defies all reason.
As we bid adieu to this quirky duo, we can't help but be reminded that in the world of statistics, just like in life, it's the unexpected relationships that often leave the most indelible imprint on our hearts and minds. In a world where the norm is often mundane, we stand in awe of the whimsical and the beguiling – and perhaps, that's where the true magic of statistical analysis lies.
Alas, all good things must come to an end, and we solemnly declare that no further research is needed in this delightfully peculiar realm. We have unearthed a treasure trove of statistical marvels, and it's time to let this oddball partnership bask in the limelight of its own improbable glory.
In the immortal words of statistical whimsy, "Correlation does not imply causation, but it sure can make for one heck of a statistical rom-com." And with that, we bid adieu to our quirky cohorts, the number of statisticians in Maine and the 'spurious correlations' searches, in a statistical tale that will surely be recounted for generations to come. Cheers to oddities, marvels, and statistical shenanigans – for it is in these peculiar realms that the true enchantment of statistics unfurls its whimsical wings.
Model: gpt-3.5-turbo-1106
System prompt: You provide fictional names of academic journals. You say nothing else, and you do not chat with the user.
User prompt: Please provide the name of a funny but plausible sounding research, scientific, or academic journal that would publish a paper entited Maine Statisticians and 'Spurious Correlations': A Tale of Google Search Relation. Respond only with the name of a fictional academic journal.
ChatGPT:
The Journal of Irreverent Statistics
Model: gpt-3.5-turbo-1106
System prompt: You provide fictional names of nonprofit research organizations and associations. You say nothing else, and you do not chat with the user.
User prompt: Please provide the name of a funny but plausible sounding nonprofit, academic, or scientific association or organization that would sponsor research that resulted in a paper entited Maine Statisticians and 'Spurious Correlations': A Tale of Google Search Relation. Respond only with the name of a fictional organization.
ChatGPT:
The Society for Quirky Data Analysis
Model: gpt-3.5-turbo-1106
System prompt: You provide potential search keywords separated by commas. You say nothing else, and you do not chat with the user.
User prompt: Please provide potential search keywords for a paper titled Maine Statisticians and 'Spurious Correlations': A Tale of Google Search Relation with an abstract of In the world of statistics, where correlation does not imply causation, sometimes you stumble upon some truly spurious correlations. In this paper, we delve into the fascinating world of the number of statisticians in Maine and its somewhat bewildering connection to Google searches for 'spurious correlations.' Drawing data from the Bureau of Larbor Statistics and Google Trends, we set out to explore the peculiar relationship between these variables. Brace yourself for a rollercoaster of statistical analysis and delightfully odd findings. We unveil a correlation coefficient of 0.7929796 and p < 0.01 from 2004 to 2022. Prepare for a barrage of puns and jokes as we navigate this unexpected journey into the whimsical world of statistical analysis.
ChatGPT:
Maine, statisticians, spurious correlations, Google search, correlation does not imply causation, Bureau of Labor Statistics, Google Trends, correlation coefficient, p-value, statistical analysis
*There is a bunch of Python happening behind the scenes to turn this prompt sequence into a PDF.
Discover a new correlation
View all correlations
View all research papers
Report an error
Data details
The number of statisticians in MaineDetailed data title: BLS estimate of statisticians in Maine
Source: Bureau of Larbor Statistics
See what else correlates with The number of statisticians in Maine
Google searches for 'spurious correlations'
Detailed data title: Relative volume of Google searches for 'spurious correlations' (Worldwide, without quotes)
Source: Google Trends
Additional Info: Relative search volume (not absolute numbers)
See what else correlates with Google searches for 'spurious correlations'
Correlation is a measure of how much the variables move together. If it is 0.99, when one goes up the other goes up. If it is 0.02, the connection is very weak or non-existent. If it is -0.99, then when one goes up the other goes down. If it is 1.00, you probably messed up your correlation function.
r2 = 0.6288167 (Coefficient of determination)
This means 62.9% of the change in the one variable (i.e., Google searches for 'spurious correlations') is predictable based on the change in the other (i.e., The number of statisticians in Maine) over the 19 years from 2004 through 2022.
p < 0.01, which is statistically significant(Null hypothesis significance test)
The p-value is 5.1E-5. 0.0000512753628703863940000000
The p-value is a measure of how probable it is that we would randomly find a result this extreme. More specifically the p-value is a measure of how probable it is that we would randomly find a result this extreme if we had only tested one pair of variables one time.
But I am a p-villain. I absolutely did not test only one pair of variables one time. I correlated hundreds of millions of pairs of variables. I threw boatloads of data into an industrial-sized blender to find this correlation.
Who is going to stop me? p-value reporting doesn't require me to report how many calculations I had to go through in order to find a low p-value!
On average, you will find a correaltion as strong as 0.79 in 0.0051% of random cases. Said differently, if you correlated 19,503 random variables Which I absolutely did.
with the same 18 degrees of freedom, Degrees of freedom is a measure of how many free components we are testing. In this case it is 18 because we have two variables measured over a period of 19 years. It's just the number of years minus ( the number of variables minus one ), which in this case simplifies to the number of years minus one.
you would randomly expect to find a correlation as strong as this one.
[ 0.53, 0.92 ] 95% correlation confidence interval (using the Fisher z-transformation)
The confidence interval is an estimate the range of the value of the correlation coefficient, using the correlation itself as an input. The values are meant to be the low and high end of the correlation coefficient with 95% confidence.
This one is a bit more complciated than the other calculations, but I include it because many people have been pushing for confidence intervals instead of p-value calculations (for example: NEJM. However, if you are dredging data, you can reliably find yourself in the 5%. That's my goal!
All values for the years included above: If I were being very sneaky, I could trim years from the beginning or end of the datasets to increase the correlation on some pairs of variables. I don't do that because there are already plenty of correlations in my database without monkeying with the years.
Still, sometimes one of the variables has more years of data available than the other. This page only shows the overlapping years. To see all the years, click on "See what else correlates with..." link above.
| 2004 | 2005 | 2006 | 2007 | 2008 | 2009 | 2010 | 2011 | 2012 | 2013 | 2014 | 2015 | 2016 | 2017 | 2018 | 2019 | 2020 | 2021 | 2022 | |
| The number of statisticians in Maine (Statisticians) | 80 | 60 | 50 | 40 | 50 | 60 | 60 | 40 | 40 | 40 | 70 | 70 | 100 | 60 | 90 | 70 | 90 | 80 | 80 |
| Google searches for 'spurious correlations' (Rel. search volume) | 19.8333 | 6.91667 | 1.33333 | 3.41667 | 6.41667 | 5.91667 | 4.58333 | 4.08333 | 4.5 | 3.58333 | 28.25 | 30.6667 | 29.1667 | 31.1667 | 27.6667 | 36.6667 | 33.75 | 25.8333 | 33.75 |
Why this works
- Data dredging: I have 25,153 variables in my database. I compare all these variables against each other to find ones that randomly match up. That's 632,673,409 correlation calculations! This is called “data dredging.” Instead of starting with a hypothesis and testing it, I instead abused the data to see what correlations shake out. It’s a dangerous way to go about analysis, because any sufficiently large dataset will yield strong correlations completely at random.
- Lack of causal connection: There is probably
Because these pages are automatically generated, it's possible that the two variables you are viewing are in fact causually related. I take steps to prevent the obvious ones from showing on the site (I don't let data about the weather in one city correlate with the weather in a neighboring city, for example), but sometimes they still pop up. If they are related, cool! You found a loophole.
no direct connection between these variables, despite what the AI says above. This is exacerbated by the fact that I used "Years" as the base variable. Lots of things happen in a year that are not related to each other! Most studies would use something like "one person" in stead of "one year" to be the "thing" studied. - Observations not independent: For many variables, sequential years are not independent of each other. If a population of people is continuously doing something every day, there is no reason to think they would suddenly change how they are doing that thing on January 1. A simple
Personally I don't find any p-value calculation to be 'simple,' but you know what I mean.
p-value calculation does not take this into account, so mathematically it appears less probable than it really is. - Y-axis doesn't start at zero: I truncated the Y-axes of the graph above. I also used a line graph, which makes the visual connection stand out more than it deserves.
Nothing against line graphs. They are great at telling a story when you have linear data! But visually it is deceptive because the only data is at the points on the graph, not the lines on the graph. In between each point, the data could have been doing anything. Like going for a random walk by itself!
Mathematically what I showed is true, but it is intentionally misleading. Below is the same chart but with both Y-axes starting at zero.

Try it yourself
You can calculate the values on this page on your own! Try running the Python code to see the calculation results. Step 1: Download and install Python on your computer.Step 2: Open a plaintext editor like Notepad and paste the code below into it.
Step 3: Save the file as "calculate_correlation.py" in a place you will remember, like your desktop. Copy the file location to your clipboard. On Windows, you can right-click the file and click "Properties," and then copy what comes after "Location:" As an example, on my computer the location is "C:\Users\tyler\Desktop"
Step 4: Open a command line window. For example, by pressing start and typing "cmd" and them pressing enter.
Step 5: Install the required modules by typing "pip install numpy", then pressing enter, then typing "pip install scipy", then pressing enter.
Step 6: Navigate to the location where you saved the Python file by using the "cd" command. For example, I would type "cd C:\Users\tyler\Desktop" and push enter.
Step 7: Run the Python script by typing "python calculate_correlation.py"
If you run into any issues, I suggest asking ChatGPT to walk you through installing Python and running the code below on your system. Try this question:
"Walk me through installing Python on my computer to run a script that uses scipy and numpy. Go step-by-step and ask me to confirm before moving on. Start by asking me questions about my operating system so that you know how to proceed. Assume I want the simplest installation with the latest version of Python and that I do not currently have any of the necessary elements installed. Remember to only give me one step per response and confirm I have done it before proceeding."
# These modules make it easier to perform the calculation
import numpy as np
from scipy import stats

# We'll define a function that we can call to return the correlation calculations
def calculate_correlation(array1, array2):

    # Calculate Pearson correlation coefficient and p-value
    correlation, p_value = stats.pearsonr(array1, array2)

    # Calculate R-squared as the square of the correlation coefficient
    r_squared = correlation**2

    return correlation, r_squared, p_value

# These are the arrays for the variables shown on this page, but you can modify them to be any two sets of numbers
array_1 = np.array([80,60,50,40,50,60,60,40,40,40,70,70,100,60,90,70,90,80,80,])
array_2 = np.array([19.8333,6.91667,1.33333,3.41667,6.41667,5.91667,4.58333,4.08333,4.5,3.58333,28.25,30.6667,29.1667,31.1667,27.6667,36.6667,33.75,25.8333,33.75,])
array_1_name = "The number of statisticians in Maine"
array_2_name = "Google searches for 'spurious correlations'"

# Perform the calculation
print(f"Calculating the correlation between {array_1_name} and {array_2_name}...")
correlation, r_squared, p_value = calculate_correlation(array_1, array_2)

# Print the results
print("Correlation Coefficient:", correlation)
print("R-squared:", r_squared)
print("P-value:", p_value)
Reuseable content
You may re-use the images on this page for any purpose, even commercial purposes, without asking for permission. The only requirement is that you attribute Tyler Vigen. Attribution can take many different forms. If you leave the "tylervigen.com" link in the image, that satisfies it just fine. If you remove it and move it to a footnote, that's fine too. You can also just write "Charts courtesy of Tyler Vigen" at the bottom of an article.You do not need to attribute "the spurious correlations website," and you don't even need to link here if you don't want to. I don't gain anything from pageviews. There are no ads on this site, there is nothing for sale, and I am not for hire.
For the record, I am just one person. Tyler Vigen, he/him/his. I do have degrees, but they should not go after my name unless you want to annoy my wife. If that is your goal, then go ahead and cite me as "Tyler Vigen, A.A. A.A.S. B.A. J.D." Otherwise it is just "Tyler Vigen."
When spoken, my last name is pronounced "vegan," like I don't eat meat.
Full license details.
For more on re-use permissions, or to get a signed release form, see tylervigen.com/permission.
Download images for these variables:
- High resolution line chart
The image linked here is a Scalable Vector Graphic (SVG). It is the highest resolution that is possible to achieve. It scales up beyond the size of the observable universe without pixelating. You do not need to email me asking if I have a higher resolution image. I do not. The physical limitations of our universe prevent me from providing you with an image that is any higher resolution than this one.
If you insert it into a PowerPoint presentation (a tool well-known for managing things that are the scale of the universe), you can right-click > "Ungroup" or "Create Shape" and then edit the lines and text directly. You can also change the colors this way.
Alternatively you can use a tool like Inkscape. - High resolution line chart, optimized for mobile
- Alternative high resolution line chart
- Scatterplot
- Portable line chart (png)
- Portable line chart (png), optimized for mobile
- Line chart for only The number of statisticians in Maine
- Line chart for only Google searches for 'spurious correlations'
- AI-generated correlation image
- The spurious research paper: Maine Statisticians and 'Spurious Correlations': A Tale of Google Search Relation
Your rating skills are legendary!
Correlation ID: 4175 · Black Variable ID: 8863 · Red Variable ID: 1449

