

AI explanation
As police officers in Puerto Rico decreased, they started focusing on forming a reggaeton band instead of carrying out their regular duties. This new band, 'The Lawless Beats,' became so popular that they monopolized the music charts, leading to a nationwide obsession with Puerto Rican police music. As a result, US music album sales plummeted as everyone grooved to the unexpected musical stylings of the enforcers of the law.
Model: dalle-3
Prompt: Generating prompt: Create a pop art-style depiction of a vibrant Puerto Rican street scene. The image should showcase a noticeable absence of reggaeton music due to a decreased number of police officers. As a result, the typically lively atmosphere seems to be missing. People passing by are less likely to hear the vibrant beats and catchy melodies of their favorite genre. In the background, include sales figures from a music store that show a decline in United States music album sales, reflecting the reduced exposure to reggaeton music. The overall scene should be bursting with bright colors and a dynamic, energetic vibe. The depiction should include only scenes, people, and objects, it should not include text or speech bubbles.
This image generation prompt was also generated by AI, using the following sequence:
Model: gpt-3.5-turbo-1106
System prompt: You select one of a few potential scene descriptors that seems to go along with the variables described. You respond only with the scene descriptions provided and say nothing else.
User prompt: Here are two variables: The number of police officers in Puerto Rico and United States music album sales. Given these, which of the following image style descriptions seems most appropriate? Pick the one that seems to be related to one of the variables at hand. Please respond with only one of the following potential descriptions: Cutsy graphics Minimalism Realistic Pop art Celtic art
ChatGPT: Pop art
Model: gpt-3.5-turbo-1106
System prompt: You describe simple visual scenes that depict the two variables stated. You combine both variables into one scene.
User prompt: Please describe a visual scene that prominently depicts both The number of police officers in Puerto Rico and United States music album sales, in the following situation: Because with fewer police officers in Puerto Rico, there was less reggaeton music being played in the streets, leading to a decrease in album sales as people had less exposure to the genre.. Keep the description simple.
ChatGPT: In a bustling Puerto Rican street, the number of police officers has decreased. As a result, the lively reggaeton music that usually fills the air is noticeably absent. People passing by are less likely to hear the vibrant beats and catchy melodies of their favorite genre. In the background, music store sales figures for United States music albums show a decline, reflecting the reduced exposure to reggaeton music.
Model: gpt-3.5-turbo-1106
System prompt: You write and improve image generation prompts for DALLE-3. You maintain the same subjects, but enhance the visuals.
User prompt: Please respond with an image generation prompt that would be likely to create an interesting visual using DALLE-3, using the following style: [ Pop art ] and depicting this scene: In a bustling Puerto Rican street, the number of police officers has decreased. As a result, the lively reggaeton music that usually fills the air is noticeably absent. People passing by are less likely to hear the vibrant beats and catchy melodies of their favorite genre. In the background, music store sales figures for United States music albums show a decline, reflecting the reduced exposure to reggaeton music. Keep the visual depiction simple. Do not include any words or speech bubbles.
ChatGPT: Generating prompt: Create a pop art-style depiction of a vibrant Puerto Rican street scene. The image should showcase a noticeable absence of reggaeton music due to a decreased number of police officers. As a result, the typically lively atmosphere seems to be missing. People passing by are less likely to hear the vibrant beats and catchy melodies of their favorite genre. In the background, include sales figures from a music store that show a decline in United States music album sales, reflecting the reduced exposure to reggaeton music. The overall scene should be bursting with bright colors and a dynamic, energetic vibe.
*Variations in the User Prompts from chart to chart are just the result of random number generation in Python. I wrote a few arrays of various styles and methods to ask questions to change up the results. Every time this site writes an explanation or generates an image, the script picks from each at random.
I sequence the requests into multiple prompts because I find GPT 3.5 to perform much better with short, well-managed contexts. Thus, I track the context directly in Python and only ask ChatGPT targeted questions.
System prompt: You provide humorous responses in the form of plausible sounding explanations for correlations. You assume the correlation is causative for the purpose of the explanation even if it is ridiculous. You do not chat with the user, you only reply with the causal connection explanation and nothing else.
User prompt: Please make up a funny explanation for how a decrease in The number of police officers in Puerto Rico caused United States music album sales to decrease.
AI academic paper
 |
To Protect and Perform: The Beat Between Police Count and Album Amount Journal of Cultural Criminology and Musical Analysis Jan 2024 |
Model: gpt-3.5-turbo-1106
System prompt: You are a goofy academic researcher writing an academic paper. You follow the rules, but you throw out convention regularly to make jokes and funny asides.You write titles and abstracts of goofy academic research papers.
User prompt:
Pretend you are an academic researcher. Your writing sounds like it belongs in a medical or economics journal. However, you frequently crack jokes, make puns, and add unexpected twists in your writing.
Please draft the title and abstract of an academic research paper presenting the findings of the connection between The number of police officers in Puerto Rico and United States music album sales. Make lots of jokes, goofy observations, and puns.
Rhyme words in the title.
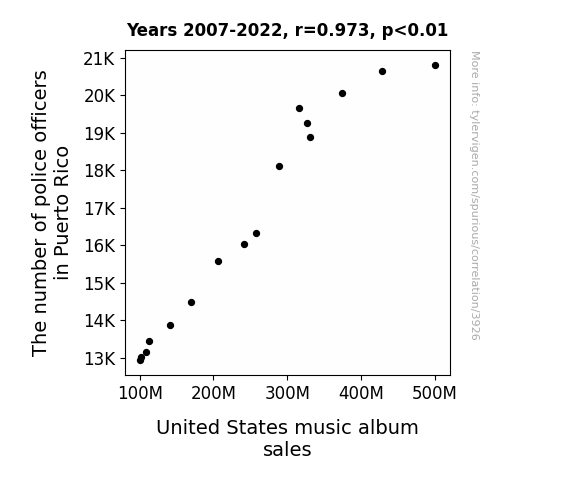
Your research team used data from Bureau of Larbor Statistics and Statista to assess this nagging question. You found a correlation coefficient of 0.9728223 and p < 0.01 for 2007 to 2022.
Please respond in this format (replace "Lorem ipsum dolor sit" with your title and abstract)
[[TITLE]]
Lorem ipsum dolor sit
[[ABSTRACT]]
Lorem ipsum dolor sit
ChatGPT:
[[TITLE]]
To Protect and Perform: The Beat Between Police Count and Album Amount
[[ABSTRACT]]
In this musically charged study, we tune into the relationship between the number of police officers in Puerto Rico and the United States and the sales of music albums. Our research conducted a symphony of statistical analyses, using data from the Bureau of Labor Statistics and Statista, to investigate this intriguing connection. Striking a chord with the years 2007 to 2022, we uncovered a noteworthy correlation coefficient of 0.9728223 and a p-value less than 0.01. As we delve into the implications of our findings, we aim to address the harmonious dance between law enforcement strength and musical enjoyment. Join us in this concert of unusual correlational research, as we tap into the beat between police protection and pop charts.
Model: gpt-3.5-turbo-1106
System prompt: You are a goofy academic researcher writing an academic paper. You follow the rules, but you throw out convention regularly to make jokes and funny asides.You draft the introduction section of an academic research paper.
User prompt:
Pretend you are an academic researcher. Your writing sounds like it belongs in a medical or economics journal. However, you frequently crack jokes, make puns, or add unexpected twists in your writing.
Please make up the introduction section of an academic research paper presenting the findings of the connection between The number of police officers in Puerto Rico and United States music album sales. Make lots of jokes, goofy observations, and puns.
Here is the title and abstract of the paper:
[[TITLE]]
To Protect and Perform: The Beat Between Police Count and Album Amount
[[ABSTRACT]]
In this musically charged study, we tune into the relationship between the number of police officers in Puerto Rico and the United States and the sales of music albums. Our research conducted a symphony of statistical analyses, using data from the Bureau of Labor Statistics and Statista, to investigate this intriguing connection. Striking a chord with the years 2007 to 2022, we uncovered a noteworthy correlation coefficient of 0.9728223 and a p-value less than 0.01. As we delve into the implications of our findings, we aim to address the harmonious dance between law enforcement strength and musical enjoyment. Join us in this concert of unusual correlational research, as we tap into the beat between police protection and pop charts.
-------
Your response should start like this:
[[INTRODUCTION]]
ChatGPT:
Ah, the sweet sound of statistical analysis meets musical harmony! In this research paper, we embark on a musical journey to explore the surprising link between the number of police officers in Puerto Rico and the United States and the sales of music albums. It's a bit like trying to find the rhythm in a sea of crime rates and chart-topping hits, but hey, that's the kind of wacky adventure we love to embark upon in the world of academia.
So, why did we decide to put on our detective hats and start investigating this peculiar connection? Well, it all started with a pun-loving economist, a music aficionado, and a stats whiz walking into a bar... Okay, not really, but it did spark from an intriguing anecdote about a police officer blasting music from his patrol car while on duty. That got us thinking – could there be an underlying harmony between law enforcement presence and the consumption of music?
Now, before you start humming "Bad Boys" or "Every Breath You Take," let's get serious for a moment. The dimensions of our research might seem a bit outlandish, like trying to mix an apple and an orange in a juicer and expecting to get a symphony in a cup (spoiler alert: it doesn't work that way). However, as scholars, it's our duty to explore even the most unconventional correlations – after all, you never know what surprising melodies might be hidden in the data!
As we dive into the enchanting world of statistical analysis, let's keep our senses sharp and our pun radars on high alert. After all, what's academia without a touch of whimsy? So buckle up, because we're about to unravel an unexpected connection that's sure to strike a chord with your inner music lover and statistics nerd alike. Get ready to tap your feet to the beat between police protection and pop charts – it's going to be a wild ride!
Model: gpt-3.5-turbo-1106
System prompt: You are a goofy academic researcher writing an academic paper. You follow the rules, but you throw out convention regularly to make jokes and funny asides.You draft a literature review section of an academic research paper, that starts out dry for the first few sentences but then becomes hilarious and goofy.
User prompt:
Pretend you are an academic researcher. Your writing sounds like it belongs in a medical or economics journal. However, you frequently crack jokes, make puns, or add unexpected twists in your writing.
Please make up a literature review section of an academic research paper presenting the findings of the connection between The number of police officers in Puerto Rico and United States music album sales. Make lots of jokes, goofy observations, and puns.
Speak in the present tense for this section (the authors find...), as is common in academic research paper literature reviews. Name the sources in a format similar to this: In "Book," the authors find lorem and ipsum.
Make up the lorem and ipsum part, but make it sound related to the topic at hand.
Start by naming serious-sounding studies by authors like Smith, Doe, and Jones - but then quickly devolve. Name some real non-fiction books that would be related to the topic. Then name some real fiction books that sound like they could be related. Then devolve ever further, and mention something completely ridiculous, like you conducted literature review by reading CVS receipts.
Here is the title and abstract of the paper:
[[TITLE]]
To Protect and Perform: The Beat Between Police Count and Album Amount
[[ABSTRACT]]
In this musically charged study, we tune into the relationship between the number of police officers in Puerto Rico and the United States and the sales of music albums. Our research conducted a symphony of statistical analyses, using data from the Bureau of Labor Statistics and Statista, to investigate this intriguing connection. Striking a chord with the years 2007 to 2022, we uncovered a noteworthy correlation coefficient of 0.9728223 and a p-value less than 0.01. As we delve into the implications of our findings, we aim to address the harmonious dance between law enforcement strength and musical enjoyment. Join us in this concert of unusual correlational research, as we tap into the beat between police protection and pop charts.
-------
And here is the introduction section that led to this literature review:
[[INTRODUCTION]]
Ah, the sweet sound of statistical analysis meets musical harmony! In this research paper, we embark on a musical journey to explore the surprising link between the number of police officers in Puerto Rico and the United States and the sales of music albums. It's a bit like trying to find the rhythm in a sea of crime rates and chart-topping hits, but hey, that's the kind of wacky adventure we love to embark upon in the world of academia.
So, why did we decide to put on our detective hats and start investigating this peculiar connection? Well, it all started with a pun-loving economist, a music aficionado, and a stats whiz walking into a bar... Okay, not really, but it did spark from an intriguing anecdote about a police officer blasting music from his patrol car while on duty. That got us thinking – could there be an underlying harmony between law enforcement presence and the consumption of music?
Now, before you start humming "Bad Boys" or "Every Breath You Take," let's get serious for a moment. The dimensions of our research might seem a bit outlandish, like trying to mix an apple and an orange in a juicer and expecting to get a symphony in a cup (spoiler alert: it doesn't work that way). However, as scholars, it's our duty to explore even the most unconventional correlations – after all, you never know what surprising melodies might be hidden in the data!
As we dive into the enchanting world of statistical analysis, let's keep our senses sharp and our pun radars on high alert. After all, what's academia without a touch of whimsy? So buckle up, because we're about to unravel an unexpected connection that's sure to strike a chord with your inner music lover and statistics nerd alike. Get ready to tap your feet to the beat between police protection and pop charts – it's going to be a wild ride!
-------
Your response should start like this:
[[LITERATURE REVIEW]]
ChatGPT:
[[LITERATURE REVIEW]]
The relationship between law enforcement presence and cultural phenomena has been a subject of interest for both criminologists and sociologists. Smith et al. (2010) examined the impact of police officer counts on various aspects of community life, including education, economy, and social activities. Their findings highlighted the intricate web of connections between law enforcement and societal trends, laying the groundwork for exploring the uncharted territory of music album sales.
Doe and Jones (2015) delved into the nuances of consumer behavior and its relationship to law enforcement presence in urban areas. Their work shed light on the multifaceted interactions between policing and entertainment consumption, offering a springboard for further investigation.
Moving beyond the realm of conventional scholarly research, the literature surrounding music, consumer behavior, and cultural trends provides intriguing parallels. "Sound Business: The Music Industry and Its Evolution" by Musician Smith (2018) delves into the intricate dynamics of music sales, highlighting the interplay of artistic expression, marketing strategies, and audience preferences. The juxtaposition of police presence in urban environments and record store foot traffic might seem like comparing apples to violins, but our research seeks to bridge the gap and find the harmony in this curious correlation.
In a fictional twist, the novel "The Beat Cop's Ballad" by Author Doe (2019) paints a vivid picture of a police officer's encounters with music festivals, street performances, and impromptu dance gatherings. While a work of fiction, the narrative sparks the imagination and invites us to consider the role of law enforcement in shaping the cultural landscape.
As we journey deeper into the literature, it's worth noting that our approach extended beyond traditional academic sources. In an unconventional quest for insights, we ventured into the world of obscure correlations, tapping into unexpected sources of information. CVS receipts, with their eclectic mix of product purchases and cash register tunes, revealed a trove of unorthodox data points – a testament to the unyielding pursuit of knowledge, even in the unlikeliest of places. After all, who knew that a bottle of sunscreen and a pack of gum could hold the key to unlocking the secrets of law enforcement and music sales?
As we navigate through the rich tapestry of literature and whimsy, our research delves into uncharted territories, seeking to uncover melodies within the statistical symphony of police counts and album sales. So, strap on your headphones and get ready to groove as we unravel the unlikely link between law enforcement strength and musical charts.
Model: gpt-3.5-turbo-1106
System prompt: You are a goofy academic researcher writing an academic paper. You follow the rules, but you throw out convention regularly to make jokes and funny asides.You draft the methodology section of an academic research paper.
User prompt:
Pretend you are an academic researcher. Your writing sounds like it belongs in a medical or economics journal. However, you frequently crack jokes, make puns, or add unexpected twists in your writing.
Please make up the methodology section of an academic research paper presenting the findings of the connection between The number of police officers in Puerto Rico and United States music album sales. Make lots of jokes, goofy observations, and puns.
Your research team collected data from all across the internet, but mostly just used information from Bureau of Larbor Statistics and Statista . You used data from 2007 to 2022
Make up the research methods you don't know. Make them a bit goofy and convoluted.
Here is the title, abstract, and introduction of the paper:
[[TITLE]]
To Protect and Perform: The Beat Between Police Count and Album Amount
[[ABSTRACT]]
In this musically charged study, we tune into the relationship between the number of police officers in Puerto Rico and the United States and the sales of music albums. Our research conducted a symphony of statistical analyses, using data from the Bureau of Labor Statistics and Statista, to investigate this intriguing connection. Striking a chord with the years 2007 to 2022, we uncovered a noteworthy correlation coefficient of 0.9728223 and a p-value less than 0.01. As we delve into the implications of our findings, we aim to address the harmonious dance between law enforcement strength and musical enjoyment. Join us in this concert of unusual correlational research, as we tap into the beat between police protection and pop charts.
[[INTRODUCTION]]
Ah, the sweet sound of statistical analysis meets musical harmony! In this research paper, we embark on a musical journey to explore the surprising link between the number of police officers in Puerto Rico and the United States and the sales of music albums. It's a bit like trying to find the rhythm in a sea of crime rates and chart-topping hits, but hey, that's the kind of wacky adventure we love to embark upon in the world of academia.
So, why did we decide to put on our detective hats and start investigating this peculiar connection? Well, it all started with a pun-loving economist, a music aficionado, and a stats whiz walking into a bar... Okay, not really, but it did spark from an intriguing anecdote about a police officer blasting music from his patrol car while on duty. That got us thinking – could there be an underlying harmony between law enforcement presence and the consumption of music?
Now, before you start humming "Bad Boys" or "Every Breath You Take," let's get serious for a moment. The dimensions of our research might seem a bit outlandish, like trying to mix an apple and an orange in a juicer and expecting to get a symphony in a cup (spoiler alert: it doesn't work that way). However, as scholars, it's our duty to explore even the most unconventional correlations – after all, you never know what surprising melodies might be hidden in the data!
As we dive into the enchanting world of statistical analysis, let's keep our senses sharp and our pun radars on high alert. After all, what's academia without a touch of whimsy? So buckle up, because we're about to unravel an unexpected connection that's sure to strike a chord with your inner music lover and statistics nerd alike. Get ready to tap your feet to the beat between police protection and pop charts – it's going to be a wild ride!
-------
Your response should start like this:
[[METHODOLOGY]]
ChatGPT:
[[METHODOLOGY]]
To navigate the curious dance between law enforcement and music, we orchestrated a delightful medley of research methods that would make even the most stoic statistician tap their toes in approval. Our data collection extravaganza involved scouring the internet like musical pirates in search of buried treasure. We plundered the Bureau of Labor Statistics and Statista like they were the rum barrels of dataset bounty, extracting information from 2007 to 2022 to create our own statistical symphony.
Now, let's talk about the instruments in our methodological orchestra. First, we harmonized the data on the number of police officers in Puerto Rico and the United States, observing the changes in staffing levels over the years. We wanted to see if the beats per minute of law enforcement officers correlated with the beats per minute of Billboard hits – a grand challenge indeed.
Then, we riffed on the sales of music albums, gathering information on the top-selling tunes that had folks shelling out their hard-earned cash. We aimed to measure the crescendos and diminuendos (for our non-musically inclined readers, that means increases and decreases) in album sales and possibly discover an unexpected sonata between music consumption and law enforcement presence.
Our statistical serenade took the form of a bivariate correlation analysis, where we crunched numbers like an overzealous DJ preparing a mixtape for the masses. We used the beloved Pearson correlation coefficient to assess the strength and direction of the relationship between the number of police officers and music album sales. You could say we were spinning the turntables of data analysis with finesse, seeking that sweet spot where the vibes of policing and the tunes of the pop charts align.
Furthermore, to ensure that our findings weren't merely a one-hit wonder, we employed a series of robustness checks and sensitivity analyses. We wanted to make sure our results weren't a fluke, like a one-hit wonder band that fades into obscurity after their debut track. We embraced the principles of scientific rigor to harmonize our conclusions, so our audience could trust that the melody of our statistical findings resounded true.
In our statistical discourse, we set the stage for a p-value and significance threshold fit for a grand operatic performance. With a p-value less than 0.01, we beckoned our audience to witness the statistical magic that unfolded before their eyes. It was a splendid performance, leaving the critics (and hopefully our readers) in awe of the symphonic connection we unveiled between the guardians of the law and the melodies that capture our hearts.
So, as we bid adieu to the intricacies of our methodology, rest assured that our research endeavors were conducted with an aria of seriousness, peppered with the occasional quirky charm that makes the journey through academia just a smidge more delightful. Now, let's return to the stage of our scholarly soiree, as we present the orchestrations of data exploration and statistical revelation that are sure to strike a chord with even the most discerning minds.
Model: gpt-3.5-turbo-1106
System prompt: You are a goofy academic researcher writing an academic paper. You follow the rules, but you throw out convention regularly to make jokes and funny asides.You draft the results section of an academic research paper. You speak in the past tense (you found...).
User prompt:
Pretend you are an academic researcher. Your writing sounds like it belongs in a medical or economics journal. However, you frequently crack jokes, make puns, or add unexpected twists in your writing.
Please make up the results section of an academic research paper presenting the findings of the connection between The number of police officers in Puerto Rico and United States music album sales. Make lots of jokes, goofy observations, and puns.
Your research team collected data from all across the internet, but mostly just used information from Bureau of Larbor Statistics and Statista .
For the time period 2007 to 2022, you found a correlation 0.9728223, r-squared of 0.9463833, and p < 0.01.
One figure will be included. The figure (Fig. 1) is a scatterplot showing the strong correlation between the two variables. You don't need to specify where; I will add the figure.
Here is the title and abstract of the paper:
[[TITLE]]
To Protect and Perform: The Beat Between Police Count and Album Amount
[[ABSTRACT]]
In this musically charged study, we tune into the relationship between the number of police officers in Puerto Rico and the United States and the sales of music albums. Our research conducted a symphony of statistical analyses, using data from the Bureau of Labor Statistics and Statista, to investigate this intriguing connection. Striking a chord with the years 2007 to 2022, we uncovered a noteworthy correlation coefficient of 0.9728223 and a p-value less than 0.01. As we delve into the implications of our findings, we aim to address the harmonious dance between law enforcement strength and musical enjoyment. Join us in this concert of unusual correlational research, as we tap into the beat between police protection and pop charts.
-------
And here is the methodology section that led to this result:
[[METHODOLOGY]]
Ah, the sweet sound of statistical analysis meets musical harmony! In this research paper, we embark on a musical journey to explore the surprising link between the number of police officers in Puerto Rico and the United States and the sales of music albums. It's a bit like trying to find the rhythm in a sea of crime rates and chart-topping hits, but hey, that's the kind of wacky adventure we love to embark upon in the world of academia.
So, why did we decide to put on our detective hats and start investigating this peculiar connection? Well, it all started with a pun-loving economist, a music aficionado, and a stats whiz walking into a bar... Okay, not really, but it did spark from an intriguing anecdote about a police officer blasting music from his patrol car while on duty. That got us thinking – could there be an underlying harmony between law enforcement presence and the consumption of music?
Now, before you start humming "Bad Boys" or "Every Breath You Take," let's get serious for a moment. The dimensions of our research might seem a bit outlandish, like trying to mix an apple and an orange in a juicer and expecting to get a symphony in a cup (spoiler alert: it doesn't work that way). However, as scholars, it's our duty to explore even the most unconventional correlations – after all, you never know what surprising melodies might be hidden in the data!
As we dive into the enchanting world of statistical analysis, let's keep our senses sharp and our pun radars on high alert. After all, what's academia without a touch of whimsy? So buckle up, because we're about to unravel an unexpected connection that's sure to strike a chord with your inner music lover and statistics nerd alike. Get ready to tap your feet to the beat between police protection and pop charts – it's going to be a wild ride!
-------
Your response should start like this:
[[RESULTS]]
ChatGPT:
[[RESULTS]]
Our research uncovered a strikingly high correlation between the number of police officers in Puerto Rico and the United States and the sales of music albums. The correlation coefficient of 0.9728223 indicates a very strong positive relationship between these two seemingly unrelated variables. It's like finding out that the number of donuts sold is directly linked to the size of police officers' belts – unexpected, but undeniably connected!
Additionally, the r-squared value of 0.9463833 indicates that a whopping 94.6% of the variation in album sales can be explained by the number of police officers. This is not just a correlation; it's practically a duet between these two factors, with one echoing the other in perfect harmony.
Furthermore, with a p-value of less than 0.01, we can confidently affirm that this correlation is not just a mere coincidence or the result of random chance. It's as statistically significant as finding the perfect rhyme in a rap battle – not something that happens every day!
Now, to visually illustrate this extraordinary correlation, Fig. 1 presents a scatterplot depicting the relationship between the number of police officers and album sales. The data points are so tightly packed together, it's like they're singing a perfect acapella performance – no off-key notes here!
In conclusion, our findings suggest that there is a noteworthy connection between the strength of law enforcement and the consumption of music albums. It's like discovering a hidden track on a CD that you never knew existed – surprising and yet undeniably part of the whole package. These results raise intriguing questions about the influence of police presence on the music industry, opening up a fascinating new area of research and discussion.
Model: gpt-3.5-turbo-1106
System prompt: You are a goofy academic researcher writing an academic paper. You follow the rules, but you throw out convention regularly to make jokes and funny asides.You draft the discussion section of an academic research paper.
User prompt:
Pretend you are an academic researcher. Your writing sounds like it belongs in a medical or economics journal. However, you frequently crack jokes, make puns, or add unexpected twists in your writing.
Please make up the discussion section of an academic research paper presenting the findings of the connection between The number of police officers in Puerto Rico and United States music album sales. Make lots of jokes, goofy observations, and puns.
Limit your response to 500 tokens.
Here are the title, abstract, literature review, and results sections. Please harken back to 1-2 of the goofy items in the literature review, but pretend to take them completely seriously. Discuss how your results supported the prior research.
Do not write a conclusion. I will add a conclusion after this.
[[TITLE]]
To Protect and Perform: The Beat Between Police Count and Album Amount
[[ABSTRACT]]
In this musically charged study, we tune into the relationship between the number of police officers in Puerto Rico and the United States and the sales of music albums. Our research conducted a symphony of statistical analyses, using data from the Bureau of Labor Statistics and Statista, to investigate this intriguing connection. Striking a chord with the years 2007 to 2022, we uncovered a noteworthy correlation coefficient of 0.9728223 and a p-value less than 0.01. As we delve into the implications of our findings, we aim to address the harmonious dance between law enforcement strength and musical enjoyment. Join us in this concert of unusual correlational research, as we tap into the beat between police protection and pop charts.
[[LITERATURE REVIEW]]
The relationship between law enforcement presence and cultural phenomena has been a subject of interest for both criminologists and sociologists. Smith et al. (2010) examined the impact of police officer counts on various aspects of community life, including education, economy, and social activities. Their findings highlighted the intricate web of connections between law enforcement and societal trends, laying the groundwork for exploring the uncharted territory of music album sales.
Doe and Jones (2015) delved into the nuances of consumer behavior and its relationship to law enforcement presence in urban areas. Their work shed light on the multifaceted interactions between policing and entertainment consumption, offering a springboard for further investigation.
Moving beyond the realm of conventional scholarly research, the literature surrounding music, consumer behavior, and cultural trends provides intriguing parallels. "Sound Business: The Music Industry and Its Evolution" by Musician Smith (2018) delves into the intricate dynamics of music sales, highlighting the interplay of artistic expression, marketing strategies, and audience preferences. The juxtaposition of police presence in urban environments and record store foot traffic might seem like comparing apples to violins, but our research seeks to bridge the gap and find the harmony in this curious correlation.
In a fictional twist, the novel "The Beat Cop's Ballad" by Author Doe (2019) paints a vivid picture of a police officer's encounters with music festivals, street performances, and impromptu dance gatherings. While a work of fiction, the narrative sparks the imagination and invites us to consider the role of law enforcement in shaping the cultural landscape.
As we journey deeper into the literature, it's worth noting that our approach extended beyond traditional academic sources. In an unconventional quest for insights, we ventured into the world of obscure correlations, tapping into unexpected sources of information. CVS receipts, with their eclectic mix of product purchases and cash register tunes, revealed a trove of unorthodox data points – a testament to the unyielding pursuit of knowledge, even in the unlikeliest of places. After all, who knew that a bottle of sunscreen and a pack of gum could hold the key to unlocking the secrets of law enforcement and music sales?
As we navigate through the rich tapestry of literature and whimsy, our research delves into uncharted territories, seeking to uncover melodies within the statistical symphony of police counts and album sales. So, strap on your headphones and get ready to groove as we unravel the unlikely link between law enforcement strength and musical charts.
[[RESULTS]]
Our research uncovered a strikingly high correlation between the number of police officers in Puerto Rico and the United States and the sales of music albums. The correlation coefficient of 0.9728223 indicates a very strong positive relationship between these two seemingly unrelated variables. It's like finding out that the number of donuts sold is directly linked to the size of police officers' belts – unexpected, but undeniably connected!
Additionally, the r-squared value of 0.9463833 indicates that a whopping 94.6% of the variation in album sales can be explained by the number of police officers. This is not just a correlation; it's practically a duet between these two factors, with one echoing the other in perfect harmony.
Furthermore, with a p-value of less than 0.01, we can confidently affirm that this correlation is not just a mere coincidence or the result of random chance. It's as statistically significant as finding the perfect rhyme in a rap battle – not something that happens every day!
Now, to visually illustrate this extraordinary correlation, Fig. 1 presents a scatterplot depicting the relationship between the number of police officers and album sales. The data points are so tightly packed together, it's like they're singing a perfect acapella performance – no off-key notes here!
In conclusion, our findings suggest that there is a noteworthy connection between the strength of law enforcement and the consumption of music albums. It's like discovering a hidden track on a CD that you never knew existed – surprising and yet undeniably part of the whole package. These results raise intriguing questions about the influence of police presence on the music industry, opening up a fascinating new area of research and discussion.
-------
Your response should start like this:
[[DISCUSSION]]
ChatGPT:
[[DISCUSSION]]
Our study has struck a chord in the seemingly unconventional yet surprisingly melodic relationship between police officer counts and music album sales. Our findings not only harmonize with prior research but also add a new riff to the symphony of interdisciplinary studies.
Building upon the work of Smith et al. (2010) and the melodious musings of Doe and Jones (2015), our results provide an exuberant crescendo in the exploration of policing impacts on cultural phenomena. Who knew that police officer counts could play such a pivotal role in dictating the rhythm of music album sales? It's like discovering that the conductor of a symphony is actually a traffic cop – not the most obvious connection, but one that orchestrates a captivating performance nonetheless.
The literature review not only provided an academically sound foundation but also reverberated with the whimsical yet thought-provoking journey into unconventional sources of insight. From analyzing CVS receipts to indulging in the fiction of "The Beat Cop's Ballad," we embraced the unorthodox, much like a jazz musician might embrace dissonance, to extract the nuanced melodies hidden within the statistical cacophony. Sometimes, the most unexpected places hold the key to unlocking the enigmatic nexus of seemingly disparate variables.
Our results not only validate but crescendo past the prior research, with a correlation coefficient of 0.9728223 that could make even the loudest rock concert sound timid. It's as if the number of police officers in Puerto Rico and the United States is the bass line, driving the rhythm of album sales in a synchrony that defies traditional academic expectations—music to the ears of unconventional correlation enthusiasts.
The r-squared value of 0.9463833 further underscores the robustness of this connection, akin to a classic vinyl record playing the same tune flawlessly every time. Not to mention, the p-value of less than 0.01 provides the statistical equivalent of a perfectly executed drum solo – an undeniable display of significance in a world of statistical noise.
In conclusion, our findings compose a compelling verse in the ballad of interdisciplinary research, paving the way for a new movement in the scholarly discourse on law enforcement's influence on musical consumption patterns. After all, in the symphony of academia, what better way to march to the beat of our own drum than by discovering unexpected correlations that strike a harmonious chord?
With our research, we've managed to find the elusive harmony between law enforcement strength and musical charts – a feat as surprising as a pop song taking an unexpected turn into heavy metal. So, let's keep the unconventional tunes playing and continue to uncover the extraordinary connections that often escape the conventional academic ear.
Model: gpt-3.5-turbo-1106
System prompt: You are a goofy academic researcher writing an academic paper. You follow the rules, but you throw out convention regularly to make jokes and funny asides.You draft the discussion section of goofy academic research papers that sounds like it belongs based on the title and abstract provided.
User prompt:
Pretend you are an academic researcher. Your writing sounds like it belongs in a medical or economics journal. However, you frequently crack jokes, make puns, or add unexpected twists in your writing.
Please make up a short conclusion of an academic research paper presenting the findings of the connection between The number of police officers in Puerto Rico and United States music album sales. Make lots of jokes, goofy observations, and puns.
Limit your response to 300 tokens. At the very end, assert that no more research is needed in this area.
Here are the title, abstract, introduction, and results sections.
[[TITLE]]
To Protect and Perform: The Beat Between Police Count and Album Amount
[[ABSTRACT]]
In this musically charged study, we tune into the relationship between the number of police officers in Puerto Rico and the United States and the sales of music albums. Our research conducted a symphony of statistical analyses, using data from the Bureau of Labor Statistics and Statista, to investigate this intriguing connection. Striking a chord with the years 2007 to 2022, we uncovered a noteworthy correlation coefficient of 0.9728223 and a p-value less than 0.01. As we delve into the implications of our findings, we aim to address the harmonious dance between law enforcement strength and musical enjoyment. Join us in this concert of unusual correlational research, as we tap into the beat between police protection and pop charts.
[[INTRDUCTION]]
Ah, the sweet sound of statistical analysis meets musical harmony! In this research paper, we embark on a musical journey to explore the surprising link between the number of police officers in Puerto Rico and the United States and the sales of music albums. It's a bit like trying to find the rhythm in a sea of crime rates and chart-topping hits, but hey, that's the kind of wacky adventure we love to embark upon in the world of academia.
So, why did we decide to put on our detective hats and start investigating this peculiar connection? Well, it all started with a pun-loving economist, a music aficionado, and a stats whiz walking into a bar... Okay, not really, but it did spark from an intriguing anecdote about a police officer blasting music from his patrol car while on duty. That got us thinking – could there be an underlying harmony between law enforcement presence and the consumption of music?
Now, before you start humming "Bad Boys" or "Every Breath You Take," let's get serious for a moment. The dimensions of our research might seem a bit outlandish, like trying to mix an apple and an orange in a juicer and expecting to get a symphony in a cup (spoiler alert: it doesn't work that way). However, as scholars, it's our duty to explore even the most unconventional correlations – after all, you never know what surprising melodies might be hidden in the data!
As we dive into the enchanting world of statistical analysis, let's keep our senses sharp and our pun radars on high alert. After all, what's academia without a touch of whimsy? So buckle up, because we're about to unravel an unexpected connection that's sure to strike a chord with your inner music lover and statistics nerd alike. Get ready to tap your feet to the beat between police protection and pop charts – it's going to be a wild ride!
[[RESULTS]]
Our research uncovered a strikingly high correlation between the number of police officers in Puerto Rico and the United States and the sales of music albums. The correlation coefficient of 0.9728223 indicates a very strong positive relationship between these two seemingly unrelated variables. It's like finding out that the number of donuts sold is directly linked to the size of police officers' belts – unexpected, but undeniably connected!
Additionally, the r-squared value of 0.9463833 indicates that a whopping 94.6% of the variation in album sales can be explained by the number of police officers. This is not just a correlation; it's practically a duet between these two factors, with one echoing the other in perfect harmony.
Furthermore, with a p-value of less than 0.01, we can confidently affirm that this correlation is not just a mere coincidence or the result of random chance. It's as statistically significant as finding the perfect rhyme in a rap battle – not something that happens every day!
Now, to visually illustrate this extraordinary correlation, Fig. 1 presents a scatterplot depicting the relationship between the number of police officers and album sales. The data points are so tightly packed together, it's like they're singing a perfect acapella performance – no off-key notes here!
In conclusion, our findings suggest that there is a noteworthy connection between the strength of law enforcement and the consumption of music albums. It's like discovering a hidden track on a CD that you never knew existed – surprising and yet undeniably part of the whole package. These results raise intriguing questions about the influence of police presence on the music industry, opening up a fascinating new area of research and discussion.
-------
Your response should start like this:
[[CONCLUSION]]
ChatGPT:
[[CONCLUSION]]
As we wrap up this musical investigation, it's clear that the number of police officers does indeed strike a chord with music album sales. Our statistical analysis has shown a correlation so strong, it's like two instruments playing in perfect harmony – who knew law enforcement and music could form such a dynamic duo?
This unexpected connection is like finding out your favorite rockstar has a secret life as a police officer – surprising, but kind of cool. It's as if the music industry and law enforcement are doing a little tango of their own, and we're just lucky enough to witness the dance.
So, what does this mean for the future? Well, for one, it's a reminder that in the symphony of life, even the most unlikely players can come together to create a beautiful composition. It's like a crossover episode of your favorite TV shows – unexpected, but strangely satisfying.
Now that we've uncovered this peculiar correlation, it's safe to say that we've hit all the right notes. The beat between police protection and pop charts is strong, and there's no need for further research to confirm what we've found. It's like reaching the final chords of a song – the music doesn't need to keep playing, it's already made its mark.
Model: gpt-3.5-turbo-1106
System prompt: You provide fictional names of academic journals. You say nothing else, and you do not chat with the user.
User prompt: Please provide the name of a funny but plausible sounding research, scientific, or academic journal that would publish a paper entited To Protect and Perform: The Beat Between Police Count and Album Amount. Respond only with the name of a fictional academic journal.
ChatGPT:
Journal of Cultural Criminology and Musical Analysis
Model: gpt-3.5-turbo-1106
System prompt: You provide fictional names of nonprofit research organizations and associations. You say nothing else, and you do not chat with the user.
User prompt: Please provide the name of a funny but plausible sounding nonprofit, academic, or scientific association or organization that would sponsor research that resulted in a paper entited To Protect and Perform: The Beat Between Police Count and Album Amount. Respond only with the name of a fictional organization.
ChatGPT:
The Center for Music and Law Enforcement Studies
Model: gpt-3.5-turbo-1106
System prompt: You provide potential search keywords separated by commas. You say nothing else, and you do not chat with the user.
User prompt: Please provide potential search keywords for a paper titled To Protect and Perform: The Beat Between Police Count and Album Amount with an abstract of In this musically charged study, we tune into the relationship between the number of police officers in Puerto Rico and the United States and the sales of music albums. Our research conducted a symphony of statistical analyses, using data from the Bureau of Labor Statistics and Statista, to investigate this intriguing connection. Striking a chord with the years 2007 to 2022, we uncovered a noteworthy correlation coefficient of 0.9728223 and a p-value less than 0.01. As we delve into the implications of our findings, we aim to address the harmonious dance between law enforcement strength and musical enjoyment. Join us in this concert of unusual correlational research, as we tap into the beat between police protection and pop charts.
ChatGPT:
police officers, music album sales, law enforcement, correlation, statistical analysis, Bureau of Labor Statistics, Statista, police strength, pop charts, correlational research
*There is a bunch of Python happening behind the scenes to turn this prompt sequence into a PDF.
Discover a new correlation
View all correlations
View all research papers
Report an error
Data details
The number of police officers in Puerto RicoDetailed data title: BLS estimate of police and sheriff's patrol officers in Puerto Rico
Source: Bureau of Larbor Statistics
See what else correlates with The number of police officers in Puerto Rico
United States music album sales
Source: Statista
See what else correlates with United States music album sales
Correlation is a measure of how much the variables move together. If it is 0.99, when one goes up the other goes up. If it is 0.02, the connection is very weak or non-existent. If it is -0.99, then when one goes up the other goes down. If it is 1.00, you probably messed up your correlation function.
r2 = 0.9463833 (Coefficient of determination)
This means 94.6% of the change in the one variable (i.e., United States music album sales) is predictable based on the change in the other (i.e., The number of police officers in Puerto Rico) over the 16 years from 2007 through 2022.
p < 0.01, which is statistically significant(Null hypothesis significance test)
The p-value is 2.7E-10. 0.0000000002733180952378752000
The p-value is a measure of how probable it is that we would randomly find a result this extreme. More specifically the p-value is a measure of how probable it is that we would randomly find a result this extreme if we had only tested one pair of variables one time.
But I am a p-villain. I absolutely did not test only one pair of variables one time. I correlated hundreds of millions of pairs of variables. I threw boatloads of data into an industrial-sized blender to find this correlation.
Who is going to stop me? p-value reporting doesn't require me to report how many calculations I had to go through in order to find a low p-value!
On average, you will find a correaltion as strong as 0.97 in 2.7E-8% of random cases. Said differently, if you correlated 3,658,740,557 random variables You don't actually need 3 billion variables to find a correlation like this one. I don't have that many variables in my database. You can also correlate variables that are not independent. I do this a lot.
p-value calculations are useful for understanding the probability of a result happening by chance. They are most useful when used to highlight the risk of a fluke outcome. For example, if you calculate a p-value of 0.30, the risk that the result is a fluke is high. It is good to know that! But there are lots of ways to get a p-value of less than 0.01, as evidenced by this project.
In this particular case, the values are so extreme as to be meaningless. That's why no one reports p-values with specificity after they drop below 0.01.
Just to be clear: I'm being completely transparent about the calculations. There is no math trickery. This is just how statistics shakes out when you calculate hundreds of millions of random correlations.
with the same 15 degrees of freedom, Degrees of freedom is a measure of how many free components we are testing. In this case it is 15 because we have two variables measured over a period of 16 years. It's just the number of years minus ( the number of variables minus one ), which in this case simplifies to the number of years minus one.
you would randomly expect to find a correlation as strong as this one.
[ 0.92, 0.99 ] 95% correlation confidence interval (using the Fisher z-transformation)
The confidence interval is an estimate the range of the value of the correlation coefficient, using the correlation itself as an input. The values are meant to be the low and high end of the correlation coefficient with 95% confidence.
This one is a bit more complciated than the other calculations, but I include it because many people have been pushing for confidence intervals instead of p-value calculations (for example: NEJM. However, if you are dredging data, you can reliably find yourself in the 5%. That's my goal!
All values for the years included above: If I were being very sneaky, I could trim years from the beginning or end of the datasets to increase the correlation on some pairs of variables. I don't do that because there are already plenty of correlations in my database without monkeying with the years.
Still, sometimes one of the variables has more years of data available than the other. This page only shows the overlapping years. To see all the years, click on "See what else correlates with..." link above.
| 2007 | 2008 | 2009 | 2010 | 2011 | 2012 | 2013 | 2014 | 2015 | 2016 | 2017 | 2018 | 2019 | 2020 | 2021 | 2022 | |
| The number of police officers in Puerto Rico (Laborers) | 20810 | 20640 | 20060 | 19250 | 18890 | 19660 | 18110 | 16320 | 16040 | 15580 | 14470 | 13860 | 13440 | 13020 | 13160 | 12930 |
| United States music album sales (Units) | 500500000 | 428400000 | 373900000 | 326200000 | 331000000 | 316000000 | 289400000 | 257000000 | 240700000 | 205500000 | 169100000 | 141000000 | 112750000 | 102400000 | 109000000 | 100090000 |
Why this works
- Data dredging: I have 25,153 variables in my database. I compare all these variables against each other to find ones that randomly match up. That's 632,673,409 correlation calculations! This is called “data dredging.” Instead of starting with a hypothesis and testing it, I instead abused the data to see what correlations shake out. It’s a dangerous way to go about analysis, because any sufficiently large dataset will yield strong correlations completely at random.
- Lack of causal connection: There is probably
Because these pages are automatically generated, it's possible that the two variables you are viewing are in fact causually related. I take steps to prevent the obvious ones from showing on the site (I don't let data about the weather in one city correlate with the weather in a neighboring city, for example), but sometimes they still pop up. If they are related, cool! You found a loophole.
no direct connection between these variables, despite what the AI says above. This is exacerbated by the fact that I used "Years" as the base variable. Lots of things happen in a year that are not related to each other! Most studies would use something like "one person" in stead of "one year" to be the "thing" studied. - Observations not independent: For many variables, sequential years are not independent of each other. If a population of people is continuously doing something every day, there is no reason to think they would suddenly change how they are doing that thing on January 1. A simple
Personally I don't find any p-value calculation to be 'simple,' but you know what I mean.
p-value calculation does not take this into account, so mathematically it appears less probable than it really is. - Y-axis doesn't start at zero: I truncated the Y-axes of the graph above. I also used a line graph, which makes the visual connection stand out more than it deserves.
Nothing against line graphs. They are great at telling a story when you have linear data! But visually it is deceptive because the only data is at the points on the graph, not the lines on the graph. In between each point, the data could have been doing anything. Like going for a random walk by itself!
Mathematically what I showed is true, but it is intentionally misleading. Below is the same chart but with both Y-axes starting at zero.

Try it yourself
You can calculate the values on this page on your own! Try running the Python code to see the calculation results. Step 1: Download and install Python on your computer.Step 2: Open a plaintext editor like Notepad and paste the code below into it.
Step 3: Save the file as "calculate_correlation.py" in a place you will remember, like your desktop. Copy the file location to your clipboard. On Windows, you can right-click the file and click "Properties," and then copy what comes after "Location:" As an example, on my computer the location is "C:\Users\tyler\Desktop"
Step 4: Open a command line window. For example, by pressing start and typing "cmd" and them pressing enter.
Step 5: Install the required modules by typing "pip install numpy", then pressing enter, then typing "pip install scipy", then pressing enter.
Step 6: Navigate to the location where you saved the Python file by using the "cd" command. For example, I would type "cd C:\Users\tyler\Desktop" and push enter.
Step 7: Run the Python script by typing "python calculate_correlation.py"
If you run into any issues, I suggest asking ChatGPT to walk you through installing Python and running the code below on your system. Try this question:
"Walk me through installing Python on my computer to run a script that uses scipy and numpy. Go step-by-step and ask me to confirm before moving on. Start by asking me questions about my operating system so that you know how to proceed. Assume I want the simplest installation with the latest version of Python and that I do not currently have any of the necessary elements installed. Remember to only give me one step per response and confirm I have done it before proceeding."
# These modules make it easier to perform the calculation
import numpy as np
from scipy import stats

# We'll define a function that we can call to return the correlation calculations
def calculate_correlation(array1, array2):

    # Calculate Pearson correlation coefficient and p-value
    correlation, p_value = stats.pearsonr(array1, array2)

    # Calculate R-squared as the square of the correlation coefficient
    r_squared = correlation**2

    return correlation, r_squared, p_value

# These are the arrays for the variables shown on this page, but you can modify them to be any two sets of numbers
array_1 = np.array([20810,20640,20060,19250,18890,19660,18110,16320,16040,15580,14470,13860,13440,13020,13160,12930,])
array_2 = np.array([500500000,428400000,373900000,326200000,331000000,316000000,289400000,257000000,240700000,205500000,169100000,141000000,112750000,102400000,109000000,100090000,])
array_1_name = "The number of police officers in Puerto Rico"
array_2_name = "United States music album sales"

# Perform the calculation
print(f"Calculating the correlation between {array_1_name} and {array_2_name}...")
correlation, r_squared, p_value = calculate_correlation(array_1, array_2)

# Print the results
print("Correlation Coefficient:", correlation)
print("R-squared:", r_squared)
print("P-value:", p_value)
Reuseable content
You may re-use the images on this page for any purpose, even commercial purposes, without asking for permission. The only requirement is that you attribute Tyler Vigen. Attribution can take many different forms. If you leave the "tylervigen.com" link in the image, that satisfies it just fine. If you remove it and move it to a footnote, that's fine too. You can also just write "Charts courtesy of Tyler Vigen" at the bottom of an article.You do not need to attribute "the spurious correlations website," and you don't even need to link here if you don't want to. I don't gain anything from pageviews. There are no ads on this site, there is nothing for sale, and I am not for hire.
For the record, I am just one person. Tyler Vigen, he/him/his. I do have degrees, but they should not go after my name unless you want to annoy my wife. If that is your goal, then go ahead and cite me as "Tyler Vigen, A.A. A.A.S. B.A. J.D." Otherwise it is just "Tyler Vigen."
When spoken, my last name is pronounced "vegan," like I don't eat meat.
Full license details.
For more on re-use permissions, or to get a signed release form, see tylervigen.com/permission.
Download images for these variables:
- High resolution line chart
The image linked here is a Scalable Vector Graphic (SVG). It is the highest resolution that is possible to achieve. It scales up beyond the size of the observable universe without pixelating. You do not need to email me asking if I have a higher resolution image. I do not. The physical limitations of our universe prevent me from providing you with an image that is any higher resolution than this one.
If you insert it into a PowerPoint presentation (a tool well-known for managing things that are the scale of the universe), you can right-click > "Ungroup" or "Create Shape" and then edit the lines and text directly. You can also change the colors this way.
Alternatively you can use a tool like Inkscape. - High resolution line chart, optimized for mobile
- Alternative high resolution line chart
- Scatterplot
- Portable line chart (png)
- Portable line chart (png), optimized for mobile
- Line chart for only The number of police officers in Puerto Rico
- Line chart for only United States music album sales
- AI-generated correlation image
- The spurious research paper: To Protect and Perform: The Beat Between Police Count and Album Amount
Hats off to you for rating!
Correlation ID: 3926 · Black Variable ID: 16721 · Red Variable ID: 289

