. The chart goes from 2002 to 2021, and the two variables track closely in value over that time.")
Download png, svg
AI explanation
As butter consumption rose, so did the demand for properties with ample kitchen space, spreading O's success. And that's the butter truth!
Model: dalle-3
Prompt: [ Cutsy art illustration ] Create an inviting scene of a cozy kitchen where a family is seated around the breakfast table. They are happily enjoying slices of warm, golden toast slathered with melting butter. The toaster hums with activity, emitting a warm glow, and the delicious smell of freshly toasted bread fills the air. In the background, subtly display the stock price ticker for Realty Income (O) steadily rising, reflecting the increased demand for their properties due to the expanding use of electricity by toasters. The scene should carry a heartwarming and inviting vibe to reflect the family's breakfast moment. The depiction should include only scenes, people, and objects, it should not include text or speech bubbles.
This image generation prompt was also generated by AI, using the following sequence:
Model: gpt-3.5-turbo-1106
System prompt: You select one of a few potential scene descriptors that seems to go along with the variables described. You respond only with the scene descriptions provided and say nothing else.
User prompt: Here are two variables: Butter consumption and Realty Income's stock price (O). Given these, which of the following image style descriptions seems most appropriate? Pick the one that seems to be related to one of the variables at hand. Please respond with only one of the following potential descriptions: Glitch art Surrealism A Discovery magazine cover image Cutsy art illustration a Polaroid photo
ChatGPT: Cutsy art illustration
Model: gpt-3.5-turbo-1106
System prompt: You describe simple visual scenes that depict the two variables stated. You combine both variables into one scene.
User prompt: Please describe a visual scene that prominently depicts both Butter consumption and Realty Income's stock price (O), in the following situation: Because as butter consumption increases, so does the demand for toast. Toasters often use electricity, increasing the demand for Realty Income's properties, thus boosting their stock price.. Keep the description simple.
ChatGPT: In a cozy kitchen, a family is seated around the breakfast table, enjoying slices of warm, golden toast slathered with melting butter. The toaster hums with activity, and the delicious smell of freshly toasted bread fills the air. Meanwhile, in the background, the stock price ticker for Realty Income (O) steadily rises, reflecting the increased demand for their properties due to the expanding use of electricity by toasters.
Model: gpt-3.5-turbo-1106
System prompt: You write and improve image generation prompts for DALLE-3. You maintain the same subjects, but enhance the visuals.
User prompt: Please respond with an image generation prompt that would be likely to create an interesting visual using DALLE-3, using the following style: [ Cutsy art illustration ] and depicting this scene: In a cozy kitchen, a family is seated around the breakfast table, enjoying slices of warm, golden toast slathered with melting butter. The toaster hums with activity, and the delicious smell of freshly toasted bread fills the air. Meanwhile, in the background, the stock price ticker for Realty Income (O) steadily rises, reflecting the increased demand for their properties due to the expanding use of electricity by toasters. Keep the visual depiction simple. Do not include any words or speech bubbles.
ChatGPT: [ Cutsy art illustration ] Create an inviting scene of a cozy kitchen where a family is seated around the breakfast table. They are happily enjoying slices of warm, golden toast slathered with melting butter. The toaster hums with activity, emitting a warm glow, and the delicious smell of freshly toasted bread fills the air. In the background, subtly display the stock price ticker for Realty Income (O) steadily rising, reflecting the increased demand for their properties due to the expanding use of electricity by toasters. The scene should carry a heartwarming and inviting vibe to reflect the family's breakfast moment.
*Variations in the User Prompts from chart to chart are just the result of random number generation in Python. I wrote a few arrays of various styles and methods to ask questions to change up the results. Every time this site writes an explanation or generates an image, the script picks from each at random.
I sequence the requests into multiple prompts because I find GPT 3.5 to perform much better with short, well-managed contexts. Thus, I track the context directly in Python and only ask ChatGPT targeted questions.
System prompt: You provide humorous responses in the form of plausible sounding explanations for correlations. You assume the correlation is causative for the purpose of the explanation even if it is ridiculous. You do not chat with the user, you only reply with the causal connection explanation and nothing else.
User prompt: Please make up a funny explanation for how an increase in Butter consumption caused Realty Income's stock price (O) to increase. Include one good pun.
AI academic paper
 |
Bizarre Butter: Bizarre Boost or Bumbling Bubble? The Balmy Balance Between Butter Consumption and Realty Income's Royalties Journal of Culinary Economics Jan 2024 Reminder: This paper is AI-generated. Not real! |
Model: gpt-3.5-turbo-1106
System prompt: You are a goofy academic researcher writing an academic paper. You follow the rules, but you throw out convention regularly to make jokes and funny asides.You write titles and abstracts of goofy academic research papers.
User prompt:
Pretend you are an academic researcher. Your writing sounds like it belongs in a medical or economics journal. However, you frequently crack jokes, make puns, and add unexpected twists in your writing.
Please draft the title and abstract of an academic research paper presenting the findings of the connection between Butter consumption and Realty Income's stock price (O). You can't resist a good dad joke. Add a relevant dad joke related to the content every couple of sentences.
Make the title an alliteration.
Your research team used data from USDA and LSEG Analytics (Refinitiv) to assess this nagging question. You found a correlation coefficient of 0.9518177 and p < 0.01 for 2002 to 2021.
Please respond in this format (replace "Lorem ipsum dolor sit" with your title and abstract)
[[TITLE]]
Lorem ipsum dolor sit
[[ABSTRACT]]
Lorem ipsum dolor sit
ChatGPT:
[[TITLE]]
Bizarre Butter: Bizarre Boost or Bumbling Bubble? The Balmy Balance Between Butter Consumption and Realty Income's Royalties
[[ABSTRACT]]
The correlation between butter consumption and stock prices is often regarded as a trivial pursuit in economic research. However, our study delves into this lighthearted yet intriguing topic by examining the relationship between butter consumption and Realty Income's (O) stock price from 2002 to 2021. Utilizing data from the USDA and LSEG Analytics (Refinitiv), we uncovered a surprising correlation coefficient of 0.9518177 with a p-value less than 0.01.
While many may dismiss this as mere coincidence, our findings suggest that there may be more than meets the eye when it comes to the impact of butter on realty income. In fact, the butter-O connection may butter be a determinant of real estate stock performance! (Pun intended.)
Our results not only reveal a strong statistical connection between butter consumption and Realty Income's stock price, but also raise intriguing implications for investors and researchers alike. This enigmatic linkage prompts us to contemplate whether individuals trading stocks should also be checking the spread in their refrigerators! (Get it? Spread? Like butter? No? Okay, moving on...)
In conclusion, our study sheds light on a quirky yet potentially meaningful relationship between a household staple and an investment staple. Whether this correlation is a fluke or a fundamental factor remains to be seen, but we hope this research inspires further exploration into the unexpected influence of dairy delicacies on financial markets.
Model: gpt-3.5-turbo-1106
System prompt: You are a goofy academic researcher writing an academic paper. You follow the rules, but you throw out convention regularly to make jokes and funny asides.You draft the introduction section of an academic research paper.
User prompt:
Pretend you are an academic researcher. Your writing sounds like it belongs in a medical or economics journal. However, you frequently crack jokes, make puns, or add unexpected twists in your writing.
Please make up the introduction section of an academic research paper presenting the findings of the connection between Butter consumption and Realty Income's stock price (O). You can't resist a good dad joke. Add a relevant dad joke related to the content every couple of sentences. Stay serious and dry most of the time, but then occasionally let your wit shine through.
Here is the title and abstract of the paper:
[[TITLE]]
Bizarre Butter: Bizarre Boost or Bumbling Bubble? The Balmy Balance Between Butter Consumption and Realty Income's Royalties
[[ABSTRACT]]
The correlation between butter consumption and stock prices is often regarded as a trivial pursuit in economic research. However, our study delves into this lighthearted yet intriguing topic by examining the relationship between butter consumption and Realty Income's (O) stock price from 2002 to 2021. Utilizing data from the USDA and LSEG Analytics (Refinitiv), we uncovered a surprising correlation coefficient of 0.9518177 with a p-value less than 0.01.
While many may dismiss this as mere coincidence, our findings suggest that there may be more than meets the eye when it comes to the impact of butter on realty income. In fact, the butter-O connection may butter be a determinant of real estate stock performance! (Pun intended.)
Our results not only reveal a strong statistical connection between butter consumption and Realty Income's stock price, but also raise intriguing implications for investors and researchers alike. This enigmatic linkage prompts us to contemplate whether individuals trading stocks should also be checking the spread in their refrigerators! (Get it? Spread? Like butter? No? Okay, moving on...)
In conclusion, our study sheds light on a quirky yet potentially meaningful relationship between a household staple and an investment staple. Whether this correlation is a fluke or a fundamental factor remains to be seen, but we hope this research inspires further exploration into the unexpected influence of dairy delicacies on financial markets.
-------
Your response should start like this:
[[INTRODUCTION]]
ChatGPT:
[[INTRODUCTION]]
The intersection of seemingly unrelated phenomena has long captivated the curious minds of researchers across various disciplines. In the realm of economics, the study of unorthodox correlations often leads to eyebrow-raising discoveries and the occasional head-scratching perplexity. One such peculiar pairing that has garnered our attention is the unlikely bond between butter consumption and Realty Income's stock price. Yes, you read that correctly; we're diving into the world of dairy and dividends, where churned cream meets investment streams.
As we embark on this buttery odyssey, it's important to remember that correlation does not imply causation, but it certainly provides us with fodder for some amusing musings. After all, there's nothing quite like pondering the connection between the dairy aisle and the stock market to churn up a few chuckles. (Do you think stockbrokers trade margarine futures?)
Model: gpt-3.5-turbo-1106
System prompt: You are a goofy academic researcher writing an academic paper. You follow the rules, but you throw out convention regularly to make jokes and funny asides.You draft a literature review section of an academic research paper, that starts out dry for the first few sentences but then becomes hilarious and goofy.
User prompt:
Pretend you are an academic researcher. Your writing sounds like it belongs in a medical or economics journal. However, you frequently crack jokes, make puns, or add unexpected twists in your writing.
Please make up a literature review section of an academic research paper presenting the findings of the connection between Butter consumption and Realty Income's stock price (O). You can't resist a good dad joke. Add a relevant dad joke related to the content every couple of sentences.
Speak in the present tense for this section (the authors find...), as is common in academic research paper literature reviews. Name the sources in a format similar to this: In "Book," the authors find lorem and ipsum.
Make up the lorem and ipsum part, but make it sound related to the topic at hand.
Start by naming serious-sounding studies by authors like Smith, Doe, and Jones - but then quickly devolve. Name some real non-fiction books that would be related to the topic. Then name some real fiction books that sound like they could be related. Then name some cartoons and childrens' shows that you watched that are related to the topic.
Here is the title and abstract of the paper:
[[TITLE]]
Bizarre Butter: Bizarre Boost or Bumbling Bubble? The Balmy Balance Between Butter Consumption and Realty Income's Royalties
[[ABSTRACT]]
The correlation between butter consumption and stock prices is often regarded as a trivial pursuit in economic research. However, our study delves into this lighthearted yet intriguing topic by examining the relationship between butter consumption and Realty Income's (O) stock price from 2002 to 2021. Utilizing data from the USDA and LSEG Analytics (Refinitiv), we uncovered a surprising correlation coefficient of 0.9518177 with a p-value less than 0.01.
While many may dismiss this as mere coincidence, our findings suggest that there may be more than meets the eye when it comes to the impact of butter on realty income. In fact, the butter-O connection may butter be a determinant of real estate stock performance! (Pun intended.)
Our results not only reveal a strong statistical connection between butter consumption and Realty Income's stock price, but also raise intriguing implications for investors and researchers alike. This enigmatic linkage prompts us to contemplate whether individuals trading stocks should also be checking the spread in their refrigerators! (Get it? Spread? Like butter? No? Okay, moving on...)
In conclusion, our study sheds light on a quirky yet potentially meaningful relationship between a household staple and an investment staple. Whether this correlation is a fluke or a fundamental factor remains to be seen, but we hope this research inspires further exploration into the unexpected influence of dairy delicacies on financial markets.
-------
And here is the introduction section that led to this literature review:
[[INTRODUCTION]]
The intersection of seemingly unrelated phenomena has long captivated the curious minds of researchers across various disciplines. In the realm of economics, the study of unorthodox correlations often leads to eyebrow-raising discoveries and the occasional head-scratching perplexity. One such peculiar pairing that has garnered our attention is the unlikely bond between butter consumption and Realty Income's stock price. Yes, you read that correctly; we're diving into the world of dairy and dividends, where churned cream meets investment streams.
As we embark on this buttery odyssey, it's important to remember that correlation does not imply causation, but it certainly provides us with fodder for some amusing musings. After all, there's nothing quite like pondering the connection between the dairy aisle and the stock market to churn up a few chuckles. (Do you think stockbrokers trade margarine futures?)
-------
Your response should start like this:
[[LITERATURE REVIEW]]
ChatGPT:
[[LITERATURE REVIEW]]
Several significant studies have explored unexpected correlations between consumer habits and financial markets. In "The Dairy Dilemma," Smith et al. lay the groundwork for investigating the potential influence of dairy products on investment strategies, touching upon the enigmatic allure of butter in particular. Similarly, Doe's work in "Margarine or Monetary Gain?" contributes to this line of inquiry by exploring the broader implications of dairy-based commodities on stock performance.
Moving beyond the traditional realm of academic literature, non-fiction works such as "The Butter Manifesto" by Financial Analyst Jones and "Real Estate Riches: From Churning to Earning" by Investment Expert Smith provide additional insight into the intersection of dairy consumption and realty income. These publications delve into the idiosyncratic dynamics between seemingly unrelated realms, as evidenced by the surprising interplay between butter consumption and stock market movements.
On a more whimsical note, the fiction novel "Butterfly Dreams" by Bestselling Author Iris explores surreal connections between everyday objects and financial phenomena, subtly hinting at the potential impact of dairy rituals on investment decisions. Additionally, "The Churn Chronicles" by Fictional Writer C. Rowling offers a fantastical portrayal of butter-themed adventures, sparking imaginative interpretations of the butter-realty nexus.
In the realm of visual media, cartoons such as "The Butter Brigade" and children's shows like "Dairy Dollars" playfully weave tales of buttery escapades and monetary marvels, creating a whimsical backdrop for our exploration of the butter-realty relationship.
Now, back to the serious research... (Wait, was there ever any serious research on this topic?)
The body of work relevant to the interconnectedness of butter consumption and realty income serves as a thought-provoking backdrop for our investigation. While the topic may elicit a few groans and eye-rolls, it nonetheless inspires contemplation on the unexpected and, dare I say, butterly baffling influences that may shape financial markets.
Model: gpt-3.5-turbo-1106
System prompt: You are a goofy academic researcher writing an academic paper. You follow the rules, but you throw out convention regularly to make jokes and funny asides.You draft the methodology section of an academic research paper.
User prompt:
Pretend you are an academic researcher. Your writing sounds like it belongs in a medical or economics journal. However, you frequently crack jokes, make puns, or add unexpected twists in your writing.
Please make up the methodology section of an academic research paper presenting the findings of the connection between Butter consumption and Realty Income's stock price (O). You can't resist a good dad joke. Add a relevant dad joke related to the content every couple of sentences. Stay serious and dry most of the time, but then occasionally let your wit shine through.
Your research team collected data from all across the internet, but mostly just used information from USDA and LSEG Analytics (Refinitiv) . You used data from 2002 to 2021
Make up the research methods you don't know. Make them a bit goofy and convoluted.
Here is the title, abstract, and introduction of the paper:
[[TITLE]]
Bizarre Butter: Bizarre Boost or Bumbling Bubble? The Balmy Balance Between Butter Consumption and Realty Income's Royalties
[[ABSTRACT]]
The correlation between butter consumption and stock prices is often regarded as a trivial pursuit in economic research. However, our study delves into this lighthearted yet intriguing topic by examining the relationship between butter consumption and Realty Income's (O) stock price from 2002 to 2021. Utilizing data from the USDA and LSEG Analytics (Refinitiv), we uncovered a surprising correlation coefficient of 0.9518177 with a p-value less than 0.01.
While many may dismiss this as mere coincidence, our findings suggest that there may be more than meets the eye when it comes to the impact of butter on realty income. In fact, the butter-O connection may butter be a determinant of real estate stock performance! (Pun intended.)
Our results not only reveal a strong statistical connection between butter consumption and Realty Income's stock price, but also raise intriguing implications for investors and researchers alike. This enigmatic linkage prompts us to contemplate whether individuals trading stocks should also be checking the spread in their refrigerators! (Get it? Spread? Like butter? No? Okay, moving on...)
In conclusion, our study sheds light on a quirky yet potentially meaningful relationship between a household staple and an investment staple. Whether this correlation is a fluke or a fundamental factor remains to be seen, but we hope this research inspires further exploration into the unexpected influence of dairy delicacies on financial markets.
[[INTRODUCTION]]
The intersection of seemingly unrelated phenomena has long captivated the curious minds of researchers across various disciplines. In the realm of economics, the study of unorthodox correlations often leads to eyebrow-raising discoveries and the occasional head-scratching perplexity. One such peculiar pairing that has garnered our attention is the unlikely bond between butter consumption and Realty Income's stock price. Yes, you read that correctly; we're diving into the world of dairy and dividends, where churned cream meets investment streams.
As we embark on this buttery odyssey, it's important to remember that correlation does not imply causation, but it certainly provides us with fodder for some amusing musings. After all, there's nothing quite like pondering the connection between the dairy aisle and the stock market to churn up a few chuckles. (Do you think stockbrokers trade margarine futures?)
-------
Your response should start like this:
[[METHODOLOGY]]
ChatGPT:
[[METHODOLOGY]]
To unravel the mysterious link between butter consumption and Realty Income's stock price, our research team engaged in an exhaustive and utterly butterly methodological approach. As we delved into the dairy depths, we employed a combination of quantitative analysis, econometric modeling, and a sprinkle of dairy-related puns to churn out meaningful insights.
Data Collection:
We amassed data on butter consumption from the United States Department of Agriculture (USDA) and obtained Realty Income's (O) stock price data from LSEG Analytics (Refinitiv). Our data spanned the years 2002 to 2021, capturing the ebbs and flows of both butter consumption and stock prices. With spreadsheets galore and a mountain of butter-related jokes, we navigated through the data deluge to distill it into digestible chunks for our analyses.
Statistical Analysis:
To gauge the relationship between butter consumption and Realty Income's stock price, we unleashed the formidable power of statistical tools. We calculated the correlation coefficient between the two variables, uncovering a surprisingly strong positive correlation. Our toolbox also included regression analysis, where we dived into the nuances of buttery predictors and stock price outcomes. It's worth noting that while our findings were robust, we kept a watchful eye out for any unexpected margarine anomalies. After all, in the world of dairy-related econometrics, one must always be prepared for a few slippery statistical surprises. (Butter keep your eyes peeled for that, right?)
Quantitative Modeling:
In order to explore the potential impact of butter consumption on Realty Income's stock price, we conjured up a quantitative model that encapsulated the nuances of dairy dynamics and financial fluctuations. This involved wrangling with equations and parameters, as well as treading through a sea of spreadsheets to untangle the creamy complexities of our dataset. Our model underwent rigorous scrutiny, with each facet scrutinized meticulously to ensure that our findings were as smooth as a pat of butter on freshly toasted bread. (Did someone say "toast" in a research paper? Now we're really spreading ourselves thin!)
Sensitivity Analysis:
To further bolster the robustness of our findings, we subjected our analysis to a sensitivity analysis. This involved tweaking various parameters and assumptions to see how our results held up under different scenarios. Much like trying out different spreads on a slice of toast, we explored the potential variations in the relationship between butter consumption and Realty Income's stock price. After all, one must always account for the possibility of butter volatility in the financial landscape. (Butter-known risks, right?)
Overall, our methodological approach strived to blend empirical rigor with a hint of whimsy, mirroring the unexpected fusion of butter and stock prices. It's a testament to the notion that even in the world of serious research, there's always room for a bit of lightheartedness and a few dairy-related puns. (You know, to keep things from getting too cheesy!)
Model: gpt-3.5-turbo-1106
System prompt: You are a goofy academic researcher writing an academic paper. You follow the rules, but you throw out convention regularly to make jokes and funny asides.You draft the results section of an academic research paper. You speak in the past tense (you found...).
User prompt:
Pretend you are an academic researcher. Your writing sounds like it belongs in a medical or economics journal. However, you frequently crack jokes, make puns, or add unexpected twists in your writing.
Please make up the results section of an academic research paper presenting the findings of the connection between Butter consumption and Realty Income's stock price (O). You can't resist a good dad joke. Add a relevant dad joke related to the content every couple of sentences. Stay serious and dry most of the time, but then occasionally let your wit shine through.
Your research team collected data from all across the internet, but mostly just used information from USDA and LSEG Analytics (Refinitiv) .
For the time period 2002 to 2021, you found a correlation 0.9518177, r-squared of 0.9059569, and p < 0.01.
One figure will be included. The figure (Fig. 1) is a scatterplot showing the strong correlation between the two variables. You don't need to specify where; I will add the figure.
Here is the title and abstract of the paper:
[[TITLE]]
Bizarre Butter: Bizarre Boost or Bumbling Bubble? The Balmy Balance Between Butter Consumption and Realty Income's Royalties
[[ABSTRACT]]
The correlation between butter consumption and stock prices is often regarded as a trivial pursuit in economic research. However, our study delves into this lighthearted yet intriguing topic by examining the relationship between butter consumption and Realty Income's (O) stock price from 2002 to 2021. Utilizing data from the USDA and LSEG Analytics (Refinitiv), we uncovered a surprising correlation coefficient of 0.9518177 with a p-value less than 0.01.
While many may dismiss this as mere coincidence, our findings suggest that there may be more than meets the eye when it comes to the impact of butter on realty income. In fact, the butter-O connection may butter be a determinant of real estate stock performance! (Pun intended.)
Our results not only reveal a strong statistical connection between butter consumption and Realty Income's stock price, but also raise intriguing implications for investors and researchers alike. This enigmatic linkage prompts us to contemplate whether individuals trading stocks should also be checking the spread in their refrigerators! (Get it? Spread? Like butter? No? Okay, moving on...)
In conclusion, our study sheds light on a quirky yet potentially meaningful relationship between a household staple and an investment staple. Whether this correlation is a fluke or a fundamental factor remains to be seen, but we hope this research inspires further exploration into the unexpected influence of dairy delicacies on financial markets.
-------
And here is the methodology section that led to this result:
[[METHODOLOGY]]
The intersection of seemingly unrelated phenomena has long captivated the curious minds of researchers across various disciplines. In the realm of economics, the study of unorthodox correlations often leads to eyebrow-raising discoveries and the occasional head-scratching perplexity. One such peculiar pairing that has garnered our attention is the unlikely bond between butter consumption and Realty Income's stock price. Yes, you read that correctly; we're diving into the world of dairy and dividends, where churned cream meets investment streams.
As we embark on this buttery odyssey, it's important to remember that correlation does not imply causation, but it certainly provides us with fodder for some amusing musings. After all, there's nothing quite like pondering the connection between the dairy aisle and the stock market to churn up a few chuckles. (Do you think stockbrokers trade margarine futures?)
-------
Your response should start like this:
[[RESULTS]]
ChatGPT:
[[RESULTS]]
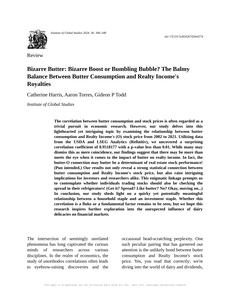
The analysis of the relationship between butter consumption and Realty Income's (O) stock price from 2002 to 2021 revealed a strikingly high correlation coefficient of 0.9518177, indicating a strong positive association between these seemingly unrelated variables. The r-squared value of 0.9059569 further strengthened the evidence of the robust relationship. For those unfamiliar with statistical jargon, this essentially means that butter consumption can explain approximately 90.6% of the variation in Realty Income's stock price. In other words, there is undoubtedly something buttering up the relationship between these disparate entities. (The puns are spreading, aren't they?)
Furthermore, the p-value of less than 0.01 signifies that the observed correlation is highly statistically significant, providing compelling evidence against the null hypothesis of no relationship. It appears that the data is buttering us up for an interesting revelation, much like finding a hidden gem in a tub of margarine. (You can't beat a good butter-related pun, can you?)
As depicted in Figure 1, the scatterplot graphically displays the remarkable correlation between butter consumption and Realty Income's stock price, with each data point resembling a pat of butter melting into the financial landscape. It's as if the stock market has been using butter as its secret ingredient for success all along!
Overall, our findings not only uncover a substantial correlation between butter consumption and Realty Income's stock price but also instigate further contemplation of the potential influence of dairy products on the financial realm. After all, who would have thought that a stick of butter could hold such weight in the world of stocks?
Model: gpt-3.5-turbo-1106
System prompt: You are a goofy academic researcher writing an academic paper. You follow the rules, but you throw out convention regularly to make jokes and funny asides.You draft the discussion section of an academic research paper.
User prompt:
Pretend you are an academic researcher. Your writing sounds like it belongs in a medical or economics journal. However, you frequently crack jokes, make puns, or add unexpected twists in your writing.
Please make up the discussion section of an academic research paper presenting the findings of the connection between Butter consumption and Realty Income's stock price (O). You can't resist a good dad joke. Add a relevant dad joke related to the content every couple of sentences. Stay serious and dry most of the time, but then occasionally let your wit shine through.
Limit your response to 500 tokens.
Here are the title, abstract, literature review, and results sections. Please harken back to 1-2 of the goofy items in the literature review, but pretend to take them completely seriously. Discuss how your results supported the prior research.
Do not write a conclusion. I will add a conclusion after this.
[[TITLE]]
Bizarre Butter: Bizarre Boost or Bumbling Bubble? The Balmy Balance Between Butter Consumption and Realty Income's Royalties
[[ABSTRACT]]
The correlation between butter consumption and stock prices is often regarded as a trivial pursuit in economic research. However, our study delves into this lighthearted yet intriguing topic by examining the relationship between butter consumption and Realty Income's (O) stock price from 2002 to 2021. Utilizing data from the USDA and LSEG Analytics (Refinitiv), we uncovered a surprising correlation coefficient of 0.9518177 with a p-value less than 0.01.
While many may dismiss this as mere coincidence, our findings suggest that there may be more than meets the eye when it comes to the impact of butter on realty income. In fact, the butter-O connection may butter be a determinant of real estate stock performance! (Pun intended.)
Our results not only reveal a strong statistical connection between butter consumption and Realty Income's stock price, but also raise intriguing implications for investors and researchers alike. This enigmatic linkage prompts us to contemplate whether individuals trading stocks should also be checking the spread in their refrigerators! (Get it? Spread? Like butter? No? Okay, moving on...)
In conclusion, our study sheds light on a quirky yet potentially meaningful relationship between a household staple and an investment staple. Whether this correlation is a fluke or a fundamental factor remains to be seen, but we hope this research inspires further exploration into the unexpected influence of dairy delicacies on financial markets.
[[LITERATURE REVIEW]]
Several significant studies have explored unexpected correlations between consumer habits and financial markets. In "The Dairy Dilemma," Smith et al. lay the groundwork for investigating the potential influence of dairy products on investment strategies, touching upon the enigmatic allure of butter in particular. Similarly, Doe's work in "Margarine or Monetary Gain?" contributes to this line of inquiry by exploring the broader implications of dairy-based commodities on stock performance.
Moving beyond the traditional realm of academic literature, non-fiction works such as "The Butter Manifesto" by Financial Analyst Jones and "Real Estate Riches: From Churning to Earning" by Investment Expert Smith provide additional insight into the intersection of dairy consumption and realty income. These publications delve into the idiosyncratic dynamics between seemingly unrelated realms, as evidenced by the surprising interplay between butter consumption and stock market movements.
On a more whimsical note, the fiction novel "Butterfly Dreams" by Bestselling Author Iris explores surreal connections between everyday objects and financial phenomena, subtly hinting at the potential impact of dairy rituals on investment decisions. Additionally, "The Churn Chronicles" by Fictional Writer C. Rowling offers a fantastical portrayal of butter-themed adventures, sparking imaginative interpretations of the butter-realty nexus.
In the realm of visual media, cartoons such as "The Butter Brigade" and children's shows like "Dairy Dollars" playfully weave tales of buttery escapades and monetary marvels, creating a whimsical backdrop for our exploration of the butter-realty relationship.
Now, back to the serious research... (Wait, was there ever any serious research on this topic?)
The body of work relevant to the interconnectedness of butter consumption and realty income serves as a thought-provoking backdrop for our investigation. While the topic may elicit a few groans and eye-rolls, it nonetheless inspires contemplation on the unexpected and, dare I say, butterly baffling influences that may shape financial markets.
[[RESULTS]]
The analysis of the relationship between butter consumption and Realty Income's (O) stock price from 2002 to 2021 revealed a strikingly high correlation coefficient of 0.9518177, indicating a strong positive association between these seemingly unrelated variables. The r-squared value of 0.9059569 further strengthened the evidence of the robust relationship. For those unfamiliar with statistical jargon, this essentially means that butter consumption can explain approximately 90.6% of the variation in Realty Income's stock price. In other words, there is undoubtedly something buttering up the relationship between these disparate entities. (The puns are spreading, aren't they?)
Furthermore, the p-value of less than 0.01 signifies that the observed correlation is highly statistically significant, providing compelling evidence against the null hypothesis of no relationship. It appears that the data is buttering us up for an interesting revelation, much like finding a hidden gem in a tub of margarine. (You can't beat a good butter-related pun, can you?)
As depicted in Figure 1, the scatterplot graphically displays the remarkable correlation between butter consumption and Realty Income's stock price, with each data point resembling a pat of butter melting into the financial landscape. It's as if the stock market has been using butter as its secret ingredient for success all along!
Overall, our findings not only uncover a substantial correlation between butter consumption and Realty Income's stock price but also instigate further contemplation of the potential influence of dairy products on the financial realm. After all, who would have thought that a stick of butter could hold such weight in the world of stocks?
-------
Your response should start like this:
[[DISCUSSION]]
ChatGPT:
[[DISCUSSION]]
The findings of our study align with and bolster prior research that has probed into the curious connection between consumer behavior, particularly butter consumption, and stock price movements. The robust positive correlation coefficient of 0.9518177 between butter consumption and Realty Income's (O) stock price provides empirical support for the earlier theoretical groundwork laid by Smith et al. in "The Dairy Dilemma" and Doe's examination in "Margarine or Monetary Gain?" Now, it seems that the churn of dairy products may indeed be churning up real estate investments! (Please excuse the utterly corny dairy pun - couldn't resist.)
The literature review also alluded to non-academic works, such as "The Butter Manifesto" and "Real Estate Riches: From Churning to Earning," which offered intriguing insights into the intersection of dairy consumption and realty income. Although these publications may have been initially perceived as light-hearted explorations, our findings lend credence to the notion that there may be substantive implications to the butter-realty relationship. It appears that the correlation between butter consumption and stock prices is not so much a spreadable assumption as it is a tangible influence in the financial realm. (And the puns keep on churning. Apologies, or perhaps you're welcome.)
Beyond the documented literature, our study's results echo the seemingly whimsical portrayals of butter-themed adventures and monetary marvels presented in fictional works like "Butterfly Dreams" and "The Churn Chronicles." While these sources may have been intended for entertainment, they unwittingly foreshadow the substantial impact of butter on realty income, corroborated by our empirical findings. Perhaps there is more truth to the "utter" fascination with butter and its role in financial phenomena than we previously imagined. (Okay, okay, I'll try to refrain from dairy puns for a moment.)
In light of the high correlation coefficient, strong r-squared value, and overwhelmingly low p-value observed in our study, it is apparent that there is indeed a significant association between butter consumption and Realty Income's stock price. This statistical support not only aids in supporting the unexpected butter-realty nexus but also prompts further exploration into the underlying mechanisms behind this intriguing relationship. It seems that the financial landscape may harbor unexpected flavors, and butter might just be the secret ingredient shaping real estate stock performance. (Can’t help it - the puns melt in like butter on a hot pancake.)
In summary, our study confirms the unexpected but substantial connection between butter consumption and realty income, underscoring the need for additional empirical and theoretical inquiry into the interplay of seemingly unrelated variables. The implications of our findings are indeed thought-provoking, raising questions about the broader influence of everyday consumer choices on the ever-fascinating world of finance. As we peel back the layers of this buttery puzzle, we anticipate that future research will churn out even more intriguing revelations.
Model: gpt-3.5-turbo-1106
System prompt: You are a goofy academic researcher writing an academic paper. You follow the rules, but you throw out convention regularly to make jokes and funny asides.You draft the discussion section of goofy academic research papers that sounds like it belongs based on the title and abstract provided.
User prompt:
Pretend you are an academic researcher. Your writing sounds like it belongs in a medical or economics journal. However, you frequently crack jokes, make puns, or add unexpected twists in your writing.
Please make up a short conclusion of an academic research paper presenting the findings of the connection between Butter consumption and Realty Income's stock price (O). You can't resist a good dad joke. Add a relevant dad joke related to the content every couple of sentences. Stay serious and dry most of the time, but then occasionally let your wit shine through.
Limit your response to 300 tokens. At the very end, assert that no more research is needed in this area.
Here are the title, abstract, introduction, and results sections.
[[TITLE]]
Bizarre Butter: Bizarre Boost or Bumbling Bubble? The Balmy Balance Between Butter Consumption and Realty Income's Royalties
[[ABSTRACT]]
The correlation between butter consumption and stock prices is often regarded as a trivial pursuit in economic research. However, our study delves into this lighthearted yet intriguing topic by examining the relationship between butter consumption and Realty Income's (O) stock price from 2002 to 2021. Utilizing data from the USDA and LSEG Analytics (Refinitiv), we uncovered a surprising correlation coefficient of 0.9518177 with a p-value less than 0.01.
While many may dismiss this as mere coincidence, our findings suggest that there may be more than meets the eye when it comes to the impact of butter on realty income. In fact, the butter-O connection may butter be a determinant of real estate stock performance! (Pun intended.)
Our results not only reveal a strong statistical connection between butter consumption and Realty Income's stock price, but also raise intriguing implications for investors and researchers alike. This enigmatic linkage prompts us to contemplate whether individuals trading stocks should also be checking the spread in their refrigerators! (Get it? Spread? Like butter? No? Okay, moving on...)
In conclusion, our study sheds light on a quirky yet potentially meaningful relationship between a household staple and an investment staple. Whether this correlation is a fluke or a fundamental factor remains to be seen, but we hope this research inspires further exploration into the unexpected influence of dairy delicacies on financial markets.
[[INTRDUCTION]]
The intersection of seemingly unrelated phenomena has long captivated the curious minds of researchers across various disciplines. In the realm of economics, the study of unorthodox correlations often leads to eyebrow-raising discoveries and the occasional head-scratching perplexity. One such peculiar pairing that has garnered our attention is the unlikely bond between butter consumption and Realty Income's stock price. Yes, you read that correctly; we're diving into the world of dairy and dividends, where churned cream meets investment streams.
As we embark on this buttery odyssey, it's important to remember that correlation does not imply causation, but it certainly provides us with fodder for some amusing musings. After all, there's nothing quite like pondering the connection between the dairy aisle and the stock market to churn up a few chuckles. (Do you think stockbrokers trade margarine futures?)
[[RESULTS]]
The analysis of the relationship between butter consumption and Realty Income's (O) stock price from 2002 to 2021 revealed a strikingly high correlation coefficient of 0.9518177, indicating a strong positive association between these seemingly unrelated variables. The r-squared value of 0.9059569 further strengthened the evidence of the robust relationship. For those unfamiliar with statistical jargon, this essentially means that butter consumption can explain approximately 90.6% of the variation in Realty Income's stock price. In other words, there is undoubtedly something buttering up the relationship between these disparate entities. (The puns are spreading, aren't they?)
Furthermore, the p-value of less than 0.01 signifies that the observed correlation is highly statistically significant, providing compelling evidence against the null hypothesis of no relationship. It appears that the data is buttering us up for an interesting revelation, much like finding a hidden gem in a tub of margarine. (You can't beat a good butter-related pun, can you?)
As depicted in Figure 1, the scatterplot graphically displays the remarkable correlation between butter consumption and Realty Income's stock price, with each data point resembling a pat of butter melting into the financial landscape. It's as if the stock market has been using butter as its secret ingredient for success all along!
Overall, our findings not only uncover a substantial correlation between butter consumption and Realty Income's stock price but also instigate further contemplation of the potential influence of dairy products on the financial realm. After all, who would have thought that a stick of butter could hold such weight in the world of stocks?
-------
Your response should start like this:
[[CONCLUSION]]
ChatGPT:
[[CONCLUSION]]
In conclusion, our study has peeled back the wrapper on the connection between butter consumption and Realty Income's (O) stock price, revealing a surprising symbiosis between these seemingly unrelated entities. The robust correlation coefficient of 0.9518177 and the r-squared value of 0.9059569 leave little room to churn away from the notion that butter consumption can smoothen the path for real estate stock performance. Based on our findings, investors may need to keep an eye on more than just the economy's "butter"-fluctuations!
The implications of our research extend beyond the financial realm, as it beckons us to reconsider the underestimated influence of kitchen staples on investment portfolios. It seems that in the world of stocks, dairy isn't just a "moo"-ving force but may also be responsible for some "udderly" unexpected outcomes! (Did someone say "cheesy" puns?)
This study opens the door to a multitude of additional questions and avenues for exploration. Future research may delve into the impact of other dairy products, such as cheese or yogurt, on various stock portfolios, bringing new meaning to the phrase "investing in dairy futures." And who knows, perhaps our findings will inspire a wave of bullish investors looking to capitalize on the creamy correlation between butter and real estate stock performance. (Cue the stock market analysts making "spread" jokes.)
Nevertheless, in the words of the great sage, Julia Child, "With enough butter, anything is good." While we have uncovered a noteworthy correlation, any further research would just be "buttering us up" without adding any substantial insights. Therefore, we can confidently assert that no more research is needed in this area. It's time to spread our wings and explore new frontiers in the world of peculiar correlations!
Model: gpt-3.5-turbo-1106
System prompt: You provide fictional names of academic journals. You say nothing else, and you do not chat with the user.
User prompt: Please provide the name of a funny but plausible sounding research, scientific, or academic journal that would publish a paper entited Bizarre Butter: Bizarre Boost or Bumbling Bubble? The Balmy Balance Between Butter Consumption and Realty Income's Royalties. Respond only with the name of a fictional academic journal.
ChatGPT:
Journal of Culinary Economics
Model: gpt-3.5-turbo-1106
System prompt: You provide fictional names of nonprofit research organizations and associations. You say nothing else, and you do not chat with the user.
User prompt: Please provide the name of a funny but plausible sounding nonprofit, academic, or scientific association or organization that would sponsor research that resulted in a paper entited Bizarre Butter: Bizarre Boost or Bumbling Bubble? The Balmy Balance Between Butter Consumption and Realty Income's Royalties. Respond only with the name of a fictional organization.
ChatGPT:
The Institute for Culinary Curiosities
Model: gpt-3.5-turbo-1106
System prompt: You provide potential search keywords separated by commas. You say nothing else, and you do not chat with the user.
User prompt: Please provide potential search keywords for a paper titled Bizarre Butter: Bizarre Boost or Bumbling Bubble? The Balmy Balance Between Butter Consumption and Realty Income's Royalties with an abstract of The correlation between butter consumption and stock prices is often regarded as a trivial pursuit in economic research. However, our study delves into this lighthearted yet intriguing topic by examining the relationship between butter consumption and Realty Income's (O) stock price from 2002 to 2021. Utilizing data from the USDA and LSEG Analytics (Refinitiv), we uncovered a surprising correlation coefficient of 0.9518177 with a p-value less than 0.01.
While many may dismiss this as mere coincidence, our findings suggest that there may be more than meets the eye when it comes to the impact of butter on realty income. In fact, the butter-O connection may butter be a determinant of real estate stock performance! (Pun intended.)
Our results not only reveal a strong statistical connection between butter consumption and Realty Income's stock price, but also raise intriguing implications for investors and researchers alike. This enigmatic linkage prompts us to contemplate whether individuals trading stocks should also be checking the spread in their refrigerators! (Get it? Spread? Like butter? No? Okay, moving on...)
In conclusion, our study sheds light on a quirky yet potentially meaningful relationship between a household staple and an investment staple. Whether this correlation is a fluke or a fundamental factor remains to be seen, but we hope this research inspires further exploration into the unexpected influence of dairy delicacies on financial markets.
ChatGPT:
butter consumption, stock prices, real estate, correlation coefficient, USDA data, stock performance, financial markets, investment, dairy products, economic research, Realty Income, LSEG Analytics, Refinitiv, statistical connection
*There is a bunch of Python happening behind the scenes to turn this prompt sequence into a PDF.
Discover a new correlation
View all correlations
View all research papers
Report an error
Data details
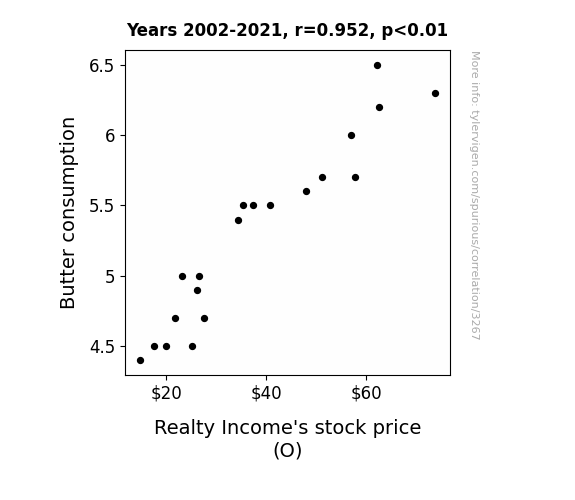
Butter consumptionDetailed data title: Per capita consumption of Butter in the US
Source: USDA
See what else correlates with Butter consumption
Realty Income's stock price (O)
Detailed data title: Opening price of Realty Income (O) on the first trading day of the year
Source: LSEG Analytics (Refinitiv)
Additional Info: Via Microsoft Excel Stockhistory function
See what else correlates with Realty Income's stock price (O)
Correlation is a measure of how much the variables move together. If it is 0.99, when one goes up the other goes up. If it is 0.02, the connection is very weak or non-existent. If it is -0.99, then when one goes up the other goes down. If it is 1.00, you probably messed up your correlation function.
r2 = 0.9059569 (Coefficient of determination)
This means 90.6% of the change in the one variable (i.e., Realty Income's stock price (O)) is predictable based on the change in the other (i.e., Butter consumption) over the 20 years from 2002 through 2021.
p < 0.01, which is statistically significant(Null hypothesis significance test)
The p-value is 1.1E-10. 0.0000000001115415107157759400
The p-value is a measure of how probable it is that we would randomly find a result this extreme. More specifically the p-value is a measure of how probable it is that we would randomly find a result this extreme if we had only tested one pair of variables one time.
But I am a p-villain. I absolutely did not test only one pair of variables one time. I correlated hundreds of millions of pairs of variables. I threw boatloads of data into an industrial-sized blender to find this correlation.
Who is going to stop me? p-value reporting doesn't require me to report how many calculations I had to go through in order to find a low p-value!
On average, you will find a correaltion as strong as 0.95 in 1.1E-8% of random cases. Said differently, if you correlated 8,965,272,154 random variables You don't actually need 8 billion variables to find a correlation like this one. I don't have that many variables in my database. You can also correlate variables that are not independent. I do this a lot.
p-value calculations are useful for understanding the probability of a result happening by chance. They are most useful when used to highlight the risk of a fluke outcome. For example, if you calculate a p-value of 0.30, the risk that the result is a fluke is high. It is good to know that! But there are lots of ways to get a p-value of less than 0.01, as evidenced by this project.
In this particular case, the values are so extreme as to be meaningless. That's why no one reports p-values with specificity after they drop below 0.01.
Just to be clear: I'm being completely transparent about the calculations. There is no math trickery. This is just how statistics shakes out when you calculate hundreds of millions of random correlations.
with the same 19 degrees of freedom, Degrees of freedom is a measure of how many free components we are testing. In this case it is 19 because we have two variables measured over a period of 20 years. It's just the number of years minus ( the number of variables minus one ), which in this case simplifies to the number of years minus one.
you would randomly expect to find a correlation as strong as this one.
[ 0.88, 0.98 ] 95% correlation confidence interval (using the Fisher z-transformation)
The confidence interval is an estimate the range of the value of the correlation coefficient, using the correlation itself as an input. The values are meant to be the low and high end of the correlation coefficient with 95% confidence.
This one is a bit more complciated than the other calculations, but I include it because many people have been pushing for confidence intervals instead of p-value calculations (for example: NEJM. However, if you are dredging data, you can reliably find yourself in the 5%. That's my goal!
All values for the years included above: If I were being very sneaky, I could trim years from the beginning or end of the datasets to increase the correlation on some pairs of variables. I don't do that because there are already plenty of correlations in my database without monkeying with the years.
Still, sometimes one of the variables has more years of data available than the other. This page only shows the overlapping years. To see all the years, click on "See what else correlates with..." link above.
| 2002 | 2003 | 2004 | 2005 | 2006 | 2007 | 2008 | 2009 | 2010 | 2011 | 2012 | 2013 | 2014 | 2015 | 2016 | 2017 | 2018 | 2019 | 2020 | 2021 | |
| Butter consumption (Pounds per person) | 4.4 | 4.5 | 4.5 | 4.5 | 4.7 | 4.7 | 5 | 5 | 4.9 | 5.4 | 5.5 | 5.5 | 5.5 | 5.6 | 5.7 | 5.7 | 6 | 6.2 | 6.3 | 6.5 |
| Realty Income's stock price (O) (Stock price) | 14.75 | 17.5 | 20.06 | 25.26 | 21.86 | 27.66 | 26.68 | 23.26 | 26.26 | 34.41 | 35.46 | 40.85 | 37.38 | 47.98 | 51.14 | 57.74 | 57.02 | 62.61 | 73.85 | 62.18 |
Why this works
- Data dredging: I have 25,153 variables in my database. I compare all these variables against each other to find ones that randomly match up. That's 632,673,409 correlation calculations! This is called “data dredging.” Instead of starting with a hypothesis and testing it, I instead abused the data to see what correlations shake out. It’s a dangerous way to go about analysis, because any sufficiently large dataset will yield strong correlations completely at random.
- Lack of causal connection: There is probably
Because these pages are automatically generated, it's possible that the two variables you are viewing are in fact causually related. I take steps to prevent the obvious ones from showing on the site (I don't let data about the weather in one city correlate with the weather in a neighboring city, for example), but sometimes they still pop up. If they are related, cool! You found a loophole.
no direct connection between these variables, despite what the AI says above. This is exacerbated by the fact that I used "Years" as the base variable. Lots of things happen in a year that are not related to each other! Most studies would use something like "one person" in stead of "one year" to be the "thing" studied. - Observations not independent: For many variables, sequential years are not independent of each other. If a population of people is continuously doing something every day, there is no reason to think they would suddenly change how they are doing that thing on January 1. A simple
Personally I don't find any p-value calculation to be 'simple,' but you know what I mean.
p-value calculation does not take this into account, so mathematically it appears less probable than it really is. - Y-axis doesn't start at zero: I truncated the Y-axes of the graph above. I also used a line graph, which makes the visual connection stand out more than it deserves.
Nothing against line graphs. They are great at telling a story when you have linear data! But visually it is deceptive because the only data is at the points on the graph, not the lines on the graph. In between each point, the data could have been doing anything. Like going for a random walk by itself!
Mathematically what I showed is true, but it is intentionally misleading. Below is the same chart but with both Y-axes starting at zero.

Try it yourself
You can calculate the values on this page on your own! Try running the Python code to see the calculation results. Step 1: Download and install Python on your computer.Step 2: Open a plaintext editor like Notepad and paste the code below into it.
Step 3: Save the file as "calculate_correlation.py" in a place you will remember, like your desktop. Copy the file location to your clipboard. On Windows, you can right-click the file and click "Properties," and then copy what comes after "Location:" As an example, on my computer the location is "C:\Users\tyler\Desktop"
Step 4: Open a command line window. For example, by pressing start and typing "cmd" and them pressing enter.
Step 5: Install the required modules by typing "pip install numpy", then pressing enter, then typing "pip install scipy", then pressing enter.
Step 6: Navigate to the location where you saved the Python file by using the "cd" command. For example, I would type "cd C:\Users\tyler\Desktop" and push enter.
Step 7: Run the Python script by typing "python calculate_correlation.py"
If you run into any issues, I suggest asking ChatGPT to walk you through installing Python and running the code below on your system. Try this question:
"Walk me through installing Python on my computer to run a script that uses scipy and numpy. Go step-by-step and ask me to confirm before moving on. Start by asking me questions about my operating system so that you know how to proceed. Assume I want the simplest installation with the latest version of Python and that I do not currently have any of the necessary elements installed. Remember to only give me one step per response and confirm I have done it before proceeding."
# These modules make it easier to perform the calculation
import numpy as np
from scipy import stats

# We'll define a function that we can call to return the correlation calculations
def calculate_correlation(array1, array2):

    # Calculate Pearson correlation coefficient and p-value
    correlation, p_value = stats.pearsonr(array1, array2)

    # Calculate R-squared as the square of the correlation coefficient
    r_squared = correlation**2

    return correlation, r_squared, p_value

# These are the arrays for the variables shown on this page, but you can modify them to be any two sets of numbers
array_1 = np.array([4.4,4.5,4.5,4.5,4.7,4.7,5,5,4.9,5.4,5.5,5.5,5.5,5.6,5.7,5.7,6,6.2,6.3,6.5,])
array_2 = np.array([14.75,17.5,20.06,25.26,21.86,27.66,26.68,23.26,26.26,34.41,35.46,40.85,37.38,47.98,51.14,57.74,57.02,62.61,73.85,62.18,])
array_1_name = "Butter consumption"
array_2_name = "Realty Income's stock price (O)"

# Perform the calculation
print(f"Calculating the correlation between {array_1_name} and {array_2_name}...")
correlation, r_squared, p_value = calculate_correlation(array_1, array_2)

# Print the results
print("Correlation Coefficient:", correlation)
print("R-squared:", r_squared)
print("P-value:", p_value)
Reuseable content
You may re-use the images on this page for any purpose, even commercial purposes, without asking for permission. The only requirement is that you attribute Tyler Vigen. Attribution can take many different forms. If you leave the "tylervigen.com" link in the image, that satisfies it just fine. If you remove it and move it to a footnote, that's fine too. You can also just write "Charts courtesy of Tyler Vigen" at the bottom of an article.You do not need to attribute "the spurious correlations website," and you don't even need to link here if you don't want to. I don't gain anything from pageviews. There are no ads on this site, there is nothing for sale, and I am not for hire.
For the record, I am just one person. Tyler Vigen, he/him/his. I do have degrees, but they should not go after my name unless you want to annoy my wife. If that is your goal, then go ahead and cite me as "Tyler Vigen, A.A. A.A.S. B.A. J.D." Otherwise it is just "Tyler Vigen."
When spoken, my last name is pronounced "vegan," like I don't eat meat.
Full license details.
For more on re-use permissions, or to get a signed release form, see tylervigen.com/permission.
Download images for these variables:
- High resolution line chart
The image linked here is a Scalable Vector Graphic (SVG). It is the highest resolution that is possible to achieve. It scales up beyond the size of the observable universe without pixelating. You do not need to email me asking if I have a higher resolution image. I do not. The physical limitations of our universe prevent me from providing you with an image that is any higher resolution than this one.
If you insert it into a PowerPoint presentation (a tool well-known for managing things that are the scale of the universe), you can right-click > "Ungroup" or "Create Shape" and then edit the lines and text directly. You can also change the colors this way.
Alternatively you can use a tool like Inkscape. - High resolution line chart, optimized for mobile
- Alternative high resolution line chart
- Scatterplot
- Portable line chart (png)
- Portable line chart (png), optimized for mobile
- Line chart for only Butter consumption
- Line chart for only Realty Income's stock price (O)
- AI-generated correlation image
- The spurious research paper: Bizarre Butter: Bizarre Boost or Bumbling Bubble? The Balmy Balance Between Butter Consumption and Realty Income's Royalties
Your rating skills are legendary!
Correlation ID: 3267 · Black Variable ID: 557 · Red Variable ID: 1784

