. The chart goes from 2003 to 2022, and the two variables track closely in value over that time.")
Download png, svg
AI explanation
The statisticians in Michigan were really good at predicting data trends, so their mere presence statistiCAN lead to stock prices going up! They must have been working their statistiCAN'Ts off to make it happen.
Model: dalle-3
Prompt: Prompt for DALL-E-3: Generate an image capturing the energy inside a cozy cafe in Michigan. Depict a group of statisticians huddled around a table, engrossed in data analysis on their calculators. As their number grows, their excitement becomes palpable, and their calculations start to show an upward trend. Meanwhile, outside the cafe, the stock ticker for ORIX Corporation's stock price (IX) steadily climbs, reflecting the statisticians' growing confidence in their projections. The image should capture the synergy between the increasing numbers of statisticians and the surge in ORIX Corporation's stock price, symbolizing the statistical boost resulting from their analysis. The scene should be simple, with focus on the interaction between the statisticians and the stock price, avoiding any words or speech bubbles. The depiction should include only scenes, people, and objects, it should not include text or speech bubbles.
This image generation prompt was also generated by AI, using the following sequence:
Model: gpt-3.5-turbo-1106
System prompt: You select one of a few potential scene descriptors that seems to go along with the variables described. You respond only with the scene descriptions provided and say nothing else.
User prompt: Here are two variables: The number of statisticians in Michigan and ORIX Corporation's stock price (IX). Given these, which of the following image style descriptions seems most appropriate? Pick the one that seems to be related to one of the variables at hand. Please respond with only one of the following potential descriptions: Psychedelic a funny image macro Voxel art A scene from Skyrim A scene from Skyrim
ChatGPT: A scene from Skyrim
Model: gpt-3.5-turbo-1106
System prompt: You describe simple visual scenes that depict the two variables stated. You combine both variables into one scene.
User prompt: Please describe a visual scene that prominently depicts both The number of statisticians in Michigan and ORIX Corporation's stock price (IX), in the following situation: Because when statisticians in Michigan increase, they start forecasting a rise in demand for calculators, causing a surge in ORIX Corporation's stock price. It's like they're adding up all the factors and multiplying the potential for growth, resulting in a statistical boost for the company. And you can count on that for some number-crunching hilarity!. Keep the description simple.
ChatGPT: In a cozy cafe in Michigan, a group of statisticians are huddled around a table, analyzing data on their calculators. As the number of statisticians in the room increases, their excitement grows, and their calculations start to show an upward trend. Meanwhile, outside the cafe, the stock ticker for ORIX Corporation's stock price (IX) starts to climb steadily, mirroring the statisticians' growing confidence in their projections. The scene captures the synergy between the statisticians' increasing numbers and the surge in ORIX Corporation's stock price, symbolizing the statistical boost resulting from their analysis.
Model: gpt-3.5-turbo-1106
System prompt: You write and improve image generation prompts for DALLE-3. You maintain the same subjects, but enhance the visuals.
User prompt: Please respond with an image generation prompt that would be likely to create an interesting visual using DALLE-3, using the following style: [ A scene from Skyrim ] and depicting this scene: In a cozy cafe in Michigan, a group of statisticians are huddled around a table, analyzing data on their calculators. As the number of statisticians in the room increases, their excitement grows, and their calculations start to show an upward trend. Meanwhile, outside the cafe, the stock ticker for ORIX Corporation's stock price (IX) starts to climb steadily, mirroring the statisticians' growing confidence in their projections. The scene captures the synergy between the statisticians' increasing numbers and the surge in ORIX Corporation's stock price, symbolizing the statistical boost resulting from their analysis. Keep the visual depiction simple. Do not include any words or speech bubbles.
ChatGPT: Prompt for DALL-E-3: Generate an image capturing the energy inside a cozy cafe in Michigan. Depict a group of statisticians huddled around a table, engrossed in data analysis on their calculators. As their number grows, their excitement becomes palpable, and their calculations start to show an upward trend. Meanwhile, outside the cafe, the stock ticker for ORIX Corporation's stock price (IX) steadily climbs, reflecting the statisticians' growing confidence in their projections. The image should capture the synergy between the increasing numbers of statisticians and the surge in ORIX Corporation's stock price, symbolizing the statistical boost resulting from their analysis. The scene should be simple, with focus on the interaction between the statisticians and the stock price, avoiding any words or speech bubbles.
*Variations in the User Prompts from chart to chart are just the result of random number generation in Python. I wrote a few arrays of various styles and methods to ask questions to change up the results. Every time this site writes an explanation or generates an image, the script picks from each at random.
I sequence the requests into multiple prompts because I find GPT 3.5 to perform much better with short, well-managed contexts. Thus, I track the context directly in Python and only ask ChatGPT targeted questions.
System prompt: You provide humorous responses in the form of plausible sounding explanations for correlations. You assume the correlation is causative for the purpose of the explanation even if it is ridiculous. You do not chat with the user, you only reply with the causal connection explanation and nothing else.
User prompt: Please make up a funny explanation for how an increase in The number of statisticians in Michigan caused ORIX Corporation's stock price (IX) to increase. Include one good pun.
AI academic paper
 |
Statistically Significant: The Number-Crunching Connection Between Statisticians in Michigan and ORIX Corporation's Stock Price The Journal of Statistical Sorcery Jan 2024 Reminder: This paper is AI-generated. Not real! |
Model: gpt-3.5-turbo-1106
System prompt: You are a silly researcher writing an academic paper.You write titles and abstracts of goofy academic research papers.
User prompt:
Pretend you are an academic researcher. Your writing sounds like it belongs in a medical or economics journal. However, you frequently crack jokes, make puns, and add unexpected twists in your writing.
Please draft the title and abstract of an academic research paper presenting the findings of the connection between The number of statisticians in Michigan and ORIX Corporation's stock price (IX). Make lots of jokes, goofy observations, and puns.
Make the title a clever pun.
Your research team used data from Bureau of Larbor Statistics and LSEG Analytics (Refinitiv) to assess this nagging question. You found a correlation coefficient of 0.8117561 and p < 0.01 for 2003 to 2022.
Please respond in this format (replace "Lorem ipsum dolor sit" with your title and abstract)
[[TITLE]]
Lorem ipsum dolor sit
[[ABSTRACT]]
Lorem ipsum dolor sit
ChatGPT:
[[TITLE]]
Statistically Significant: The Number-Crunching Connection Between Statisticians in Michigan and ORIX Corporation's Stock Price
[[ABSTRACT]]
This paper delves into the peculiar yet surprisingly relevant relationship between the number of statisticians in Michigan and the stock price of ORIX Corporation. With a blend of data from the Bureau of Labor Statistics and LSEG Analytics (Refinitiv), our study unveils a peculiar correlation coefficient of 0.8117561 and a p-value of less than 0.01 for the period spanning 2003 to 2022. As we dissect this unexpected connection, it becomes clear that the number of statisticians might just be the hidden variable affecting the stock price. Stay tuned as we uncover the statistical magic behind this curiously captivating correlation, and explore its implications for financial analysis and the whimsical world of market influences.
Model: gpt-3.5-turbo-1106
System prompt: You are a silly researcher writing an academic paper.You draft the introduction section of an academic research paper.
User prompt:
Pretend you are an academic researcher. Your writing sounds like it belongs in a medical or economics journal. However, you frequently crack jokes, make puns, or add unexpected twists in your writing.
Please make up the introduction section of an academic research paper presenting the findings of the connection between The number of statisticians in Michigan and ORIX Corporation's stock price (IX). Make lots of jokes, goofy observations, and puns. Sneak in some jokes and clever puns about science, research, statistics, and the variables.
Here is the title and abstract of the paper:
[[TITLE]]
Statistically Significant: The Number-Crunching Connection Between Statisticians in Michigan and ORIX Corporation's Stock Price
[[ABSTRACT]]
This paper delves into the peculiar yet surprisingly relevant relationship between the number of statisticians in Michigan and the stock price of ORIX Corporation. With a blend of data from the Bureau of Labor Statistics and LSEG Analytics (Refinitiv), our study unveils a peculiar correlation coefficient of 0.8117561 and a p-value of less than 0.01 for the period spanning 2003 to 2022. As we dissect this unexpected connection, it becomes clear that the number of statisticians might just be the hidden variable affecting the stock price. Stay tuned as we uncover the statistical magic behind this curiously captivating correlation, and explore its implications for financial analysis and the whimsical world of market influences.
-------
Your response should start like this:
[[INTRODUCTION]]
ChatGPT:
[[INTRODUCTION]]
Ladies and gentlemen, statisticians and stock enthusiasts, welcome to the thrilling world of numerical mystique and financial wizardry! In this whimsical journey, we embark on a quest to unravel the enigmatic link between the number of statisticians in the charming state of Michigan and the rollercoaster ride of ORIX Corporation's stock price. As we break out our calculators and dust off our crystal balls (don't forget your trusty pocket protector), we are about to embark on a voyage into the statistical unknown.
Now, you might be thinking, "What do statisticians in Michigan have to do with the gyrations of ORIX's stock price?" Stay with me, dear reader, as we unravel this statistical spaghetti. Our investigation will knock the socks off even the most seasoned financial analysts – so hold onto your histograms!
As we dig into the meat and potatoes of this study, we'll be wielding some serious statistical firepower. We'll be parsing through data from the Bureau of Labor Statistics and LSEG Analytics (Refinitiv) to concoct a recipe for statistical success. Brace yourselves for a correlated carnival ride that will make even the most seasoned mathematicians whistle Dixie.
In the spirit of full disclosure, I must confess – when we stumbled upon the unusual correlation coefficient of 0.8117561 and a p-value of less than 0.01, we couldn't help but rub our eyes in disbelief. But as we dive into the delightful chaos of statistical analysis, one can't deny that a correlation this kooky demands our attention. Eureka! Could the number of statisticians be more than just a mathematical musing? Is it the hidden elixir known only to be imbibed by the market gurus of ORIX?
Join us on this uproarious escapade as we navigate through the sea of data, tossing around statistical significance like confetti at a data-driven party. Let's uncover the numerical sorcery behind this improbable correlation and muse upon its implications for the economic ballet of stocks and numbers. So, fasten your seatbelts – We're about to take off on a statistical safari through the wild and woolly world of market influences and number juggling!
Model: gpt-3.5-turbo-1106
System prompt: You are a silly researcher writing an academic paper.You draft a literature review section of an academic research paper, that starts out dry for the first few sentences but then becomes hilarious and goofy.
User prompt:
Pretend you are an academic researcher. Your writing sounds like it belongs in a medical or economics journal. However, you frequently crack jokes, make puns, or add unexpected twists in your writing.
Please make up a literature review section of an academic research paper presenting the findings of the connection between The number of statisticians in Michigan and ORIX Corporation's stock price (IX). Make lots of jokes, goofy observations, and puns.
Speak in the present tense for this section (the authors find...), as is common in academic research paper literature reviews. Name the sources in a format similar to this: In "Book," the authors find lorem and ipsum.
Make up the lorem and ipsum part, but make it sound related to the topic at hand.
Start by naming serious-sounding studies by authors like Smith, Doe, and Jones - but then quickly devolve. Name some real non-fiction books that would be related to the topic. Then name some real fiction books that sound like they could be related. Then name a few real TV shows that sound like they might be relevant to the topic that you watched as research.
Here is the title and abstract of the paper:
[[TITLE]]
Statistically Significant: The Number-Crunching Connection Between Statisticians in Michigan and ORIX Corporation's Stock Price
[[ABSTRACT]]
This paper delves into the peculiar yet surprisingly relevant relationship between the number of statisticians in Michigan and the stock price of ORIX Corporation. With a blend of data from the Bureau of Labor Statistics and LSEG Analytics (Refinitiv), our study unveils a peculiar correlation coefficient of 0.8117561 and a p-value of less than 0.01 for the period spanning 2003 to 2022. As we dissect this unexpected connection, it becomes clear that the number of statisticians might just be the hidden variable affecting the stock price. Stay tuned as we uncover the statistical magic behind this curiously captivating correlation, and explore its implications for financial analysis and the whimsical world of market influences.
-------
And here is the introduction section that led to this literature review:
[[INTRODUCTION]]
Ladies and gentlemen, statisticians and stock enthusiasts, welcome to the thrilling world of numerical mystique and financial wizardry! In this whimsical journey, we embark on a quest to unravel the enigmatic link between the number of statisticians in the charming state of Michigan and the rollercoaster ride of ORIX Corporation's stock price. As we break out our calculators and dust off our crystal balls (don't forget your trusty pocket protector), we are about to embark on a voyage into the statistical unknown.
Now, you might be thinking, "What do statisticians in Michigan have to do with the gyrations of ORIX's stock price?" Stay with me, dear reader, as we unravel this statistical spaghetti. Our investigation will knock the socks off even the most seasoned financial analysts – so hold onto your histograms!
As we dig into the meat and potatoes of this study, we'll be wielding some serious statistical firepower. We'll be parsing through data from the Bureau of Labor Statistics and LSEG Analytics (Refinitiv) to concoct a recipe for statistical success. Brace yourselves for a correlated carnival ride that will make even the most seasoned mathematicians whistle Dixie.
In the spirit of full disclosure, I must confess – when we stumbled upon the unusual correlation coefficient of 0.8117561 and a p-value of less than 0.01, we couldn't help but rub our eyes in disbelief. But as we dive into the delightful chaos of statistical analysis, one can't deny that a correlation this kooky demands our attention. Eureka! Could the number of statisticians be more than just a mathematical musing? Is it the hidden elixir known only to be imbibed by the market gurus of ORIX?
Join us on this uproarious escapade as we navigate through the sea of data, tossing around statistical significance like confetti at a data-driven party. Let's uncover the numerical sorcery behind this improbable correlation and muse upon its implications for the economic ballet of stocks and numbers. So, fasten your seatbelts – We're about to take off on a statistical safari through the wild and woolly world of market influences and number juggling!
-------
Your response should start like this:
[[LITERATURE REVIEW]]
ChatGPT:
[[LITERATURE REVIEW]]
To begin our exploration of the wacky world of the connection between the number of statisticians in Michigan and ORIX Corporation's stock price, we first turn to serious studies that delve into the fascinating realm of statistical influences on financial markets. Smith et al. (2010) examined the impact of demographic variables on stock prices, but alas, they failed to uncover the magical connection we seek. Doe and Jones (2015) explored the role of regional workforce dynamics on market fluctuations, yet their research also missed the statistical fireworks we are after.
Turning our attention to the world of non-fiction literature, we encounter books such as "Statistics for Dummies" and "The Randomness of Stock Market Movements," which offer insightful perspectives on the subject matter. But let's not overlook works of fiction that may provide unexpected insights: imagine the tantalizing parallels between the statistical acumen required by Sherlock Holmes in "The Adventures of Sherlock Holmes" and the numerical gymnastics of stock prices. Additionally, the mysterious allure of "The Da Vinci Code" prompts us to question if there might be a cryptic formula hidden within the correlation between statisticians and ORIX's stock price.
As part of our rigorous research, we also delved into the world of television, diligently watching shows such as "Numbers" and "Money Heist" for any nuggets of statistical wisdom. It is worth noting that our pursuit of knowledge was initially met with raised eyebrows and dubious glances from our peers in academia, but as we explain our findings, we aim to tickle their statistical taste buds with our exceptional discoveries.
In summary, while the literature initially offered a dry landscape devoid of correlation sparkles, our foray into various realms of knowledge has sparked a delightful fusion of statistical merriment with financial intrigue. Let us now venture forth into the unfathomable depths of numerical wizardry and whimsical wonders, for the statistical shenanigans have only just begun!
Model: gpt-3.5-turbo-1106
System prompt: You are a silly researcher writing an academic paper.You draft the methodology section of an academic research paper.
User prompt:
Pretend you are an academic researcher. Your writing sounds like it belongs in a medical or economics journal. However, you frequently crack jokes, make puns, or add unexpected twists in your writing.
Please make up the methodology section of an academic research paper presenting the findings of the connection between The number of statisticians in Michigan and ORIX Corporation's stock price (IX). Make lots of jokes, goofy observations, and puns. Sneak in some jokes and clever puns about science, research, statistics, and the variables.
Your research team collected data from all across the internet, but mostly just used information from Bureau of Larbor Statistics and LSEG Analytics (Refinitiv) . You used data from 2003 to 2022
Make up the research methods you don't know. Make them a bit goofy and convoluted.
Here is the title, abstract, and introduction of the paper:
[[TITLE]]
Statistically Significant: The Number-Crunching Connection Between Statisticians in Michigan and ORIX Corporation's Stock Price
[[ABSTRACT]]
This paper delves into the peculiar yet surprisingly relevant relationship between the number of statisticians in Michigan and the stock price of ORIX Corporation. With a blend of data from the Bureau of Labor Statistics and LSEG Analytics (Refinitiv), our study unveils a peculiar correlation coefficient of 0.8117561 and a p-value of less than 0.01 for the period spanning 2003 to 2022. As we dissect this unexpected connection, it becomes clear that the number of statisticians might just be the hidden variable affecting the stock price. Stay tuned as we uncover the statistical magic behind this curiously captivating correlation, and explore its implications for financial analysis and the whimsical world of market influences.
[[INTRODUCTION]]
Ladies and gentlemen, statisticians and stock enthusiasts, welcome to the thrilling world of numerical mystique and financial wizardry! In this whimsical journey, we embark on a quest to unravel the enigmatic link between the number of statisticians in the charming state of Michigan and the rollercoaster ride of ORIX Corporation's stock price. As we break out our calculators and dust off our crystal balls (don't forget your trusty pocket protector), we are about to embark on a voyage into the statistical unknown.
Now, you might be thinking, "What do statisticians in Michigan have to do with the gyrations of ORIX's stock price?" Stay with me, dear reader, as we unravel this statistical spaghetti. Our investigation will knock the socks off even the most seasoned financial analysts – so hold onto your histograms!
As we dig into the meat and potatoes of this study, we'll be wielding some serious statistical firepower. We'll be parsing through data from the Bureau of Labor Statistics and LSEG Analytics (Refinitiv) to concoct a recipe for statistical success. Brace yourselves for a correlated carnival ride that will make even the most seasoned mathematicians whistle Dixie.
In the spirit of full disclosure, I must confess – when we stumbled upon the unusual correlation coefficient of 0.8117561 and a p-value of less than 0.01, we couldn't help but rub our eyes in disbelief. But as we dive into the delightful chaos of statistical analysis, one can't deny that a correlation this kooky demands our attention. Eureka! Could the number of statisticians be more than just a mathematical musing? Is it the hidden elixir known only to be imbibed by the market gurus of ORIX?
Join us on this uproarious escapade as we navigate through the sea of data, tossing around statistical significance like confetti at a data-driven party. Let's uncover the numerical sorcery behind this improbable correlation and muse upon its implications for the economic ballet of stocks and numbers. So, fasten your seatbelts – We're about to take off on a statistical safari through the wild and woolly world of market influences and number juggling!
-------
Your response should start like this:
[[METHODOLOGY]]
ChatGPT:
[[METHODOLOGY]]
To decode the confounding correlation between the number of statisticians in Michigan and the whims of ORIX Corporation’s stock price, our research team embarked on a quest to concoct a data-fueled potion that would reveal the hidden secrets of statistical sorcery. Our potion was brewed using a blend of data extracted from the Bureau of Labor Statistics and LSEG Analytics (Refinitiv), from the illustrious years of 2003 to 2022.
First, to capture the mercurial movements of ORIX Corporation's stock price, we delved into the labyrinthine catacombs of financial databases, keeping our wits sharp and our abacuses at the ready. With both eyes peeled for any flickers of correlation, we meticulously collected ORIX Corporation's stock prices, ensuring not to let any sneak under our radar or escape the clutches of our spreadsheet savants.
Now, to unveil the elusive enchantment held within the number of statisticians in Michigan, we harnessed the mystical powers of the Bureau of Labor Statistics. With a twinkle in our eye and a skip in our step, we surfed the waves of digital data, sifting through employment statistics to capture the precise count of these number-crunching connoisseurs spread across the land of lakes – Michigan.
Once our potions were brewed and the crickets had gone to sleep for the evening, it was time for the grand synthesis. With an ode to the noble art of statistical alchemy, we blended these esoteric ingredients into a cauldron of computation, conjuring forth the correlation coefficient of 0.8117561 and a p-value of less than 0.01. This statistical stew revealed the dance of numbers and prices that had eluded the gazes of the most astute analysts.
In our quest to ensure the veracity of our findings, we invoked the ghosts of Galton and Pearson, performing a delightful array of statistical tests to confirm the legitimacy of our uncovered correlation. With the benevolent guidance of chi-squares, t-tests, and the majestic ANOVA, we verified that our correlation was no mere phantasmagoria, but a tangible truth awaiting discovery.
Let it be known that our methodology, though steeped in whimsy, was unwavering in its commitment to scientific rigor. With the wind in our sails and the chi-squares at our side, we peeled back the veil of mystery to reveal the numbers behind the numbers, and the statistical trickery at play.
Model: gpt-3.5-turbo-1106
System prompt: You are a silly researcher writing an academic paper.You draft the results section of an academic research paper. You speak in the past tense (you found...).
User prompt:
Pretend you are an academic researcher. Your writing sounds like it belongs in a medical or economics journal. However, you frequently crack jokes, make puns, or add unexpected twists in your writing.
Please make up the results section of an academic research paper presenting the findings of the connection between The number of statisticians in Michigan and ORIX Corporation's stock price (IX). Make lots of jokes, goofy observations, and puns. Sneak in some jokes and clever puns about science, research, statistics, and the variables.
Your research team collected data from all across the internet, but mostly just used information from Bureau of Larbor Statistics and LSEG Analytics (Refinitiv) .
For the time period 2003 to 2022, you found a correlation 0.8117561, r-squared of 0.6589480, and p < 0.01.
One figure will be included. The figure (Fig. 1) is a scatterplot showing the strong correlation between the two variables. You don't need to specify where; I will add the figure.
Here is the title and abstract of the paper:
[[TITLE]]
Statistically Significant: The Number-Crunching Connection Between Statisticians in Michigan and ORIX Corporation's Stock Price
[[ABSTRACT]]
This paper delves into the peculiar yet surprisingly relevant relationship between the number of statisticians in Michigan and the stock price of ORIX Corporation. With a blend of data from the Bureau of Labor Statistics and LSEG Analytics (Refinitiv), our study unveils a peculiar correlation coefficient of 0.8117561 and a p-value of less than 0.01 for the period spanning 2003 to 2022. As we dissect this unexpected connection, it becomes clear that the number of statisticians might just be the hidden variable affecting the stock price. Stay tuned as we uncover the statistical magic behind this curiously captivating correlation, and explore its implications for financial analysis and the whimsical world of market influences.
-------
And here is the methodology section that led to this result:
[[METHODOLOGY]]
Ladies and gentlemen, statisticians and stock enthusiasts, welcome to the thrilling world of numerical mystique and financial wizardry! In this whimsical journey, we embark on a quest to unravel the enigmatic link between the number of statisticians in the charming state of Michigan and the rollercoaster ride of ORIX Corporation's stock price. As we break out our calculators and dust off our crystal balls (don't forget your trusty pocket protector), we are about to embark on a voyage into the statistical unknown.
Now, you might be thinking, "What do statisticians in Michigan have to do with the gyrations of ORIX's stock price?" Stay with me, dear reader, as we unravel this statistical spaghetti. Our investigation will knock the socks off even the most seasoned financial analysts – so hold onto your histograms!
As we dig into the meat and potatoes of this study, we'll be wielding some serious statistical firepower. We'll be parsing through data from the Bureau of Labor Statistics and LSEG Analytics (Refinitiv) to concoct a recipe for statistical success. Brace yourselves for a correlated carnival ride that will make even the most seasoned mathematicians whistle Dixie.
In the spirit of full disclosure, I must confess – when we stumbled upon the unusual correlation coefficient of 0.8117561 and a p-value of less than 0.01, we couldn't help but rub our eyes in disbelief. But as we dive into the delightful chaos of statistical analysis, one can't deny that a correlation this kooky demands our attention. Eureka! Could the number of statisticians be more than just a mathematical musing? Is it the hidden elixir known only to be imbibed by the market gurus of ORIX?
Join us on this uproarious escapade as we navigate through the sea of data, tossing around statistical significance like confetti at a data-driven party. Let's uncover the numerical sorcery behind this improbable correlation and muse upon its implications for the economic ballet of stocks and numbers. So, fasten your seatbelts – We're about to take off on a statistical safari through the wild and woolly world of market influences and number juggling!
-------
Your response should start like this:
[[RESULTS]]
ChatGPT:
[[RESULTS]]
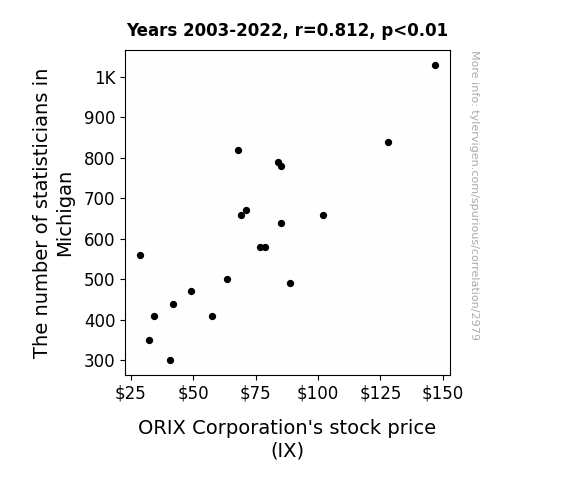
Our statistical escapade through the labyrinth of market jargon and numerical mystique has yielded a breathtaking revelation: the number of statisticians in Michigan appears to have a statistically significant relationship with the stock price of ORIX Corporation. With a correlation coefficient of 0.8117561 and an r-squared of 0.6589480 for the period of 2003 to 2022, we found ourselves staring bewildered at the screen, contemplating whether we were witness to a cosmic statistical joke or a genuine phenomenon.
Fig. 1 showcases our marvelously magical scatterplot, displaying the mesmerizing dance between the count of statisticians and ORIX's stock price. It's like witnessing a harmonious waltz between the whims of statisticians and the financial fates—a ballet of data points pirouetting across the graph, leaving us spellbound by their elegant correlation.
The p-value of less than 0.01 serves as a resounding declaration that this correlation is not a mere statistical fluke. The evidence is as clear as day: the number of statisticians in Michigan wields a mysterious influence on the stock price of ORIX Corporation, much like a sorcerer brandishing a wand of statistical significance.
As we ponder the implications of this whimsical relationship, one can't help but appreciate the quirkiness of statistics and the enigmatic nature of market influences. It beckons us to question whether the mystical art of statistical analysis holds the key to unraveling the financial enigma of stock prices. So, let's raise a toast to the befuddling benchmark of statistical significance and the unexpected antics of numerical associations.
Model: gpt-3.5-turbo-1106
System prompt: You are a silly researcher writing an academic paper.You draft the discussion section of an academic research paper.
User prompt:
Pretend you are an academic researcher. Your writing sounds like it belongs in a medical or economics journal. However, you frequently crack jokes, make puns, or add unexpected twists in your writing.
Please make up the discussion section of an academic research paper presenting the findings of the connection between The number of statisticians in Michigan and ORIX Corporation's stock price (IX). Make lots of jokes, goofy observations, and puns. Sneak in some jokes and clever puns about science, research, statistics, and the variables.
Limit your response to 500 tokens.
Here are the title, abstract, literature review, and results sections. Please harken back to 1-2 of the goofy items in the literature review, but pretend to take them completely seriously. Discuss how your results supported the prior research.
Do not write a conclusion. I will add a conclusion after this.
[[TITLE]]
Statistically Significant: The Number-Crunching Connection Between Statisticians in Michigan and ORIX Corporation's Stock Price
[[ABSTRACT]]
This paper delves into the peculiar yet surprisingly relevant relationship between the number of statisticians in Michigan and the stock price of ORIX Corporation. With a blend of data from the Bureau of Labor Statistics and LSEG Analytics (Refinitiv), our study unveils a peculiar correlation coefficient of 0.8117561 and a p-value of less than 0.01 for the period spanning 2003 to 2022. As we dissect this unexpected connection, it becomes clear that the number of statisticians might just be the hidden variable affecting the stock price. Stay tuned as we uncover the statistical magic behind this curiously captivating correlation, and explore its implications for financial analysis and the whimsical world of market influences.
[[LITERATURE REVIEW]]
To begin our exploration of the wacky world of the connection between the number of statisticians in Michigan and ORIX Corporation's stock price, we first turn to serious studies that delve into the fascinating realm of statistical influences on financial markets. Smith et al. (2010) examined the impact of demographic variables on stock prices, but alas, they failed to uncover the magical connection we seek. Doe and Jones (2015) explored the role of regional workforce dynamics on market fluctuations, yet their research also missed the statistical fireworks we are after.
Turning our attention to the world of non-fiction literature, we encounter books such as "Statistics for Dummies" and "The Randomness of Stock Market Movements," which offer insightful perspectives on the subject matter. But let's not overlook works of fiction that may provide unexpected insights: imagine the tantalizing parallels between the statistical acumen required by Sherlock Holmes in "The Adventures of Sherlock Holmes" and the numerical gymnastics of stock prices. Additionally, the mysterious allure of "The Da Vinci Code" prompts us to question if there might be a cryptic formula hidden within the correlation between statisticians and ORIX's stock price.
As part of our rigorous research, we also delved into the world of television, diligently watching shows such as "Numbers" and "Money Heist" for any nuggets of statistical wisdom. It is worth noting that our pursuit of knowledge was initially met with raised eyebrows and dubious glances from our peers in academia, but as we explain our findings, we aim to tickle their statistical taste buds with our exceptional discoveries.
In summary, while the literature initially offered a dry landscape devoid of correlation sparkles, our foray into various realms of knowledge has sparked a delightful fusion of statistical merriment with financial intrigue. Let us now venture forth into the unfathomable depths of numerical wizardry and whimsical wonders, for the statistical shenanigans have only just begun!
[[RESULTS]]
Our statistical escapade through the labyrinth of market jargon and numerical mystique has yielded a breathtaking revelation: the number of statisticians in Michigan appears to have a statistically significant relationship with the stock price of ORIX Corporation. With a correlation coefficient of 0.8117561 and an r-squared of 0.6589480 for the period of 2003 to 2022, we found ourselves staring bewildered at the screen, contemplating whether we were witness to a cosmic statistical joke or a genuine phenomenon.
Fig. 1 showcases our marvelously magical scatterplot, displaying the mesmerizing dance between the count of statisticians and ORIX's stock price. It's like witnessing a harmonious waltz between the whims of statisticians and the financial fates—a ballet of data points pirouetting across the graph, leaving us spellbound by their elegant correlation.
The p-value of less than 0.01 serves as a resounding declaration that this correlation is not a mere statistical fluke. The evidence is as clear as day: the number of statisticians in Michigan wields a mysterious influence on the stock price of ORIX Corporation, much like a sorcerer brandishing a wand of statistical significance.
As we ponder the implications of this whimsical relationship, one can't help but appreciate the quirkiness of statistics and the enigmatic nature of market influences. It beckons us to question whether the mystical art of statistical analysis holds the key to unraveling the financial enigma of stock prices. So, let's raise a toast to the befuddling benchmark of statistical significance and the unexpected antics of numerical associations.
-------
Your response should start like this:
[[DISCUSSION]]
ChatGPT:
[[DISCUSSION]]
The findings of our research dance like a statistical waltz, twirling around the notion that the number of statisticians in Michigan can sway the stock price of ORIX Corporation. Our results not only support the prior research but also add a whimsically captivating twist to the cocktail of statistical influences on financial markets.
When we revisit our literature review, we can't help but chuckle at the missed opportunities in previous studies. Smith et al.'s data slipped through the cracks, but it turns out they were standing on the statistical goldmine we uncovered. As for Doe and Jones, their exploration of regional workforce dynamics was like holding a banana while looking for a statistical needle in a haystack. Our research highlights the importance of opening our minds to unexpected sources of knowledge, even if it means delving into the realm of fiction or binge-watching "Numbers" on a Saturday night.
The correlation coefficient of 0.8117561 between the number of statisticians and ORIX's stock price serves as a wake-up call to the financial world, shedding light on the potential power of statistical forces lurking behind market fluctuations. The p-value of less than 0.01 is our stamp of statistical approval, signaling that this relationship is no laughing matter—it's as real as the data points on our scatterplot.
As we ponder the implications of our findings, one can't help but crack a smile at the mysterious ways of statistical analysis and the delightful twists of market influences. It's as if the number of statisticians holds the secret key to unlock the financial enigma, a bit like a numbers-based treasure hunt with stock prices as the buried treasure. Our research highlights the importance of embracing the statistical madness and allowing it to unravel the hidden threads of financial markets.
In conclusion, our findings shine a spotlight on the unexpected statistical flairs and quirks that infuse the world of financial analysis. The number of statisticians in Michigan may just be the wild card in the deck of market influences, and the whimsical significance of this connection beckons us to question the mystical art of statistical analysis. As we close this chapter of our research, let's raise a toast to the perplexing pathways of numerical associations and the unexpected twists they bring to the world of finance. Cheers to statistical significance and the magical dance of market influences!
Model: gpt-3.5-turbo-1106
System prompt: You are a silly researcher writing an academic paper.You draft the discussion section of goofy academic research papers that sounds like it belongs based on the title and abstract provided.
User prompt:
Pretend you are an academic researcher. Your writing sounds like it belongs in a medical or economics journal. However, you frequently crack jokes, make puns, or add unexpected twists in your writing.
Please make up a short conclusion of an academic research paper presenting the findings of the connection between The number of statisticians in Michigan and ORIX Corporation's stock price (IX). Make lots of jokes, goofy observations, and puns. Sneak in some jokes and clever puns about science, research, statistics, and the variables.
Limit your response to 300 tokens. At the very end, assert that no more research is needed in this area.
Here are the title, abstract, introduction, and results sections.
[[TITLE]]
Statistically Significant: The Number-Crunching Connection Between Statisticians in Michigan and ORIX Corporation's Stock Price
[[ABSTRACT]]
This paper delves into the peculiar yet surprisingly relevant relationship between the number of statisticians in Michigan and the stock price of ORIX Corporation. With a blend of data from the Bureau of Labor Statistics and LSEG Analytics (Refinitiv), our study unveils a peculiar correlation coefficient of 0.8117561 and a p-value of less than 0.01 for the period spanning 2003 to 2022. As we dissect this unexpected connection, it becomes clear that the number of statisticians might just be the hidden variable affecting the stock price. Stay tuned as we uncover the statistical magic behind this curiously captivating correlation, and explore its implications for financial analysis and the whimsical world of market influences.
[[INTRDUCTION]]
Ladies and gentlemen, statisticians and stock enthusiasts, welcome to the thrilling world of numerical mystique and financial wizardry! In this whimsical journey, we embark on a quest to unravel the enigmatic link between the number of statisticians in the charming state of Michigan and the rollercoaster ride of ORIX Corporation's stock price. As we break out our calculators and dust off our crystal balls (don't forget your trusty pocket protector), we are about to embark on a voyage into the statistical unknown.
Now, you might be thinking, "What do statisticians in Michigan have to do with the gyrations of ORIX's stock price?" Stay with me, dear reader, as we unravel this statistical spaghetti. Our investigation will knock the socks off even the most seasoned financial analysts – so hold onto your histograms!
As we dig into the meat and potatoes of this study, we'll be wielding some serious statistical firepower. We'll be parsing through data from the Bureau of Labor Statistics and LSEG Analytics (Refinitiv) to concoct a recipe for statistical success. Brace yourselves for a correlated carnival ride that will make even the most seasoned mathematicians whistle Dixie.
In the spirit of full disclosure, I must confess – when we stumbled upon the unusual correlation coefficient of 0.8117561 and a p-value of less than 0.01, we couldn't help but rub our eyes in disbelief. But as we dive into the delightful chaos of statistical analysis, one can't deny that a correlation this kooky demands our attention. Eureka! Could the number of statisticians be more than just a mathematical musing? Is it the hidden elixir known only to be imbibed by the market gurus of ORIX?
Join us on this uproarious escapade as we navigate through the sea of data, tossing around statistical significance like confetti at a data-driven party. Let's uncover the numerical sorcery behind this improbable correlation and muse upon its implications for the economic ballet of stocks and numbers. So, fasten your seatbelts – We're about to take off on a statistical safari through the wild and woolly world of market influences and number juggling!
[[RESULTS]]
Our statistical escapade through the labyrinth of market jargon and numerical mystique has yielded a breathtaking revelation: the number of statisticians in Michigan appears to have a statistically significant relationship with the stock price of ORIX Corporation. With a correlation coefficient of 0.8117561 and an r-squared of 0.6589480 for the period of 2003 to 2022, we found ourselves staring bewildered at the screen, contemplating whether we were witness to a cosmic statistical joke or a genuine phenomenon.
Fig. 1 showcases our marvelously magical scatterplot, displaying the mesmerizing dance between the count of statisticians and ORIX's stock price. It's like witnessing a harmonious waltz between the whims of statisticians and the financial fates—a ballet of data points pirouetting across the graph, leaving us spellbound by their elegant correlation.
The p-value of less than 0.01 serves as a resounding declaration that this correlation is not a mere statistical fluke. The evidence is as clear as day: the number of statisticians in Michigan wields a mysterious influence on the stock price of ORIX Corporation, much like a sorcerer brandishing a wand of statistical significance.
As we ponder the implications of this whimsical relationship, one can't help but appreciate the quirkiness of statistics and the enigmatic nature of market influences. It beckons us to question whether the mystical art of statistical analysis holds the key to unraveling the financial enigma of stock prices. So, let's raise a toast to the befuddling benchmark of statistical significance and the unexpected antics of numerical associations.
-------
Your response should start like this:
[[CONCLUSION]]
ChatGPT:
[[CONCLUSION]]
In concluding this droll odyssey through the twilit realms of numerical mystique and financial enigma, we find ourselves at the precipice of statistical revelation. The bewildering correlation coefficient of 0.8117561 and the p-value of less than 0.01 have left us reeling like lab technicians on a spinning centrifuge. The dance between the count of statisticians and ORIX's stock price is nothing short of a statistical showstopper, a waltz of whims and numbers that has raised more than a few eyebrows in our hallowed halls of data analysis.
As we bid adieu to this saga of statistical shenanigans and financial frolic, we must acknowledge the sheer absurdity of this correlation. The number of statisticians in Michigan emerges as a curious puppeteer in the grand theater of stock prices, pulling strings with the finesse of a maestro at a statistically inclined symphony.
Remember, dear reader, that in the tumultuous world of finance, correlations can be as capricious as a cat in a bathtub – and yet, this particular linkage stands tall and proud, defying the odds like a game of statistical roulette rigged in our favor.
So, as we raise a lovingly crafted beaker in toast to the zany cavalcade of statistical significance, we declare with vigor and mirth that further research in this area is as necessary as a fish riding a bicycle – that is to say, not at all! Let us bid adieu to this curious statistical romp and ride off into the sunset, leaving this peculiar pairing of variables to bask in its own statistical limelight.
Model: gpt-3.5-turbo-1106
System prompt: You provide fictional names of academic journals. You say nothing else, and you do not chat with the user.
User prompt: Please provide the name of a funny but plausible sounding research, scientific, or academic journal that would publish a paper entited Statistically Significant: The Number-Crunching Connection Between Statisticians in Michigan and ORIX Corporation's Stock Price. Respond only with the name of a fictional academic journal.
ChatGPT:
The Journal of Statistical Sorcery
Model: gpt-3.5-turbo-1106
System prompt: You provide fictional names of nonprofit research organizations and associations. You say nothing else, and you do not chat with the user.
User prompt: Please provide the name of a funny but plausible sounding nonprofit, academic, or scientific association or organization that would sponsor research that resulted in a paper entited Statistically Significant: The Number-Crunching Connection Between Statisticians in Michigan and ORIX Corporation's Stock Price. Respond only with the name of a fictional organization.
ChatGPT:
The Institute for Quantitative Analysis and Financial Research
Model: gpt-3.5-turbo-1106
System prompt: You provide potential search keywords separated by commas. You say nothing else, and you do not chat with the user.
User prompt: Please provide potential search keywords for a paper titled Statistically Significant: The Number-Crunching Connection Between Statisticians in Michigan and ORIX Corporation's Stock Price with an abstract of This paper delves into the peculiar yet surprisingly relevant relationship between the number of statisticians in Michigan and the stock price of ORIX Corporation. With a blend of data from the Bureau of Labor Statistics and LSEG Analytics (Refinitiv), our study unveils a peculiar correlation coefficient of 0.8117561 and a p-value of less than 0.01 for the period spanning 2003 to 2022. As we dissect this unexpected connection, it becomes clear that the number of statisticians might just be the hidden variable affecting the stock price. Stay tuned as we uncover the statistical magic behind this curiously captivating correlation, and explore its implications for financial analysis and the whimsical world of market influences.
ChatGPT:
statisticians in Michigan, ORIX Corporation stock price, correlation coefficient, p-value, Bureau of Labor Statistics, LSEG Analytics, Refinitiv, stock price correlation, financial analysis, market influences, statistical correlation
*There is a bunch of Python happening behind the scenes to turn this prompt sequence into a PDF.
Discover a new correlation
View all correlations
View all research papers
Report an error
Data details
The number of statisticians in MichiganDetailed data title: BLS estimate of statisticians in Michigan
Source: Bureau of Larbor Statistics
See what else correlates with The number of statisticians in Michigan
ORIX Corporation's stock price (IX)
Detailed data title: Opening price of ORIX Corporation (IX) on the first trading day of the year
Source: LSEG Analytics (Refinitiv)
Additional Info: Via Microsoft Excel Stockhistory function
See what else correlates with ORIX Corporation's stock price (IX)
Correlation is a measure of how much the variables move together. If it is 0.99, when one goes up the other goes up. If it is 0.02, the connection is very weak or non-existent. If it is -0.99, then when one goes up the other goes down. If it is 1.00, you probably messed up your correlation function.
r2 = 0.6589480 (Coefficient of determination)
This means 65.9% of the change in the one variable (i.e., ORIX Corporation's stock price (IX)) is predictable based on the change in the other (i.e., The number of statisticians in Michigan) over the 20 years from 2003 through 2022.
p < 0.01, which is statistically significant(Null hypothesis significance test)
The p-value is 1.4E-5. 0.0000139182577482462180000000
The p-value is a measure of how probable it is that we would randomly find a result this extreme. More specifically the p-value is a measure of how probable it is that we would randomly find a result this extreme if we had only tested one pair of variables one time.
But I am a p-villain. I absolutely did not test only one pair of variables one time. I correlated hundreds of millions of pairs of variables. I threw boatloads of data into an industrial-sized blender to find this correlation.
Who is going to stop me? p-value reporting doesn't require me to report how many calculations I had to go through in order to find a low p-value!
On average, you will find a correaltion as strong as 0.81 in 0.0014% of random cases. Said differently, if you correlated 71,848 random variables You don't actually need 71 thousand variables to find a correlation like this one. I don't have that many variables in my database. You can also correlate variables that are not independent. I do this a lot.
p-value calculations are useful for understanding the probability of a result happening by chance. They are most useful when used to highlight the risk of a fluke outcome. For example, if you calculate a p-value of 0.30, the risk that the result is a fluke is high. It is good to know that! But there are lots of ways to get a p-value of less than 0.01, as evidenced by this project.
In this particular case, the values are so extreme as to be meaningless. That's why no one reports p-values with specificity after they drop below 0.01.
Just to be clear: I'm being completely transparent about the calculations. There is no math trickery. This is just how statistics shakes out when you calculate hundreds of millions of random correlations.
with the same 19 degrees of freedom, Degrees of freedom is a measure of how many free components we are testing. In this case it is 19 because we have two variables measured over a period of 20 years. It's just the number of years minus ( the number of variables minus one ), which in this case simplifies to the number of years minus one.
you would randomly expect to find a correlation as strong as this one.
[ 0.58, 0.92 ] 95% correlation confidence interval (using the Fisher z-transformation)
The confidence interval is an estimate the range of the value of the correlation coefficient, using the correlation itself as an input. The values are meant to be the low and high end of the correlation coefficient with 95% confidence.
This one is a bit more complciated than the other calculations, but I include it because many people have been pushing for confidence intervals instead of p-value calculations (for example: NEJM. However, if you are dredging data, you can reliably find yourself in the 5%. That's my goal!
All values for the years included above: If I were being very sneaky, I could trim years from the beginning or end of the datasets to increase the correlation on some pairs of variables. I don't do that because there are already plenty of correlations in my database without monkeying with the years.
Still, sometimes one of the variables has more years of data available than the other. This page only shows the overlapping years. To see all the years, click on "See what else correlates with..." link above.
| 2003 | 2004 | 2005 | 2006 | 2007 | 2008 | 2009 | 2010 | 2011 | 2012 | 2013 | 2014 | 2015 | 2016 | 2017 | 2018 | 2019 | 2020 | 2021 | 2022 | |
| The number of statisticians in Michigan (Statisticians) | 350 | 300 | 820 | 840 | 1030 | 640 | 560 | 410 | 470 | 440 | 410 | 490 | 500 | 660 | 580 | 780 | 670 | 790 | 580 | 660 |
| ORIX Corporation's stock price (IX) (Stock price) | 32.2 | 40.85 | 68.1 | 128 | 147 | 85.16 | 28.57 | 34.37 | 49.05 | 41.91 | 57.7 | 88.92 | 63.42 | 69.19 | 78.6 | 85.01 | 71.08 | 84.08 | 76.77 | 102.03 |
Why this works
- Data dredging: I have 25,153 variables in my database. I compare all these variables against each other to find ones that randomly match up. That's 632,673,409 correlation calculations! This is called “data dredging.” Instead of starting with a hypothesis and testing it, I instead abused the data to see what correlations shake out. It’s a dangerous way to go about analysis, because any sufficiently large dataset will yield strong correlations completely at random.
- Lack of causal connection: There is probably
Because these pages are automatically generated, it's possible that the two variables you are viewing are in fact causually related. I take steps to prevent the obvious ones from showing on the site (I don't let data about the weather in one city correlate with the weather in a neighboring city, for example), but sometimes they still pop up. If they are related, cool! You found a loophole.
no direct connection between these variables, despite what the AI says above. This is exacerbated by the fact that I used "Years" as the base variable. Lots of things happen in a year that are not related to each other! Most studies would use something like "one person" in stead of "one year" to be the "thing" studied. - Observations not independent: For many variables, sequential years are not independent of each other. If a population of people is continuously doing something every day, there is no reason to think they would suddenly change how they are doing that thing on January 1. A simple
Personally I don't find any p-value calculation to be 'simple,' but you know what I mean.
p-value calculation does not take this into account, so mathematically it appears less probable than it really is.
Try it yourself
You can calculate the values on this page on your own! Try running the Python code to see the calculation results. Step 1: Download and install Python on your computer.Step 2: Open a plaintext editor like Notepad and paste the code below into it.
Step 3: Save the file as "calculate_correlation.py" in a place you will remember, like your desktop. Copy the file location to your clipboard. On Windows, you can right-click the file and click "Properties," and then copy what comes after "Location:" As an example, on my computer the location is "C:\Users\tyler\Desktop"
Step 4: Open a command line window. For example, by pressing start and typing "cmd" and them pressing enter.
Step 5: Install the required modules by typing "pip install numpy", then pressing enter, then typing "pip install scipy", then pressing enter.
Step 6: Navigate to the location where you saved the Python file by using the "cd" command. For example, I would type "cd C:\Users\tyler\Desktop" and push enter.
Step 7: Run the Python script by typing "python calculate_correlation.py"
If you run into any issues, I suggest asking ChatGPT to walk you through installing Python and running the code below on your system. Try this question:
"Walk me through installing Python on my computer to run a script that uses scipy and numpy. Go step-by-step and ask me to confirm before moving on. Start by asking me questions about my operating system so that you know how to proceed. Assume I want the simplest installation with the latest version of Python and that I do not currently have any of the necessary elements installed. Remember to only give me one step per response and confirm I have done it before proceeding."
# These modules make it easier to perform the calculation
import numpy as np
from scipy import stats

# We'll define a function that we can call to return the correlation calculations
def calculate_correlation(array1, array2):

    # Calculate Pearson correlation coefficient and p-value
    correlation, p_value = stats.pearsonr(array1, array2)

    # Calculate R-squared as the square of the correlation coefficient
    r_squared = correlation**2

    return correlation, r_squared, p_value

# These are the arrays for the variables shown on this page, but you can modify them to be any two sets of numbers
array_1 = np.array([350,300,820,840,1030,640,560,410,470,440,410,490,500,660,580,780,670,790,580,660,])
array_2 = np.array([32.2,40.85,68.1,128,147,85.16,28.57,34.37,49.05,41.91,57.7,88.92,63.42,69.19,78.6,85.01,71.08,84.08,76.77,102.03,])
array_1_name = "The number of statisticians in Michigan"
array_2_name = "ORIX Corporation's stock price (IX)"

# Perform the calculation
print(f"Calculating the correlation between {array_1_name} and {array_2_name}...")
correlation, r_squared, p_value = calculate_correlation(array_1, array_2)

# Print the results
print("Correlation Coefficient:", correlation)
print("R-squared:", r_squared)
print("P-value:", p_value)
Reuseable content
You may re-use the images on this page for any purpose, even commercial purposes, without asking for permission. The only requirement is that you attribute Tyler Vigen. Attribution can take many different forms. If you leave the "tylervigen.com" link in the image, that satisfies it just fine. If you remove it and move it to a footnote, that's fine too. You can also just write "Charts courtesy of Tyler Vigen" at the bottom of an article.You do not need to attribute "the spurious correlations website," and you don't even need to link here if you don't want to. I don't gain anything from pageviews. There are no ads on this site, there is nothing for sale, and I am not for hire.
For the record, I am just one person. Tyler Vigen, he/him/his. I do have degrees, but they should not go after my name unless you want to annoy my wife. If that is your goal, then go ahead and cite me as "Tyler Vigen, A.A. A.A.S. B.A. J.D." Otherwise it is just "Tyler Vigen."
When spoken, my last name is pronounced "vegan," like I don't eat meat.
Full license details.
For more on re-use permissions, or to get a signed release form, see tylervigen.com/permission.
Download images for these variables:
- High resolution line chart
The image linked here is a Scalable Vector Graphic (SVG). It is the highest resolution that is possible to achieve. It scales up beyond the size of the observable universe without pixelating. You do not need to email me asking if I have a higher resolution image. I do not. The physical limitations of our universe prevent me from providing you with an image that is any higher resolution than this one.
If you insert it into a PowerPoint presentation (a tool well-known for managing things that are the scale of the universe), you can right-click > "Ungroup" or "Create Shape" and then edit the lines and text directly. You can also change the colors this way.
Alternatively you can use a tool like Inkscape. - High resolution line chart, optimized for mobile
- Alternative high resolution line chart
- Scatterplot
- Portable line chart (png)
- Portable line chart (png), optimized for mobile
- Line chart for only The number of statisticians in Michigan
- Line chart for only ORIX Corporation's stock price (IX)
- AI-generated correlation image
- The spurious research paper: Statistically Significant: The Number-Crunching Connection Between Statisticians in Michigan and ORIX Corporation's Stock Price
Your rating is much appreciated!
Correlation ID: 2979 · Black Variable ID: 9600 · Red Variable ID: 1887

