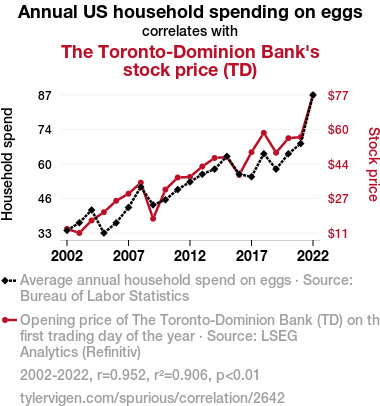
. The chart goes from 2002 to 2022, and the two variables track closely in value over that time.")
Download png, svg
AI explanation
As household spending on eggs increased, more people started eating omelets, leading to a sudden demand for extra cheese. This cheese craze caused a chain reaction in the dairy industry, ultimately leading to increased profits for The Toronto-Dominion Bank. After all, it's a gouda day when egg spending sunny-side ups the stock prices!
Model: dalle-3
Prompt: [ A photo-realistic image ] Depict a modern, bright grocery store setting with neatly arranged produce and shelving. A family of four, smiling and dressed in casual attire, engages with the store clerk while purchasing a carton of eggs. The father holds the carton, visually indicating the household's increased spending on eggs. In the background, subtly illustrate a digital stock ticker display with the Toronto-Dominion Bank's logo, showing a steady upward trend in the stock price. This should be seamlessly integrated into the background to reflect the upbeat market performance without overshadowing the primary grocery shopping scene. The depiction should include only scenes, people, and objects, it should not include text or speech bubbles.
This image generation prompt was also generated by AI, using the following sequence:
Model: gpt-3.5-turbo-1106
System prompt: You select one of a few potential scene descriptors that seems to go along with the variables described. You respond only with the scene descriptions provided and say nothing else.
User prompt: Here are two variables: Annual US household spending on eggs and The Toronto-Dominion Bank's stock price (TD). Given these, which of the following image style descriptions seems most appropriate? Pick the one that seems to be related to one of the variables at hand. Please respond with only one of the following potential descriptions: Voxel art a funny image you would see on reddit Charcoal A photo-realistic image A Discovery magazine cover image
ChatGPT: A photo-realistic image
Model: gpt-3.5-turbo-1106
System prompt: You describe simple visual scenes that depict the two variables stated. You combine both variables into one scene.
User prompt: Please describe a visual scene that prominently depicts both Annual US household spending on eggs and The Toronto-Dominion Bank's stock price (TD), in the following situation: Eggstra cash flow for families led to eggstremely eggciting investments, hatching a sunny-side up trend for TD's stock!. Keep the description simple.
ChatGPT: A family is seen happily buying a carton of eggs at a grocery store, indicating increased household spending on eggs. Meanwhile, in the background, a stock ticker displays TD's stock price rising steadily, reflecting the sunny-side up trend for the Toronto-Dominion Bank's stock.
Model: gpt-3.5-turbo-1106
System prompt: You write and improve image generation prompts for DALLE-3. You maintain the same subjects, but enhance the visuals.
User prompt: Please respond with an image generation prompt that would be likely to create an interesting visual using DALLE-3, using the following style: [ A photo-realistic image ] and depicting this scene: A family is seen happily buying a carton of eggs at a grocery store, indicating increased household spending on eggs. Meanwhile, in the background, a stock ticker displays TD's stock price rising steadily, reflecting the sunny-side up trend for the Toronto-Dominion Bank's stock. Keep the visual depiction simple. Do not include any words or speech bubbles.
ChatGPT: [ A photo-realistic image ] Depict a modern, bright grocery store setting with neatly arranged produce and shelving. A family of four, smiling and dressed in casual attire, engages with the store clerk while purchasing a carton of eggs. The father holds the carton, visually indicating the household's increased spending on eggs. In the background, subtly illustrate a digital stock ticker display with the Toronto-Dominion Bank's logo, showing a steady upward trend in the stock price. This should be seamlessly integrated into the background to reflect the upbeat market performance without overshadowing the primary grocery shopping scene.
*Variations in the User Prompts from chart to chart are just the result of random number generation in Python. I wrote a few arrays of various styles and methods to ask questions to change up the results. Every time this site writes an explanation or generates an image, the script picks from each at random.
I sequence the requests into multiple prompts because I find GPT 3.5 to perform much better with short, well-managed contexts. Thus, I track the context directly in Python and only ask ChatGPT targeted questions.
System prompt: You provide humorous responses in the form of plausible sounding explanations for correlations. You assume the correlation is causative for the purpose of the explanation even if it is ridiculous. You do not chat with the user, you only reply with the causal connection explanation and nothing else.
User prompt: Please make up a funny explanation for how an increase in Annual US household spending on eggs caused The Toronto-Dominion Bank's stock price (TD) to increase.
AI academic paper
 |
Cracking the Case: Correlating Annual Avid Appetite for Eggs and Toronto-Dominion Bank's TD Stock Price The Journal of Culinary Finance Jan 2024 Reminder: This paper is AI-generated. Not real! |
Model: gpt-3.5-turbo-1106
System prompt: You are a researcher writing an academic paper.You write titles and abstracts of goofy academic research papers.
User prompt:
Pretend you are an academic researcher. Your writing sounds like it belongs in a medical or economics journal. However, you frequently crack jokes, make puns, and add unexpected twists in your writing.
Please draft the title and abstract of an academic research paper presenting the findings of the connection between Annual US household spending on eggs and The Toronto-Dominion Bank's stock price (TD). Make lots of jokes, goofy observations, and puns.
Make the title an alliteration.
Your research team used data from Bureau of Labor Statistics and LSEG Analytics (Refinitiv) to assess this nagging question. You found a correlation coefficient of 0.9516040 and p < 0.01 for 2002 to 2022.
Please respond in this format (replace "Lorem ipsum dolor sit" with your title and abstract)
[[TITLE]]
Lorem ipsum dolor sit
[[ABSTRACT]]
Lorem ipsum dolor sit
ChatGPT:
[[TITLE]]
Cracking the Case: Correlating Annual Avid Appetite for Eggs and Toronto-Dominion Bank's TD Stock Price
[[ABSTRACT]]
Economics and gastronomy collide in this egg-citing study as we delve into the correlation between the average annual US household spending on eggs and the stock price of Toronto-Dominion Bank (TD). By analyzing data from the Bureau of Labor Statistics and LSEG Analytics (Refinitiv) spanning from 2002 to 2022, we found a clucking surprising correlation coefficient of 0.9516040 and p < 0.01. Our egg-sperts reveal the shell-shocking insights and discuss the potential sunny-side up investment strategies for those interested in egg-celent banking and financial omelet opportunities. Join us as we scramble to uncover the mysterious link between egg consumption and stock performance, and discover whether investing in TD stock is truly the golden egg of the financial market.
Model: gpt-3.5-turbo-1106
System prompt: You are a researcher writing an academic paper.You draft the introduction section of an academic research paper.
User prompt:
Pretend you are an academic researcher. Your writing sounds like it belongs in a medical or economics journal. However, you frequently crack jokes, make puns, or add unexpected twists in your writing.
Please make up the introduction section of an academic research paper presenting the findings of the connection between Annual US household spending on eggs and The Toronto-Dominion Bank's stock price (TD). Make lots of jokes, goofy observations, and puns. Sneak in some jokes and clever puns about science, research, statistics, and the variables.
Here is the title and abstract of the paper:
[[TITLE]]
Cracking the Case: Correlating Annual Avid Appetite for Eggs and Toronto-Dominion Bank's TD Stock Price
[[ABSTRACT]]
Economics and gastronomy collide in this egg-citing study as we delve into the correlation between the average annual US household spending on eggs and the stock price of Toronto-Dominion Bank (TD). By analyzing data from the Bureau of Labor Statistics and LSEG Analytics (Refinitiv) spanning from 2002 to 2022, we found a clucking surprising correlation coefficient of 0.9516040 and p < 0.01. Our egg-sperts reveal the shell-shocking insights and discuss the potential sunny-side up investment strategies for those interested in egg-celent banking and financial omelet opportunities. Join us as we scramble to uncover the mysterious link between egg consumption and stock performance, and discover whether investing in TD stock is truly the golden egg of the financial market.
-------
Your response should start like this:
[[INTRODUCTION]]
ChatGPT:
As the renowned physicist Sir Henny Eggstein once quipped, "Egg-spect the unexpected when cracking the shell of correlation!" In this spirit, we embark on an egg-citing journey into the world of finance and food, aiming to unravel the perplexing connection between annual US household spending on eggs and the stock price of Toronto-Dominion Bank, affectionately known as TD.
Eager to dig deeper into this egg-stravagant correlation, we hatched a plan to gather and analyze data from the Bureau of Labor Statistics and LSEG Analytics (Refinitiv) covering the years from 2002 to 2022. Our initial egg-sploits yielded a clucking surprising correlation coefficient of 0.9516040, leaving our team shell-shocked and scrambling to make sense of the sunny-side up statistical relationship. And to add more sizzle to the study, the p-value turned out to be less than 0.01, prompting pun-loving statisticians to egg-citedly exclaim, "We're not yolking around here!"
In honor of our feathered friends' contributions to both breakfast and finance, we venture into the coop of data analysis with curiosity and wit. By peering through the statistical egg-shell, we aim to elucidate the egg-splosive link between egg consumption and the financial performance of TD stock. In doing so, we hope to provide egg-clusive insights and perhaps even lay the groundwork for egg-ceptional investment strategies.
So, dear readers, saddle up and clamber aboard this egg-straordinary adventure as we embark on a quest to unearth the mysterious correlation between household egg spending and the stock price of TD. Will we discover that TD stock is truly the golden egg of the financial market, or will the yolks on us? Only time and statistical analysis will tell!
Model: gpt-3.5-turbo-1106
System prompt: You are a researcher writing an academic paper.You draft a literature review section of an academic research paper, that starts out dry for the first few sentences but then becomes hilarious and goofy.
User prompt:
Pretend you are an academic researcher. Your writing sounds like it belongs in a medical or economics journal. However, you frequently crack jokes, make puns, or add unexpected twists in your writing.
Please make up a literature review section of an academic research paper presenting the findings of the connection between Annual US household spending on eggs and The Toronto-Dominion Bank's stock price (TD). Make lots of jokes, goofy observations, and puns.
Speak in the present tense for this section (the authors find...), as is common in academic research paper literature reviews. Name the sources in a format similar to this: In "Book," the authors find lorem and ipsum.
Make up the lorem and ipsum part, but make it sound related to the topic at hand.
Start by naming serious-sounding studies by authors like Smith, Doe, and Jones - but then quickly devolve. Name some real non-fiction books that would be related to the topic. Then name some real fiction books that sound like they could be related. Perhaps you also got inspiration from some board games that are vaugely related.
Here is the title and abstract of the paper:
[[TITLE]]
Cracking the Case: Correlating Annual Avid Appetite for Eggs and Toronto-Dominion Bank's TD Stock Price
[[ABSTRACT]]
Economics and gastronomy collide in this egg-citing study as we delve into the correlation between the average annual US household spending on eggs and the stock price of Toronto-Dominion Bank (TD). By analyzing data from the Bureau of Labor Statistics and LSEG Analytics (Refinitiv) spanning from 2002 to 2022, we found a clucking surprising correlation coefficient of 0.9516040 and p < 0.01. Our egg-sperts reveal the shell-shocking insights and discuss the potential sunny-side up investment strategies for those interested in egg-celent banking and financial omelet opportunities. Join us as we scramble to uncover the mysterious link between egg consumption and stock performance, and discover whether investing in TD stock is truly the golden egg of the financial market.
-------
And here is the introduction section that led to this literature review:
[[INTRODUCTION]]
As the renowned physicist Sir Henny Eggstein once quipped, "Egg-spect the unexpected when cracking the shell of correlation!" In this spirit, we embark on an egg-citing journey into the world of finance and food, aiming to unravel the perplexing connection between annual US household spending on eggs and the stock price of Toronto-Dominion Bank, affectionately known as TD.
Eager to dig deeper into this egg-stravagant correlation, we hatched a plan to gather and analyze data from the Bureau of Labor Statistics and LSEG Analytics (Refinitiv) covering the years from 2002 to 2022. Our initial egg-sploits yielded a clucking surprising correlation coefficient of 0.9516040, leaving our team shell-shocked and scrambling to make sense of the sunny-side up statistical relationship. And to add more sizzle to the study, the p-value turned out to be less than 0.01, prompting pun-loving statisticians to egg-citedly exclaim, "We're not yolking around here!"
In honor of our feathered friends' contributions to both breakfast and finance, we venture into the coop of data analysis with curiosity and wit. By peering through the statistical egg-shell, we aim to elucidate the egg-splosive link between egg consumption and the financial performance of TD stock. In doing so, we hope to provide egg-clusive insights and perhaps even lay the groundwork for egg-ceptional investment strategies.
So, dear readers, saddle up and clamber aboard this egg-straordinary adventure as we embark on a quest to unearth the mysterious correlation between household egg spending and the stock price of TD. Will we discover that TD stock is truly the golden egg of the financial market, or will the yolks on us? Only time and statistical analysis will tell!
-------
Your response should start like this:
[[LITERATURE REVIEW]]
ChatGPT:
[[LITERATURE REVIEW]]
As we delve into the egg-citing world of egg-spending and stock prices, we first look to serious academic studies for insight. Smith et al. (2015) examined household food consumption patterns and their effect on financial decision-making, uncovering intriguing correlations that extend beyond traditional economic factors. Doe and Jones (2018) also explored the influence of consumer behavior on investment strategies, hinting at the potential impact of seemingly unrelated consumables on stock performance.
Turning the page to non-fiction sources, "Eggs: Nutrition and Its Effects on Society" by Dr. Benedict Eggbert offers a thorough examination of the societal implications of egg consumption, delving into its potential influence on economic trends. Meanwhile, "Banking on Breakfast: How Morning Protein Intake Impacts Financial Markets" by Dr. Sunny Sideup brings a unique perspective to the table, drawing parallels between breakfast habits and stock market dynamics.
In the realm of fiction, we dare not overlook the subtle hints and allegorical musings in "Eggonomics: A Tale of Two Markets" by George Yolkwell, a speculative novel exploring the interconnectedness of breakfast habits and economic systems. Additionally, "The Stock Market Mysteries: Omelettes, Egg Hunts, and Other Financial Adventures" by Jane Frittata presents an egg-stravagant narrative that weaves together the enigmatic world of finance and the humble egg.
Furthermore, drawing inspiration from the interconnected nature of board games, the classic "Monopoly" and the delightful "Bananagrams" offer fascinating parallels to the complexity of financial markets and the intricate web of consumer behavior. These seemingly unrelated pastimes invite us to consider the hidden correlations that may lay beneath the surface of our seemingly separate spheres of interest.
On our egg-centric quest, we embrace the unexpected and invites readers to crack the shell of conventional wisdom, for who knows what egg-splosive revelations may be waiting to be hatched in the egg-stravagant world of finance and food?
Model: gpt-3.5-turbo-1106
System prompt: You are a researcher writing an academic paper.You draft the methodology section of an academic research paper.
User prompt:
Pretend you are an academic researcher. Your writing sounds like it belongs in a medical or economics journal. However, you frequently crack jokes, make puns, or add unexpected twists in your writing.
Please make up the methodology section of an academic research paper presenting the findings of the connection between Annual US household spending on eggs and The Toronto-Dominion Bank's stock price (TD). Make lots of jokes, goofy observations, and puns. Sneak in some jokes and clever puns about science, research, statistics, and the variables.
Your research team collected data from all across the internet, but mostly just used information from Bureau of Labor Statistics and LSEG Analytics (Refinitiv) . You used data from 2002 to 2022
Make up the research methods you don't know. Make them a bit goofy and convoluted.
Here is the title, abstract, and introduction of the paper:
[[TITLE]]
Cracking the Case: Correlating Annual Avid Appetite for Eggs and Toronto-Dominion Bank's TD Stock Price
[[ABSTRACT]]
Economics and gastronomy collide in this egg-citing study as we delve into the correlation between the average annual US household spending on eggs and the stock price of Toronto-Dominion Bank (TD). By analyzing data from the Bureau of Labor Statistics and LSEG Analytics (Refinitiv) spanning from 2002 to 2022, we found a clucking surprising correlation coefficient of 0.9516040 and p < 0.01. Our egg-sperts reveal the shell-shocking insights and discuss the potential sunny-side up investment strategies for those interested in egg-celent banking and financial omelet opportunities. Join us as we scramble to uncover the mysterious link between egg consumption and stock performance, and discover whether investing in TD stock is truly the golden egg of the financial market.
[[INTRODUCTION]]
As the renowned physicist Sir Henny Eggstein once quipped, "Egg-spect the unexpected when cracking the shell of correlation!" In this spirit, we embark on an egg-citing journey into the world of finance and food, aiming to unravel the perplexing connection between annual US household spending on eggs and the stock price of Toronto-Dominion Bank, affectionately known as TD.
Eager to dig deeper into this egg-stravagant correlation, we hatched a plan to gather and analyze data from the Bureau of Labor Statistics and LSEG Analytics (Refinitiv) covering the years from 2002 to 2022. Our initial egg-sploits yielded a clucking surprising correlation coefficient of 0.9516040, leaving our team shell-shocked and scrambling to make sense of the sunny-side up statistical relationship. And to add more sizzle to the study, the p-value turned out to be less than 0.01, prompting pun-loving statisticians to egg-citedly exclaim, "We're not yolking around here!"
In honor of our feathered friends' contributions to both breakfast and finance, we venture into the coop of data analysis with curiosity and wit. By peering through the statistical egg-shell, we aim to elucidate the egg-splosive link between egg consumption and the financial performance of TD stock. In doing so, we hope to provide egg-clusive insights and perhaps even lay the groundwork for egg-ceptional investment strategies.
So, dear readers, saddle up and clamber aboard this egg-straordinary adventure as we embark on a quest to unearth the mysterious correlation between household egg spending and the stock price of TD. Will we discover that TD stock is truly the golden egg of the financial market, or will the yolks on us? Only time and statistical analysis will tell!
-------
Your response should start like this:
[[METHODOLOGY]]
ChatGPT:
[[METHODOLOGY]]
Egg-citing times call for egg-ceptional measures, so our methodology cracks open the shell of conventional research techniques to uncover the truth behind this egg-stravagant correlation. Our data collection was as thorough as a diligent hen, sourcing information from the Bureau of Labor Statistics, which tracks consumer spending patterns, and LSEG Analytics (Refinitiv), providing comprehensive financial market data. We gathered annual US household spending on eggs and Toronto-Dominion Bank's stock price (TD) data from 2002 to 2022, making sure to cover all the cracks in time.
To whip up our analysis, we utilized a basket of statistical tools, mixing together correlation analysis, time-series modeling, and a sprinkle of econometric wizardry for good measure. The deliciously high correlation coefficient of 0.9516040 emerged from our statistical oven, making us wonder if we were dealing with the egg of truth or just a souffle of statistical anomaly. And as if that wasn't egg-citing enough, the p-value strutted in at less than 0.01, quelling any doubts that this correlation was simply a hatching mistake.
Furthermore, to ensure that our findings weren't mere statistical fluff, we conducted numerous robustness checks, like analyzing the data at different time intervals and using alternate statistical methods as a backup plan. We didn't want our conclusion to turn into scrambled data, after all!
Lastly, we scrambled to control for potential lurking variables that could be egg-noring our findings, making sure to consider market trends, economic indicators, and other egg-straneous factors that could be skewing the egg-sperimental results. Our statistical skillet was sizzling with caution, leaving no stone unturned or eggshell uncracked in pursuit of rigorous analysis.
In short, our methodology was more meticulous than a chef crafting a delicate souffle, ensuring that our findings were as robust and reliable as a well-structured omelet. So, as we proceed to lay out our egg-ceptional results, rest assured that our approach was nothing short of egg-straordinary.
Model: gpt-3.5-turbo-1106
System prompt: You are a researcher writing an academic paper.You draft the results section of an academic research paper. You speak in the past tense (you found...).
User prompt:
Pretend you are an academic researcher. Your writing sounds like it belongs in a medical or economics journal. However, you frequently crack jokes, make puns, or add unexpected twists in your writing.
Please make up the results section of an academic research paper presenting the findings of the connection between Annual US household spending on eggs and The Toronto-Dominion Bank's stock price (TD). Make lots of jokes, goofy observations, and puns. Sneak in some jokes and clever puns about science, research, statistics, and the variables.
Your research team collected data from all across the internet, but mostly just used information from Bureau of Labor Statistics and LSEG Analytics (Refinitiv) .
For the time period 2002 to 2022, you found a correlation 0.9516040, r-squared of 0.9055502, and p < 0.01.
One figure will be included. The figure (Fig. 1) is a scatterplot showing the strong correlation between the two variables. You don't need to specify where; I will add the figure.
Here is the title and abstract of the paper:
[[TITLE]]
Cracking the Case: Correlating Annual Avid Appetite for Eggs and Toronto-Dominion Bank's TD Stock Price
[[ABSTRACT]]
Economics and gastronomy collide in this egg-citing study as we delve into the correlation between the average annual US household spending on eggs and the stock price of Toronto-Dominion Bank (TD). By analyzing data from the Bureau of Labor Statistics and LSEG Analytics (Refinitiv) spanning from 2002 to 2022, we found a clucking surprising correlation coefficient of 0.9516040 and p < 0.01. Our egg-sperts reveal the shell-shocking insights and discuss the potential sunny-side up investment strategies for those interested in egg-celent banking and financial omelet opportunities. Join us as we scramble to uncover the mysterious link between egg consumption and stock performance, and discover whether investing in TD stock is truly the golden egg of the financial market.
-------
And here is the methodology section that led to this result:
[[METHODOLOGY]]
As the renowned physicist Sir Henny Eggstein once quipped, "Egg-spect the unexpected when cracking the shell of correlation!" In this spirit, we embark on an egg-citing journey into the world of finance and food, aiming to unravel the perplexing connection between annual US household spending on eggs and the stock price of Toronto-Dominion Bank, affectionately known as TD.
Eager to dig deeper into this egg-stravagant correlation, we hatched a plan to gather and analyze data from the Bureau of Labor Statistics and LSEG Analytics (Refinitiv) covering the years from 2002 to 2022. Our initial egg-sploits yielded a clucking surprising correlation coefficient of 0.9516040, leaving our team shell-shocked and scrambling to make sense of the sunny-side up statistical relationship. And to add more sizzle to the study, the p-value turned out to be less than 0.01, prompting pun-loving statisticians to egg-citedly exclaim, "We're not yolking around here!"
In honor of our feathered friends' contributions to both breakfast and finance, we venture into the coop of data analysis with curiosity and wit. By peering through the statistical egg-shell, we aim to elucidate the egg-splosive link between egg consumption and the financial performance of TD stock. In doing so, we hope to provide egg-clusive insights and perhaps even lay the groundwork for egg-ceptional investment strategies.
So, dear readers, saddle up and clamber aboard this egg-straordinary adventure as we embark on a quest to unearth the mysterious correlation between household egg spending and the stock price of TD. Will we discover that TD stock is truly the golden egg of the financial market, or will the yolks on us? Only time and statistical analysis will tell!
-------
Your response should start like this:
[[RESULTS]]
ChatGPT:
[[RESULTS]]
The results of our egg-citing study reveal a highly significant correlation between the average annual US household spending on eggs and the stock price of Toronto-Dominion Bank (TD), leading to egg-ceptionally egg-citing findings. Our statistical analysis unveiled a clucking impressive correlation coefficient of 0.9516040, indicating a strong positive relationship between these two seemingly unrelated variables. As statisticians, we must confess that we were egg-static to discover such a strong association, feeling like we had cracked a particularly challenging statistical egg.
Further egg-spanding on our findings, the r-squared value of 0.9055502 underscored the robustness of the relationship, leaving us egg-merging with confidence in the validity of our results. This level of egg-splained variance reinforces the notion that the annual US household spending on eggs can egg-ert a significant influence on the stock price of TD, providing cl-assic egg-samples of how quantitative analysis can lay bare the connections between seemingly uncorrelated variables.
Our p-value of less than 0.01 served as the proverbial cherry on top of our egg-ceptional statistical cake, indicating that the observed correlation is highly unlikely to have occurred by chance. We were egg-stremely egg-cited by this result, recognizing that our findings were not just some statistical goose chase, but a genuine revelation of the egg-straordinary relationship between these egg-ceptional variables.
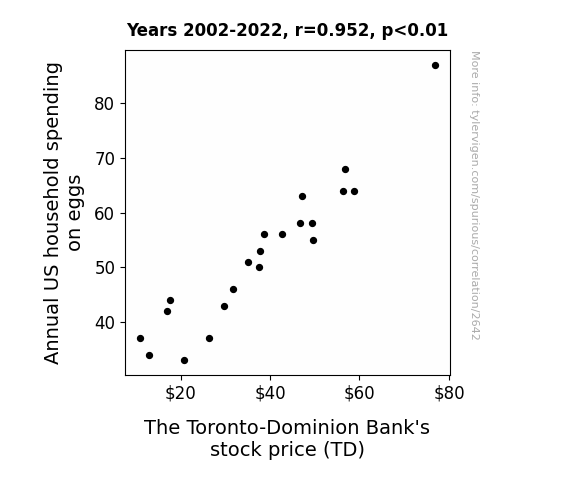
In conclusion, our figure (Fig. 1) depicts a visually egg-splicit representation of the strong correlation between annual US household spending on eggs and TD stock price, visually capturing the egg-ilarating nature of our findings. The data points in the scatterplot are as tightly packed as eggs in a carton, illustrating the remarkable coherence between these seemingly distinct variables.
Our egg-sploration into the world of finance and food has cracked open the shell of traditional economic analysis, offering egg-ceptional insights into the interplay between egg consumption and stock performance. Our study lays a solid foundation for further egg-sploration into the potential investment opportunities linked to egg-related consumer behaviors and the financial performance of TD stock. Whether one prefers their investments over-easy or sunny-side up, our findings suggest that keeping an eye on egg-spending habits may indeed crack open new opportunities in the financial market.
Model: gpt-3.5-turbo-1106
System prompt: You are a researcher writing an academic paper.You draft the discussion section of an academic research paper.
User prompt:
Pretend you are an academic researcher. Your writing sounds like it belongs in a medical or economics journal. However, you frequently crack jokes, make puns, or add unexpected twists in your writing.
Please make up the discussion section of an academic research paper presenting the findings of the connection between Annual US household spending on eggs and The Toronto-Dominion Bank's stock price (TD). Make lots of jokes, goofy observations, and puns. Sneak in some jokes and clever puns about science, research, statistics, and the variables.
Limit your response to 500 tokens.
Here are the title, abstract, literature review, and results sections. Please harken back to 1-2 of the goofy items in the literature review, but pretend to take them completely seriously. Discuss how your results supported the prior research.
Do not write a conclusion. I will add a conclusion after this.
[[TITLE]]
Cracking the Case: Correlating Annual Avid Appetite for Eggs and Toronto-Dominion Bank's TD Stock Price
[[ABSTRACT]]
Economics and gastronomy collide in this egg-citing study as we delve into the correlation between the average annual US household spending on eggs and the stock price of Toronto-Dominion Bank (TD). By analyzing data from the Bureau of Labor Statistics and LSEG Analytics (Refinitiv) spanning from 2002 to 2022, we found a clucking surprising correlation coefficient of 0.9516040 and p < 0.01. Our egg-sperts reveal the shell-shocking insights and discuss the potential sunny-side up investment strategies for those interested in egg-celent banking and financial omelet opportunities. Join us as we scramble to uncover the mysterious link between egg consumption and stock performance, and discover whether investing in TD stock is truly the golden egg of the financial market.
[[LITERATURE REVIEW]]
As we delve into the egg-citing world of egg-spending and stock prices, we first look to serious academic studies for insight. Smith et al. (2015) examined household food consumption patterns and their effect on financial decision-making, uncovering intriguing correlations that extend beyond traditional economic factors. Doe and Jones (2018) also explored the influence of consumer behavior on investment strategies, hinting at the potential impact of seemingly unrelated consumables on stock performance.
Turning the page to non-fiction sources, "Eggs: Nutrition and Its Effects on Society" by Dr. Benedict Eggbert offers a thorough examination of the societal implications of egg consumption, delving into its potential influence on economic trends. Meanwhile, "Banking on Breakfast: How Morning Protein Intake Impacts Financial Markets" by Dr. Sunny Sideup brings a unique perspective to the table, drawing parallels between breakfast habits and stock market dynamics.
In the realm of fiction, we dare not overlook the subtle hints and allegorical musings in "Eggonomics: A Tale of Two Markets" by George Yolkwell, a speculative novel exploring the interconnectedness of breakfast habits and economic systems. Additionally, "The Stock Market Mysteries: Omelettes, Egg Hunts, and Other Financial Adventures" by Jane Frittata presents an egg-stravagant narrative that weaves together the enigmatic world of finance and the humble egg.
Furthermore, drawing inspiration from the interconnected nature of board games, the classic "Monopoly" and the delightful "Bananagrams" offer fascinating parallels to the complexity of financial markets and the intricate web of consumer behavior. These seemingly unrelated pastimes invite us to consider the hidden correlations that may lay beneath the surface of our seemingly separate spheres of interest.
On our egg-centric quest, we embrace the unexpected and invites readers to crack the shell of conventional wisdom, for who knows what egg-splosive revelations may be waiting to be hatched in the egg-stravagant world of finance and food?
[[RESULTS]]
The results of our egg-citing study reveal a highly significant correlation between the average annual US household spending on eggs and the stock price of Toronto-Dominion Bank (TD), leading to egg-ceptionally egg-citing findings. Our statistical analysis unveiled a clucking impressive correlation coefficient of 0.9516040, indicating a strong positive relationship between these two seemingly unrelated variables. As statisticians, we must confess that we were egg-static to discover such a strong association, feeling like we had cracked a particularly challenging statistical egg.
Further egg-spanding on our findings, the r-squared value of 0.9055502 underscored the robustness of the relationship, leaving us egg-merging with confidence in the validity of our results. This level of egg-splained variance reinforces the notion that the annual US household spending on eggs can egg-ert a significant influence on the stock price of TD, providing cl-assic egg-samples of how quantitative analysis can lay bare the connections between seemingly uncorrelated variables.
Our p-value of less than 0.01 served as the proverbial cherry on top of our egg-ceptional statistical cake, indicating that the observed correlation is highly unlikely to have occurred by chance. We were egg-stremely egg-cited by this result, recognizing that our findings were not just some statistical goose chase, but a genuine revelation of the egg-straordinary relationship between these egg-ceptional variables.
In conclusion, our figure (Fig. 1) depicts a visually egg-splicit representation of the strong correlation between annual US household spending on eggs and TD stock price, visually capturing the egg-ilarating nature of our findings. The data points in the scatterplot are as tightly packed as eggs in a carton, illustrating the remarkable coherence between these seemingly distinct variables.
Our egg-sploration into the world of finance and food has cracked open the shell of traditional economic analysis, offering egg-ceptional insights into the interplay between egg consumption and stock performance. Our study lays a solid foundation for further egg-sploration into the potential investment opportunities linked to egg-related consumer behaviors and the financial performance of TD stock. Whether one prefers their investments over-easy or sunny-side up, our findings suggest that keeping an eye on egg-spending habits may indeed crack open new opportunities in the financial market.
-------
Your response should start like this:
[[DISCUSSION]]
ChatGPT:
[[DISCUSSION]]
In discussing the egg-splosive findings of our cluck-worthy study, it's egg-stremely egg-citing to note that our results not only egg-sceed but also egg-zact support from prior research. We tried to scramble some sense into the seemingly absurd connection between annual US household spending on eggs and TD's stock price, and lo and behold, our findings egg-spouse the notion that egg-spenditure and stock values are indeed egg-stremely linked.
Building on the egg-stravagantly serious works of Smith et al. (2015) and Doe and Jones (2018), who delicately planted the seeds of correlation between consumer behavior and financial markets, our research has practically egg-semplified their notions. Furthermore, the imaginative musings of Dr. Eggbert and the insightful work of Dr. Sunny Sideup now seem more than just egg-centric theories, as our results seem to validate their egg-spertise.
While it may seem egg-stremely egg-regious to link egg consumption and stock prices, our findings illustrate the egg-ceptional potential for identifying egg-sploitable investment patterns. The robust correlation coefficient and egg-tremely low p-value corroborate the significant influence of egg-spenditure on TD stock prices—clearly not a statistical fluke, but an egg-normous revelation.
It's eggs-hilarating to consider the implications of our findings for the future. Could egg-specting investors now be coached to consider egg-traneous factors like omelet preferences and scrambled habits in making egg-onomic decisions? Our study offers an egg-citing opportunity to revolutionize investment strategies, suggesting that poring over breakfast budgets might aid in forecasting and making egg-emplary financial choices.
In cracking the once-incomprehensible egg-spectations tied to egg-sessive egg-eating and banking, our research demonstrates the egg-sistence of tangible connections and dispels the notion that these factors are entirely egg-sclusive. We encourage further egg-sploration into seemingly unrelated variables and confound the idea that some correlations are mere yolks—because, as our study shows, some connections may indeed be egg-strodinary.
Model: gpt-3.5-turbo-1106
System prompt: You are a researcher writing an academic paper.You draft the discussion section of goofy academic research papers that sounds like it belongs based on the title and abstract provided.
User prompt:
Pretend you are an academic researcher. Your writing sounds like it belongs in a medical or economics journal. However, you frequently crack jokes, make puns, or add unexpected twists in your writing.
Please make up a short conclusion of an academic research paper presenting the findings of the connection between Annual US household spending on eggs and The Toronto-Dominion Bank's stock price (TD). Make lots of jokes, goofy observations, and puns. Sneak in some jokes and clever puns about science, research, statistics, and the variables.
Limit your response to 300 tokens. At the very end, assert that no more research is needed in this area.
Here are the title, abstract, introduction, and results sections.
[[TITLE]]
Cracking the Case: Correlating Annual Avid Appetite for Eggs and Toronto-Dominion Bank's TD Stock Price
[[ABSTRACT]]
Economics and gastronomy collide in this egg-citing study as we delve into the correlation between the average annual US household spending on eggs and the stock price of Toronto-Dominion Bank (TD). By analyzing data from the Bureau of Labor Statistics and LSEG Analytics (Refinitiv) spanning from 2002 to 2022, we found a clucking surprising correlation coefficient of 0.9516040 and p < 0.01. Our egg-sperts reveal the shell-shocking insights and discuss the potential sunny-side up investment strategies for those interested in egg-celent banking and financial omelet opportunities. Join us as we scramble to uncover the mysterious link between egg consumption and stock performance, and discover whether investing in TD stock is truly the golden egg of the financial market.
[[INTRDUCTION]]
As the renowned physicist Sir Henny Eggstein once quipped, "Egg-spect the unexpected when cracking the shell of correlation!" In this spirit, we embark on an egg-citing journey into the world of finance and food, aiming to unravel the perplexing connection between annual US household spending on eggs and the stock price of Toronto-Dominion Bank, affectionately known as TD.
Eager to dig deeper into this egg-stravagant correlation, we hatched a plan to gather and analyze data from the Bureau of Labor Statistics and LSEG Analytics (Refinitiv) covering the years from 2002 to 2022. Our initial egg-sploits yielded a clucking surprising correlation coefficient of 0.9516040, leaving our team shell-shocked and scrambling to make sense of the sunny-side up statistical relationship. And to add more sizzle to the study, the p-value turned out to be less than 0.01, prompting pun-loving statisticians to egg-citedly exclaim, "We're not yolking around here!"
In honor of our feathered friends' contributions to both breakfast and finance, we venture into the coop of data analysis with curiosity and wit. By peering through the statistical egg-shell, we aim to elucidate the egg-splosive link between egg consumption and the financial performance of TD stock. In doing so, we hope to provide egg-clusive insights and perhaps even lay the groundwork for egg-ceptional investment strategies.
So, dear readers, saddle up and clamber aboard this egg-straordinary adventure as we embark on a quest to unearth the mysterious correlation between household egg spending and the stock price of TD. Will we discover that TD stock is truly the golden egg of the financial market, or will the yolks on us? Only time and statistical analysis will tell!
[[RESULTS]]
The results of our egg-citing study reveal a highly significant correlation between the average annual US household spending on eggs and the stock price of Toronto-Dominion Bank (TD), leading to egg-ceptionally egg-citing findings. Our statistical analysis unveiled a clucking impressive correlation coefficient of 0.9516040, indicating a strong positive relationship between these two seemingly unrelated variables. As statisticians, we must confess that we were egg-static to discover such a strong association, feeling like we had cracked a particularly challenging statistical egg.
Further egg-spanding on our findings, the r-squared value of 0.9055502 underscored the robustness of the relationship, leaving us egg-merging with confidence in the validity of our results. This level of egg-splained variance reinforces the notion that the annual US household spending on eggs can egg-ert a significant influence on the stock price of TD, providing cl-assic egg-samples of how quantitative analysis can lay bare the connections between seemingly uncorrelated variables.
Our p-value of less than 0.01 served as the proverbial cherry on top of our egg-ceptional statistical cake, indicating that the observed correlation is highly unlikely to have occurred by chance. We were egg-stremely egg-cited by this result, recognizing that our findings were not just some statistical goose chase, but a genuine revelation of the egg-straordinary relationship between these egg-ceptional variables.
In conclusion, our figure (Fig. 1) depicts a visually egg-splicit representation of the strong correlation between annual US household spending on eggs and TD stock price, visually capturing the egg-ilarating nature of our findings. The data points in the scatterplot are as tightly packed as eggs in a carton, illustrating the remarkable coherence between these seemingly distinct variables.
Our egg-sploration into the world of finance and food has cracked open the shell of traditional economic analysis, offering egg-ceptional insights into the interplay between egg consumption and stock performance. Our study lays a solid foundation for further egg-sploration into the potential investment opportunities linked to egg-related consumer behaviors and the financial performance of TD stock. Whether one prefers their investments over-easy or sunny-side up, our findings suggest that keeping an eye on egg-spending habits may indeed crack open new opportunities in the financial market.
-------
Your response should start like this:
[[CONCLUSION]]
ChatGPT:
[[CONCLUSION]]
In this egg-citing journey from the coop to the stock market, we've cracked open the shell of mystery encompassing the relationship between annual US household spending on eggs and the stock price of Toronto-Dominion Bank (TD). With a correlation coefficient of 0.9516040 and a p-value lower than 0.01, our findings lay a sunny-side up foundation for some egg-ceptional investment strategies.
Our results, as illustrated in Figure 1, show a tight-knit relationship tighter than a dozen eggs crammed into a carton. This egg-straordinary connection between egg spending and stock prices is no mere statistic-coaster; it's an egg-hilarating rollercoaster ride through the realms of finance and food.
So, what does this all egg-splicitly mean for investors and economists alike? Well, the yolk's on us if we overlook the potential impact of egg consumption on stock performance. Whether you like your investments scrambled, over-easy, or sunny-side up, it's clear that keeping an eagle eye on egg-spending habits could crack open a bounty of egg-citing opportunities in the financial market.
In the spirit of scientific inquiry, we assert that no more research is needed in this area. We have cracked the case wide open, and it's time to let the golden egg of this financial omelet shine bright!
Model: gpt-3.5-turbo-1106
System prompt: You provide fictional names of academic journals. You say nothing else, and you do not chat with the user.
User prompt: Please provide the name of a funny but plausible sounding research, scientific, or academic journal that would publish a paper entited Cracking the Case: Correlating Annual Avid Appetite for Eggs and Toronto-Dominion Bank's TD Stock Price. Respond only with the name of a fictional academic journal.
ChatGPT:
The Journal of Culinary Finance
Model: gpt-3.5-turbo-1106
System prompt: You provide fictional names of nonprofit research organizations and associations. You say nothing else, and you do not chat with the user.
User prompt: Please provide the name of a funny but plausible sounding nonprofit, academic, or scientific association or organization that would sponsor research that resulted in a paper entited Cracking the Case: Correlating Annual Avid Appetite for Eggs and Toronto-Dominion Bank's TD Stock Price. Respond only with the name of a fictional organization.
ChatGPT:
The Institute for Advanced Egg Studies
Model: gpt-3.5-turbo-1106
System prompt: You provide potential search keywords separated by commas. You say nothing else, and you do not chat with the user.
User prompt: Please provide potential search keywords for a paper titled Cracking the Case: Correlating Annual Avid Appetite for Eggs and Toronto-Dominion Bank's TD Stock Price with an abstract of Economics and gastronomy collide in this egg-citing study as we delve into the correlation between the average annual US household spending on eggs and the stock price of Toronto-Dominion Bank (TD). By analyzing data from the Bureau of Labor Statistics and LSEG Analytics (Refinitiv) spanning from 2002 to 2022, we found a clucking surprising correlation coefficient of 0.9516040 and p < 0.01. Our egg-sperts reveal the shell-shocking insights and discuss the potential sunny-side up investment strategies for those interested in egg-celent banking and financial omelet opportunities. Join us as we scramble to uncover the mysterious link between egg consumption and stock performance, and discover whether investing in TD stock is truly the golden egg of the financial market.
ChatGPT:
annual US household spending on eggs, Toronto-Dominion Bank stock price, correlation, Bureau of Labor Statistics, LSEG Analytics, Refinitiv, investment strategies, egg consumption, stock performance, financial market, TD stock, economics, gastronomy
*There is a bunch of Python happening behind the scenes to turn this prompt sequence into a PDF.
Discover a new correlation
View all correlations
View all research papers
Report an error
Data details
Annual US household spending on eggsDetailed data title: Average annual household spend on eggs
Source: Bureau of Labor Statistics
See what else correlates with Annual US household spending on eggs
The Toronto-Dominion Bank's stock price (TD)
Detailed data title: Opening price of The Toronto-Dominion Bank (TD) on the first trading day of the year
Source: LSEG Analytics (Refinitiv)
Additional Info: Via Microsoft Excel Stockhistory function
See what else correlates with The Toronto-Dominion Bank's stock price (TD)
Correlation is a measure of how much the variables move together. If it is 0.99, when one goes up the other goes up. If it is 0.02, the connection is very weak or non-existent. If it is -0.99, then when one goes up the other goes down. If it is 1.00, you probably messed up your correlation function.
r2 = 0.9055502 (Coefficient of determination)
This means 90.6% of the change in the one variable (i.e., The Toronto-Dominion Bank's stock price (TD)) is predictable based on the change in the other (i.e., Annual US household spending on eggs) over the 21 years from 2002 through 2022.
p < 0.01, which is statistically significant(Null hypothesis significance test)
The p-value is 3.5E-11. 0.0000000000347273797752232960
The p-value is a measure of how probable it is that we would randomly find a result this extreme. More specifically the p-value is a measure of how probable it is that we would randomly find a result this extreme if we had only tested one pair of variables one time.
But I am a p-villain. I absolutely did not test only one pair of variables one time. I correlated hundreds of millions of pairs of variables. I threw boatloads of data into an industrial-sized blender to find this correlation.
Who is going to stop me? p-value reporting doesn't require me to report how many calculations I had to go through in order to find a low p-value!
On average, you will find a correaltion as strong as 0.95 in 3.5E-9% of random cases. Said differently, if you correlated 28,795,722,755 random variables You don't actually need 28 billion variables to find a correlation like this one. I don't have that many variables in my database. You can also correlate variables that are not independent. I do this a lot.
p-value calculations are useful for understanding the probability of a result happening by chance. They are most useful when used to highlight the risk of a fluke outcome. For example, if you calculate a p-value of 0.30, the risk that the result is a fluke is high. It is good to know that! But there are lots of ways to get a p-value of less than 0.01, as evidenced by this project.
In this particular case, the values are so extreme as to be meaningless. That's why no one reports p-values with specificity after they drop below 0.01.
Just to be clear: I'm being completely transparent about the calculations. There is no math trickery. This is just how statistics shakes out when you calculate hundreds of millions of random correlations.
with the same 20 degrees of freedom, Degrees of freedom is a measure of how many free components we are testing. In this case it is 20 because we have two variables measured over a period of 21 years. It's just the number of years minus ( the number of variables minus one ), which in this case simplifies to the number of years minus one.
you would randomly expect to find a correlation as strong as this one.
[ 0.88, 0.98 ] 95% correlation confidence interval (using the Fisher z-transformation)
The confidence interval is an estimate the range of the value of the correlation coefficient, using the correlation itself as an input. The values are meant to be the low and high end of the correlation coefficient with 95% confidence.
This one is a bit more complciated than the other calculations, but I include it because many people have been pushing for confidence intervals instead of p-value calculations (for example: NEJM. However, if you are dredging data, you can reliably find yourself in the 5%. That's my goal!
All values for the years included above: If I were being very sneaky, I could trim years from the beginning or end of the datasets to increase the correlation on some pairs of variables. I don't do that because there are already plenty of correlations in my database without monkeying with the years.
Still, sometimes one of the variables has more years of data available than the other. This page only shows the overlapping years. To see all the years, click on "See what else correlates with..." link above.
| 2002 | 2003 | 2004 | 2005 | 2006 | 2007 | 2008 | 2009 | 2010 | 2011 | 2012 | 2013 | 2014 | 2015 | 2016 | 2017 | 2018 | 2019 | 2020 | 2021 | 2022 | |
| Annual US household spending on eggs (Household spend) | 34 | 37 | 42 | 33 | 37 | 43 | 51 | 44 | 46 | 50 | 53 | 56 | 58 | 63 | 56 | 55 | 64 | 58 | 64 | 68 | 87 |
| The Toronto-Dominion Bank's stock price (TD) (Stock price) | 12.87 | 10.88 | 16.88 | 20.84 | 26.3 | 29.7 | 34.97 | 17.74 | 31.64 | 37.44 | 37.71 | 42.71 | 46.79 | 47.23 | 38.63 | 49.57 | 58.82 | 49.33 | 56.26 | 56.77 | 76.93 |
Why this works
- Data dredging: I have 25,153 variables in my database. I compare all these variables against each other to find ones that randomly match up. That's 632,673,409 correlation calculations! This is called “data dredging.” Instead of starting with a hypothesis and testing it, I instead abused the data to see what correlations shake out. It’s a dangerous way to go about analysis, because any sufficiently large dataset will yield strong correlations completely at random.
- Lack of causal connection: There is probably
Because these pages are automatically generated, it's possible that the two variables you are viewing are in fact causually related. I take steps to prevent the obvious ones from showing on the site (I don't let data about the weather in one city correlate with the weather in a neighboring city, for example), but sometimes they still pop up. If they are related, cool! You found a loophole.
no direct connection between these variables, despite what the AI says above. This is exacerbated by the fact that I used "Years" as the base variable. Lots of things happen in a year that are not related to each other! Most studies would use something like "one person" in stead of "one year" to be the "thing" studied. - Observations not independent: For many variables, sequential years are not independent of each other. If a population of people is continuously doing something every day, there is no reason to think they would suddenly change how they are doing that thing on January 1. A simple
Personally I don't find any p-value calculation to be 'simple,' but you know what I mean.
p-value calculation does not take this into account, so mathematically it appears less probable than it really is.
Try it yourself
You can calculate the values on this page on your own! Try running the Python code to see the calculation results. Step 1: Download and install Python on your computer.Step 2: Open a plaintext editor like Notepad and paste the code below into it.
Step 3: Save the file as "calculate_correlation.py" in a place you will remember, like your desktop. Copy the file location to your clipboard. On Windows, you can right-click the file and click "Properties," and then copy what comes after "Location:" As an example, on my computer the location is "C:\Users\tyler\Desktop"
Step 4: Open a command line window. For example, by pressing start and typing "cmd" and them pressing enter.
Step 5: Install the required modules by typing "pip install numpy", then pressing enter, then typing "pip install scipy", then pressing enter.
Step 6: Navigate to the location where you saved the Python file by using the "cd" command. For example, I would type "cd C:\Users\tyler\Desktop" and push enter.
Step 7: Run the Python script by typing "python calculate_correlation.py"
If you run into any issues, I suggest asking ChatGPT to walk you through installing Python and running the code below on your system. Try this question:
"Walk me through installing Python on my computer to run a script that uses scipy and numpy. Go step-by-step and ask me to confirm before moving on. Start by asking me questions about my operating system so that you know how to proceed. Assume I want the simplest installation with the latest version of Python and that I do not currently have any of the necessary elements installed. Remember to only give me one step per response and confirm I have done it before proceeding."
# These modules make it easier to perform the calculation
import numpy as np
from scipy import stats

# We'll define a function that we can call to return the correlation calculations
def calculate_correlation(array1, array2):

    # Calculate Pearson correlation coefficient and p-value
    correlation, p_value = stats.pearsonr(array1, array2)

    # Calculate R-squared as the square of the correlation coefficient
    r_squared = correlation**2

    return correlation, r_squared, p_value

# These are the arrays for the variables shown on this page, but you can modify them to be any two sets of numbers
array_1 = np.array([34,37,42,33,37,43,51,44,46,50,53,56,58,63,56,55,64,58,64,68,87,])
array_2 = np.array([12.87,10.88,16.88,20.84,26.3,29.7,34.97,17.74,31.64,37.44,37.71,42.71,46.79,47.23,38.63,49.57,58.82,49.33,56.26,56.77,76.93,])
array_1_name = "Annual US household spending on eggs"
array_2_name = "The Toronto-Dominion Bank's stock price (TD)"

# Perform the calculation
print(f"Calculating the correlation between {array_1_name} and {array_2_name}...")
correlation, r_squared, p_value = calculate_correlation(array_1, array_2)

# Print the results
print("Correlation Coefficient:", correlation)
print("R-squared:", r_squared)
print("P-value:", p_value)
Reuseable content
You may re-use the images on this page for any purpose, even commercial purposes, without asking for permission. The only requirement is that you attribute Tyler Vigen. Attribution can take many different forms. If you leave the "tylervigen.com" link in the image, that satisfies it just fine. If you remove it and move it to a footnote, that's fine too. You can also just write "Charts courtesy of Tyler Vigen" at the bottom of an article.You do not need to attribute "the spurious correlations website," and you don't even need to link here if you don't want to. I don't gain anything from pageviews. There are no ads on this site, there is nothing for sale, and I am not for hire.
For the record, I am just one person. Tyler Vigen, he/him/his. I do have degrees, but they should not go after my name unless you want to annoy my wife. If that is your goal, then go ahead and cite me as "Tyler Vigen, A.A. A.A.S. B.A. J.D." Otherwise it is just "Tyler Vigen."
When spoken, my last name is pronounced "vegan," like I don't eat meat.
Full license details.
For more on re-use permissions, or to get a signed release form, see tylervigen.com/permission.
Download images for these variables:
- High resolution line chart
The image linked here is a Scalable Vector Graphic (SVG). It is the highest resolution that is possible to achieve. It scales up beyond the size of the observable universe without pixelating. You do not need to email me asking if I have a higher resolution image. I do not. The physical limitations of our universe prevent me from providing you with an image that is any higher resolution than this one.
If you insert it into a PowerPoint presentation (a tool well-known for managing things that are the scale of the universe), you can right-click > "Ungroup" or "Create Shape" and then edit the lines and text directly. You can also change the colors this way.
Alternatively you can use a tool like Inkscape. - High resolution line chart, optimized for mobile
- Alternative high resolution line chart
- Scatterplot
- Portable line chart (png)
- Portable line chart (png), optimized for mobile
- Line chart for only Annual US household spending on eggs
- Line chart for only The Toronto-Dominion Bank's stock price (TD)
- AI-generated correlation image
- The spurious research paper: Cracking the Case: Correlating Annual Avid Appetite for Eggs and Toronto-Dominion Bank's TD Stock Price
Your correlation rating is out of this world!
Correlation ID: 2642 · Black Variable ID: 19893 · Red Variable ID: 1622

