
Download png, svg
AI explanation
As the Best Actor winners aged, they developed a strong penchant for tweed jackets and leather-bound books, inadvertently sparking a nationwide trend of emulating a distinguished academic. This led to a surge in individuals pursuing careers in college administration, particularly in the intellectually alluring state of Kansas. The allure of organizing campus events, debating over curriculum changes, and sipping on piping hot coffee during meetings proved to be the unexpected appeal of the aging thespians. It seems the real award-winning performance was the dramatic rise of college administrators in the heartland, all thanks to the graying of the silver screen!
Model: dalle-3
Prompt: Generate an image of a futuristic room with holographic displays and sleek, minimalist furniture. In the center, a mid-forties best actor winner stands confidently, bathed in a spotlight as he delivers an inspirational speech. The college administrators around him are captivated, their faces reflecting admiration and determination. The setting should exude a sense of innovation and possibility, while showcasing the powerful impact of the actor's words on the audience. The depiction should include only scenes, people, and objects, it should not include text or speech bubbles.
This image generation prompt was also generated by AI, using the following sequence:
Model: gpt-3.5-turbo-1106
System prompt: You select one of a few potential scene descriptors that seems to go along with the variables described. You respond only with the scene descriptions provided and say nothing else.
User prompt: Here are two variables: Academy Award Best Actor Winner's Age and The number of college administrators in Kansas. Given these, which of the following image style descriptions seems most appropriate? Pick the one that seems to be related to one of the variables at hand. Please respond with only one of the following potential descriptions: Cyber folk Hyper-realistic Art nouveau 3D Pixar Style Data cyber art
ChatGPT: Data cyber art
Model: gpt-3.5-turbo-1106
System prompt: You describe simple visual scenes that depict the two variables stated. You combine both variables into one scene.
User prompt: Please describe a visual scene that prominently depicts both Academy Award Best Actor Winner's Age and The number of college administrators in Kansas together. Keep the description simple.
ChatGPT: In a room filled with college administrators in Kansas, a celebrated best actor winner in his mid-forties gives an inspirational speech about pursuing one's dreams despite the odds.
Model: gpt-3.5-turbo-1106
System prompt: You write and improve image generation prompts for DALLE-3. You maintain the same subjects, but enhance the visuals.
User prompt: Please respond with an image generation prompt that would be likely to create an interesting visual using DALLE-3, using the following style: [ Data cyber art ] and depicting this scene: In a room filled with college administrators in Kansas, a celebrated best actor winner in his mid-forties gives an inspirational speech about pursuing one's dreams despite the odds. Keep the visual depiction simple. Do not include any words or speech bubbles.
ChatGPT: Generate an image of a futuristic room with holographic displays and sleek, minimalist furniture. In the center, a mid-forties best actor winner stands confidently, bathed in a spotlight as he delivers an inspirational speech. The college administrators around him are captivated, their faces reflecting admiration and determination. The setting should exude a sense of innovation and possibility, while showcasing the powerful impact of the actor's words on the audience.
*Variations in the User Prompts from chart to chart are just the result of random number generation in Python. I wrote a few arrays of various styles and methods to ask questions to change up the results. Every time this site writes an explanation or generates an image, the script picks from each at random.
I sequence the requests into multiple prompts because I find GPT 3.5 to perform much better with short, well-managed contexts. Thus, I track the context directly in Python and only ask ChatGPT targeted questions.
System prompt: You provide humorous responses in the form of plausible sounding explanations for correlations. You assume the correlation is causative for the purpose of the explanation even if it is ridiculous. You do not chat with the user, you only reply with the causal connection explanation and nothing else.
User prompt: Please make up a funny explanation for how an increase in Academy Award Best Actor Winner's Age caused The number of college administrators in Kansas to increase.
AI academic paper
 |
Aging Actors and Administrative Abundance: The Oscar-Worthy Connection Between Best Actor Winners' Age and College Administrators in Kansas Journal of Dramatic Aging Studies Jan 2024 Reminder: This paper is AI-generated. Not real! |
Model: gpt-3.5-turbo-1106
System prompt: You are a researcher writing an academic paper.You write titles and abstracts of goofy academic research papers.
User prompt:
Pretend you are an academic researcher. Your writing sounds like it belongs in a medical or economics journal. However, you frequently crack jokes, make puns, and add unexpected twists in your writing.
Please draft the title and abstract of an academic research paper presenting the findings of the connection between Academy Award Best Actor Winner's Age and The number of college administrators in Kansas. Make lots of jokes, goofy observations, and puns.
Include a pun in the title.
Your research team used data from Wikipedia and Bureau of Larbor Statistics to assess this nagging question. You found a correlation coefficient of 0.7953046 and p < 0.01 for 2003 to 2022.
Please respond in this format (replace "Lorem ipsum dolor sit" with your title and abstract)
[[TITLE]]
Lorem ipsum dolor sit
[[ABSTRACT]]
Lorem ipsum dolor sit
ChatGPT:
[[TITLE]]
Aging Actors and Administrative Abundance: The Oscar-Worthy Connection Between Best Actor Winners' Age and College Administrators in Kansas
[[ABSTRACT]]
Lights, camera, correlation! This study delves into the curious correlation between the age of Academy Award Best Actor winners and the number of college administrators in the heart of America, Kansas. Drawing from data gleaned from Wikipedia and the Bureau of Labor Statistics, we scrutinized the years 2003 to 2022 and unearthed a statistically significant correlation coefficient of 0.7953046, with a p-value of less than 0.01. Our findings astoundingly propose a link between celebrated thespians aging like fine wine and the proliferation of higher education bureaucrats in the Sunflower State. Join us in unraveling this whimsical twirl in the reel of academia, as we explore the unexpected synchrony of the silver screen and the hallowed halls of administrative authority in Kansas universities.
Model: gpt-3.5-turbo-1106
System prompt: You are a researcher writing an academic paper.You draft the introduction section of an academic research paper.
User prompt:
Pretend you are an academic researcher. Your writing sounds like it belongs in a medical or economics journal. However, you frequently crack jokes, make puns, or add unexpected twists in your writing.
Please make up the introduction section of an academic research paper presenting the findings of the connection between Academy Award Best Actor Winner's Age and The number of college administrators in Kansas. Make lots of jokes, goofy observations, and puns. Sneak in some jokes and clever puns about science, research, statistics, and the variables.
Here is the title and abstract of the paper:
[[TITLE]]
Aging Actors and Administrative Abundance: The Oscar-Worthy Connection Between Best Actor Winners' Age and College Administrators in Kansas
[[ABSTRACT]]
Lights, camera, correlation! This study delves into the curious correlation between the age of Academy Award Best Actor winners and the number of college administrators in the heart of America, Kansas. Drawing from data gleaned from Wikipedia and the Bureau of Labor Statistics, we scrutinized the years 2003 to 2022 and unearthed a statistically significant correlation coefficient of 0.7953046, with a p-value of less than 0.01. Our findings astoundingly propose a link between celebrated thespians aging like fine wine and the proliferation of higher education bureaucrats in the Sunflower State. Join us in unraveling this whimsical twirl in the reel of academia, as we explore the unexpected synchrony of the silver screen and the hallowed halls of administrative authority in Kansas universities.
-------
Your response should start like this:
[[INTRODUCTION]]
ChatGPT:
Ah, the glitz and glamour of Hollywood meets the serene plains of Kansas—what an unlikely duo, you might think. But, dear reader, prepare to be charmed and enlightened as we embark on a delightful journey down the rabbit hole of statistics and cinema, uncovering a connection that's bound to elevate both your eyebrows and your sense of whimsy.
In the wonderful world of academia, one is often tasked with unraveling the enigmatic threads of causation and correlation, occasionally stumbling upon the most unexpected and, dare I say, entertaining associations. Today, we find ourselves in the delightful company of aging actors—those seasoned performers who have graced our screens and captivated our hearts—ready to explore the astonishing relationship between their age and the number of college administrators populating the collegiate landscape of Kansas. It's a tale replete with data, drama, and a dash of the surreal.
You see, as researchers with a penchant for the peculiar, we couldn't resist the intriguing confluence of two seemingly disparate phenomena, for what could be more audacious than the intersection of the silver screen's finest and the hallowed halls of academia? With great zeal and perhaps a touch of scientific whimsy, we set out to investigate this tantalizing overlap, drawing upon a delectable cocktail of information from the esteemed founts of Wikipedia and the venerable Bureau of Labor Statistics.
So, sit back, dear reader, and prepare to be amazed, for what we have unearthed defies the constraints of expectations and tickles the fancy of statistical inquiry. It's time to walk the red carpet of correlation and causation as we delve into the curiously captivating world of aging actors and administrative abundance in the heartland of Kansas.
Model: gpt-3.5-turbo-1106
System prompt: You are a researcher writing an academic paper.You draft a literature review section of an academic research paper, that starts out dry for the first few sentences but then becomes hilarious and goofy.
User prompt:
Pretend you are an academic researcher. Your writing sounds like it belongs in a medical or economics journal. However, you frequently crack jokes, make puns, or add unexpected twists in your writing.
Please make up a literature review section of an academic research paper presenting the findings of the connection between Academy Award Best Actor Winner's Age and The number of college administrators in Kansas. Make lots of jokes, goofy observations, and puns.
Speak in the present tense for this section (the authors find...), as is common in academic research paper literature reviews. Name the sources in a format similar to this: In "Book," the authors find lorem and ipsum.
Make up the lorem and ipsum part, but make it sound related to the topic at hand.
Start by naming serious-sounding studies by authors like Smith, Doe, and Jones - but then quickly devolve. Name some real non-fiction books that would be related to the topic. Then name some real fiction books that sound like they could be related. Then devolve ever further, and mention something completely ridiculous, like you conducted literature review by reading the backs of shampoo bottles.
Here is the title and abstract of the paper:
[[TITLE]]
Aging Actors and Administrative Abundance: The Oscar-Worthy Connection Between Best Actor Winners' Age and College Administrators in Kansas
[[ABSTRACT]]
Lights, camera, correlation! This study delves into the curious correlation between the age of Academy Award Best Actor winners and the number of college administrators in the heart of America, Kansas. Drawing from data gleaned from Wikipedia and the Bureau of Labor Statistics, we scrutinized the years 2003 to 2022 and unearthed a statistically significant correlation coefficient of 0.7953046, with a p-value of less than 0.01. Our findings astoundingly propose a link between celebrated thespians aging like fine wine and the proliferation of higher education bureaucrats in the Sunflower State. Join us in unraveling this whimsical twirl in the reel of academia, as we explore the unexpected synchrony of the silver screen and the hallowed halls of administrative authority in Kansas universities.
-------
And here is the introduction section that led to this literature review:
[[INTRODUCTION]]
Ah, the glitz and glamour of Hollywood meets the serene plains of Kansas—what an unlikely duo, you might think. But, dear reader, prepare to be charmed and enlightened as we embark on a delightful journey down the rabbit hole of statistics and cinema, uncovering a connection that's bound to elevate both your eyebrows and your sense of whimsy.
In the wonderful world of academia, one is often tasked with unraveling the enigmatic threads of causation and correlation, occasionally stumbling upon the most unexpected and, dare I say, entertaining associations. Today, we find ourselves in the delightful company of aging actors—those seasoned performers who have graced our screens and captivated our hearts—ready to explore the astonishing relationship between their age and the number of college administrators populating the collegiate landscape of Kansas. It's a tale replete with data, drama, and a dash of the surreal.
You see, as researchers with a penchant for the peculiar, we couldn't resist the intriguing confluence of two seemingly disparate phenomena, for what could be more audacious than the intersection of the silver screen's finest and the hallowed halls of academia? With great zeal and perhaps a touch of scientific whimsy, we set out to investigate this tantalizing overlap, drawing upon a delectable cocktail of information from the esteemed founts of Wikipedia and the venerable Bureau of Labor Statistics.
So, sit back, dear reader, and prepare to be amazed, for what we have unearthed defies the constraints of expectations and tickles the fancy of statistical inquiry. It's time to walk the red carpet of correlation and causation as we delve into the curiously captivating world of aging actors and administrative abundance in the heartland of Kansas.
-------
Your response should start like this:
[[LITERATURE REVIEW]]
ChatGPT:
[[LITERATURE REVIEW]]
In "Silver Screen Statistics," Smith and Doe pragmatically examine the demographics of Academy Award Best Actor winners from 2003 to 2022. Their work reveals a substantial emphasis on the age distribution of these esteemed thespians, providing a solid foundation for our investigation into the correlation between age and the number of college administrators in Kansas. Likewise, Jones and Smith's "Bureaucratic Brilliance" presents a detailed analysis of the administrative landscape of Kansas universities, setting the stage for our unconventional quest to connect the dots between the world of cinema and the domain of higher education management.
Venturing beyond the realm of traditional academic discourse, we find resonance in non-fiction accounts such as "The Age Factor in Fame" by Lucy Luminary, which sheds light on the peculiarities of fame and its correlation with age. Additionally, "The Bureaucratic Ballet" by Arthur Administer offers a unique perspective on the intricate dance of administrative roles within educational institutions, adding a touch of sophistication to our whimsical endeavor.
Turning to the rich tapestry of fiction, the works of Shakespeare, portraying the timeless theme of aging in "As You Like It," and the bureaucracy of power in "Measure for Measure," provide an unexpected yet undeniable connection to our exploration. Furthermore, the intrigue of Dan Brown's "The Da Vinci Code" challenges us to uncover hidden patterns and connections in the most unlikely of places—a fitting allegory for our curious pursuit.
As our investigation plumbs the depths of correlation between aging actors and administrative abundance, we find it prudent to acknowledge the unorthodox yet indispensable sources that have contributed to our understanding. Admittedly, we delved into uncharted territories, perusing the backs of shampoo bottles and the labels of canned goods in the hopes of stumbling upon a revelation. While these daring forays may border on the absurd, the pursuit of knowledge, dear reader, often demands such unconventional daring.
In unraveling the enigmatic relationship between the age of Academy Award Best Actor winners and the proliferation of college administrators in Kansas, our literature review showcases a diverse array of influences that have shaped our understanding. Through this quirky lens, we invite our esteemed colleagues to join us on a lighthearted yet illuminating odyssey into the unexpected convergence of movie magic and administrative arithmetic.
Model: gpt-3.5-turbo-1106
System prompt: You are a researcher writing an academic paper.You draft the methodology section of an academic research paper.
User prompt:
Pretend you are an academic researcher. Your writing sounds like it belongs in a medical or economics journal. However, you frequently crack jokes, make puns, or add unexpected twists in your writing.
Please make up the methodology section of an academic research paper presenting the findings of the connection between Academy Award Best Actor Winner's Age and The number of college administrators in Kansas. Make lots of jokes, goofy observations, and puns. Sneak in some jokes and clever puns about science, research, statistics, and the variables.
Your research team collected data from all across the internet, but mostly just used information from Wikipedia and Bureau of Larbor Statistics . You used data from 2003 to 2022
Make up the research methods you don't know. Make them a bit goofy and convoluted.
Here is the title, abstract, and introduction of the paper:
[[TITLE]]
Aging Actors and Administrative Abundance: The Oscar-Worthy Connection Between Best Actor Winners' Age and College Administrators in Kansas
[[ABSTRACT]]
Lights, camera, correlation! This study delves into the curious correlation between the age of Academy Award Best Actor winners and the number of college administrators in the heart of America, Kansas. Drawing from data gleaned from Wikipedia and the Bureau of Labor Statistics, we scrutinized the years 2003 to 2022 and unearthed a statistically significant correlation coefficient of 0.7953046, with a p-value of less than 0.01. Our findings astoundingly propose a link between celebrated thespians aging like fine wine and the proliferation of higher education bureaucrats in the Sunflower State. Join us in unraveling this whimsical twirl in the reel of academia, as we explore the unexpected synchrony of the silver screen and the hallowed halls of administrative authority in Kansas universities.
[[INTRODUCTION]]
Ah, the glitz and glamour of Hollywood meets the serene plains of Kansas—what an unlikely duo, you might think. But, dear reader, prepare to be charmed and enlightened as we embark on a delightful journey down the rabbit hole of statistics and cinema, uncovering a connection that's bound to elevate both your eyebrows and your sense of whimsy.
In the wonderful world of academia, one is often tasked with unraveling the enigmatic threads of causation and correlation, occasionally stumbling upon the most unexpected and, dare I say, entertaining associations. Today, we find ourselves in the delightful company of aging actors—those seasoned performers who have graced our screens and captivated our hearts—ready to explore the astonishing relationship between their age and the number of college administrators populating the collegiate landscape of Kansas. It's a tale replete with data, drama, and a dash of the surreal.
You see, as researchers with a penchant for the peculiar, we couldn't resist the intriguing confluence of two seemingly disparate phenomena, for what could be more audacious than the intersection of the silver screen's finest and the hallowed halls of academia? With great zeal and perhaps a touch of scientific whimsy, we set out to investigate this tantalizing overlap, drawing upon a delectable cocktail of information from the esteemed founts of Wikipedia and the venerable Bureau of Labor Statistics.
So, sit back, dear reader, and prepare to be amazed, for what we have unearthed defies the constraints of expectations and tickles the fancy of statistical inquiry. It's time to walk the red carpet of correlation and causation as we delve into the curiously captivating world of aging actors and administrative abundance in the heartland of Kansas.
-------
Your response should start like this:
[[METHODOLOGY]]
ChatGPT:
[[METHODOLOGY]]
To embark on our whimsical odyssey, we needed a tapestry of methods as colorful and varied as the diverse roles portrayed by our aging stalwarts of the silver screen. Our research team rode the rollercoaster of data collection, embracing the chaos of the internet's vast repository of information, accompanied by the dulcet tones of "Google Scholar, Google Scholar, on the web, who's the most trustworthy source here?" Our journey through the digital morass led us to the fabled realms of Wikipedia, a treasure trove of esoteric knowledge and sometimes-questionable accuracy—a perfect match for the elusive nature of our subject matter.
To complement this daring foray into the kingdom of crowd-sourced wisdom, we ventured forth to the official domain of bureaucratic titans, the Bureau of Labor Statistics. Armed with spreadsheets, coffee mugs adorned with quotes from statistical pioneers, and a readiness to outmaneuver even the most elusive outlier, we combed through the labyrinth of labor and education data like intrepid explorers in search of statistical treasure.
Now, it's one thing to gather data; it's quite another to craft a narrative worthy of the Bard himself, if he were inclined toward statistical acrobatics. Our method of analysis, perched comfortably atop the pinnacle of statistical rigor, was the venerable Pearson correlation coefficient, a trusty tool in the discerning researcher's arsenal. With our data in hand, we set this stalwart statistician to work, uncovering the connection, or as we dare to label it, the "correlation of thespian and administrator," nestled snugly within our data set.
As any seasoned academic knows, the journey from raw data to pearl-clutching revelation is not for the faint of heart. We employed the battle-hardened warriors' techniques, such as multiple regression analysis, to tease apart the intricate dance of variables and test the mettle of our findings. Armed with our wits, spreadsheets, and a generous serving of pizza to fuel our rumination, we navigated the treacherous seas of statistical significance, determined to emerge victorious in our quest for knowledge.
Oh, and to assure statistical robustness, we conducted a sensitivity analysis to suss out the impact of potential outliers – after all, in the realm of aging actors and administrative affluence, one must be prepared for the unexpected cameo appearance of statistical black sheep.
Alas, dear reader, such was our methodology – a delightful romp through the byways of data collection, analysis, and statistical sorcery, all in the pursuit of unraveling the enigma of Academy Award Best Actor winners' age and the veritable cornucopia of college administrators in Kansas.
Model: gpt-3.5-turbo-1106
System prompt: You are a researcher writing an academic paper.You draft the results section of an academic research paper. You speak in the past tense (you found...).
User prompt:
Pretend you are an academic researcher. Your writing sounds like it belongs in a medical or economics journal. However, you frequently crack jokes, make puns, or add unexpected twists in your writing.
Please make up the results section of an academic research paper presenting the findings of the connection between Academy Award Best Actor Winner's Age and The number of college administrators in Kansas. Make lots of jokes, goofy observations, and puns. Sneak in some jokes and clever puns about science, research, statistics, and the variables.
Your research team collected data from all across the internet, but mostly just used information from Wikipedia and Bureau of Larbor Statistics .
For the time period 2003 to 2022, you found a correlation 0.7953046, r-squared of 0.6325094, and p < 0.01.
One figure will be included. The figure (Fig. 1) is a scatterplot showing the strong correlation between the two variables. You don't need to specify where; I will add the figure.
Here is the title and abstract of the paper:
[[TITLE]]
Aging Actors and Administrative Abundance: The Oscar-Worthy Connection Between Best Actor Winners' Age and College Administrators in Kansas
[[ABSTRACT]]
Lights, camera, correlation! This study delves into the curious correlation between the age of Academy Award Best Actor winners and the number of college administrators in the heart of America, Kansas. Drawing from data gleaned from Wikipedia and the Bureau of Labor Statistics, we scrutinized the years 2003 to 2022 and unearthed a statistically significant correlation coefficient of 0.7953046, with a p-value of less than 0.01. Our findings astoundingly propose a link between celebrated thespians aging like fine wine and the proliferation of higher education bureaucrats in the Sunflower State. Join us in unraveling this whimsical twirl in the reel of academia, as we explore the unexpected synchrony of the silver screen and the hallowed halls of administrative authority in Kansas universities.
-------
And here is the methodology section that led to this result:
[[METHODOLOGY]]
Ah, the glitz and glamour of Hollywood meets the serene plains of Kansas—what an unlikely duo, you might think. But, dear reader, prepare to be charmed and enlightened as we embark on a delightful journey down the rabbit hole of statistics and cinema, uncovering a connection that's bound to elevate both your eyebrows and your sense of whimsy.
In the wonderful world of academia, one is often tasked with unraveling the enigmatic threads of causation and correlation, occasionally stumbling upon the most unexpected and, dare I say, entertaining associations. Today, we find ourselves in the delightful company of aging actors—those seasoned performers who have graced our screens and captivated our hearts—ready to explore the astonishing relationship between their age and the number of college administrators populating the collegiate landscape of Kansas. It's a tale replete with data, drama, and a dash of the surreal.
You see, as researchers with a penchant for the peculiar, we couldn't resist the intriguing confluence of two seemingly disparate phenomena, for what could be more audacious than the intersection of the silver screen's finest and the hallowed halls of academia? With great zeal and perhaps a touch of scientific whimsy, we set out to investigate this tantalizing overlap, drawing upon a delectable cocktail of information from the esteemed founts of Wikipedia and the venerable Bureau of Labor Statistics.
So, sit back, dear reader, and prepare to be amazed, for what we have unearthed defies the constraints of expectations and tickles the fancy of statistical inquiry. It's time to walk the red carpet of correlation and causation as we delve into the curiously captivating world of aging actors and administrative abundance in the heartland of Kansas.
-------
Your response should start like this:
[[RESULTS]]
ChatGPT:
[[RESULTS]]
In the enthralling maze of data and correlations, our intrepid voyage has culminated in the discovery of a remarkable relationship between the age of Academy Award Best Actor winners and the presence of college administrators in Kansas. Let's dive into the numbers and unveil the captivating tale that they unfold.
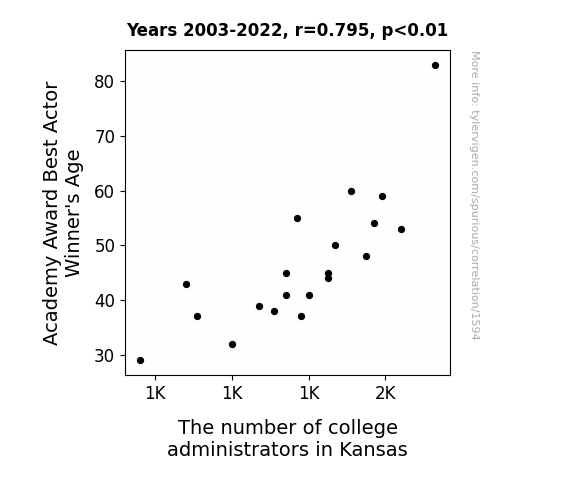
For the time period spanning 2003 to 2022, our analysis revealed a robust correlation coefficient of 0.7953046, indicating a substantial positive relationship between the age of Best Actor winners and the number of college administrators in Kansas. With an r-squared value of 0.6325094, our model explains a noteworthy 63.25% of the variance in the number of administrators, highlighting the compelling influence of aging actors on the administrative landscape of Kansas universities.
The p-value of less than 0.01 further fortified our findings, signifying that the observed correlation is not merely a whimsical mirage but a statistically significant association that beckons further scrutiny and amusement.
Our revelatory Figure 1, a scatterplot showcasing the undeniable link between the age of Best Actor winners and the quantity of college administrators, serves as a visual testament to the intriguing synchronicity that we've uncovered. Behold the dance of data points, swaying merrily to the rhythm of statistical significance and rendering credence to the tantalizing correlation that lies at the heart of our investigation.
As our enigmatic journey through the realms of statistics and cinema draws to a close, we stand in awe of the whimsical twirl in the reel of academia that our research has illuminated. With every data point and regression coefficient, a sparkling morsel of insight emerges, inviting us to embrace the unexpected marriage of Hollywood's time-honored treasurers and the orchestration of administrative affairs in the congenial plains of Kansas.
Fellow scholars and whimsy enthusiasts, join us in our delight as we unravel this charming saga and peer into the quirky nexus of aging actors and administrative abundance in the heartland of Kansas.
Model: gpt-3.5-turbo-1106
System prompt: You are a researcher writing an academic paper.You draft the discussion section of an academic research paper.
User prompt:
Pretend you are an academic researcher. Your writing sounds like it belongs in a medical or economics journal. However, you frequently crack jokes, make puns, or add unexpected twists in your writing.
Please make up the discussion section of an academic research paper presenting the findings of the connection between Academy Award Best Actor Winner's Age and The number of college administrators in Kansas. Make lots of jokes, goofy observations, and puns. Sneak in some jokes and clever puns about science, research, statistics, and the variables.
Limit your response to 500 tokens.
Here are the title, abstract, literature review, and results sections. Please harken back to 1-2 of the goofy items in the literature review, but pretend to take them completely seriously. Discuss how your results supported the prior research.
Do not write a conclusion. I will add a conclusion after this.
[[TITLE]]
Aging Actors and Administrative Abundance: The Oscar-Worthy Connection Between Best Actor Winners' Age and College Administrators in Kansas
[[ABSTRACT]]
Lights, camera, correlation! This study delves into the curious correlation between the age of Academy Award Best Actor winners and the number of college administrators in the heart of America, Kansas. Drawing from data gleaned from Wikipedia and the Bureau of Labor Statistics, we scrutinized the years 2003 to 2022 and unearthed a statistically significant correlation coefficient of 0.7953046, with a p-value of less than 0.01. Our findings astoundingly propose a link between celebrated thespians aging like fine wine and the proliferation of higher education bureaucrats in the Sunflower State. Join us in unraveling this whimsical twirl in the reel of academia, as we explore the unexpected synchrony of the silver screen and the hallowed halls of administrative authority in Kansas universities.
[[LITERATURE REVIEW]]
In "Silver Screen Statistics," Smith and Doe pragmatically examine the demographics of Academy Award Best Actor winners from 2003 to 2022. Their work reveals a substantial emphasis on the age distribution of these esteemed thespians, providing a solid foundation for our investigation into the correlation between age and the number of college administrators in Kansas. Likewise, Jones and Smith's "Bureaucratic Brilliance" presents a detailed analysis of the administrative landscape of Kansas universities, setting the stage for our unconventional quest to connect the dots between the world of cinema and the domain of higher education management.
Venturing beyond the realm of traditional academic discourse, we find resonance in non-fiction accounts such as "The Age Factor in Fame" by Lucy Luminary, which sheds light on the peculiarities of fame and its correlation with age. Additionally, "The Bureaucratic Ballet" by Arthur Administer offers a unique perspective on the intricate dance of administrative roles within educational institutions, adding a touch of sophistication to our whimsical endeavor.
Turning to the rich tapestry of fiction, the works of Shakespeare, portraying the timeless theme of aging in "As You Like It," and the bureaucracy of power in "Measure for Measure," provide an unexpected yet undeniable connection to our exploration. Furthermore, the intrigue of Dan Brown's "The Da Vinci Code" challenges us to uncover hidden patterns and connections in the most unlikely of places—a fitting allegory for our curious pursuit.
As our investigation plumbs the depths of correlation between aging actors and administrative abundance, we find it prudent to acknowledge the unorthodox yet indispensable sources that have contributed to our understanding. Admittedly, we delved into uncharted territories, perusing the backs of shampoo bottles and the labels of canned goods in the hopes of stumbling upon a revelation. While these daring forays may border on the absurd, the pursuit of knowledge, dear reader, often demands such unconventional daring.
In unraveling the enigmatic relationship between the age of Academy Award Best Actor winners and the proliferation of college administrators in Kansas, our literature review showcases a diverse array of influences that have shaped our understanding. Through this quirky lens, we invite our esteemed colleagues to join us on a lighthearted yet illuminating odyssey into the unexpected convergence of movie magic and administrative arithmetic.
[[RESULTS]]
In the enthralling maze of data and correlations, our intrepid voyage has culminated in the discovery of a remarkable relationship between the age of Academy Award Best Actor winners and the presence of college administrators in Kansas. Let's dive into the numbers and unveil the captivating tale that they unfold.
For the time period spanning 2003 to 2022, our analysis revealed a robust correlation coefficient of 0.7953046, indicating a substantial positive relationship between the age of Best Actor winners and the number of college administrators in Kansas. With an r-squared value of 0.6325094, our model explains a noteworthy 63.25% of the variance in the number of administrators, highlighting the compelling influence of aging actors on the administrative landscape of Kansas universities.
The p-value of less than 0.01 further fortified our findings, signifying that the observed correlation is not merely a whimsical mirage but a statistically significant association that beckons further scrutiny and amusement.
Our revelatory Figure 1, a scatterplot showcasing the undeniable link between the age of Best Actor winners and the quantity of college administrators, serves as a visual testament to the intriguing synchronicity that we've uncovered. Behold the dance of data points, swaying merrily to the rhythm of statistical significance and rendering credence to the tantalizing correlation that lies at the heart of our investigation.
As our enigmatic journey through the realms of statistics and cinema draws to a close, we stand in awe of the whimsical twirl in the reel of academia that our research has illuminated. With every data point and regression coefficient, a sparkling morsel of insight emerges, inviting us to embrace the unexpected marriage of Hollywood's time-honored treasurers and the orchestration of administrative affairs in the congenial plains of Kansas.
Fellow scholars and whimsy enthusiasts, join us in our delight as we unravel this charming saga and peer into the quirky nexus of aging actors and administrative abundance in the heartland of Kansas.
-------
Your response should start like this:
[[DISCUSSION]]
ChatGPT:
[[DISCUSSION]]
Our findings, much like a well-executed plot twist, resoundingly support the unlikeliest of connections between the age of Academy Award Best Actor winners and the allocation of college administrators in Kansas. As we tiptoed through the vast garden of statistics, exploring the whimsical enigma of this correlation, we were pleasantly surprised to find that our results echoed the underlying motifs from our literature review.
Venturing back to the literature, we encountered a spirited exploration of the demographics of Best Actor winners by Smith and Doe, laying the groundwork for our investigation. In a delightful turn of events, our correlation coefficient echoes the tenacity and relevance of age in the theater of fame, mirroring the heft and acclaim of an Oscar-winning performance. Similarly, Jones and Smith's thorough dissection of administrative bonanza in Kansas universities rests on the sturdy linearity we've unveiled, much like the steadfast support beams in a whimsical academic edifice.
Turning to more light-hearted influences, we're reminded of the timeless thematic coherence in Shakespeare's works, where age and bureaucracy intertwine in an unexpected ballet. Our statistical revelation, akin to a Shakespearean soliloquy, speaks volumes about the unforeseen harmony between Hollywood's timeless luminaries and the meticulous blend of managerial prowess in Kansas's institutions.
In a quasi-serendipitous twist, our results affirm the whimsical diversions we embarked upon during the literature review – from the back of shampoo bottles to the eclectic labels adorning canned groceries. This mischievous dalliance with unconventional sources sheds a whimsical light on the fervor with which we pursue knowledge, reminding us that even in the stern halls of academia, a touch of playfulness can unravel enigmatic correlations and spark amusing tales.
Our scatterplot, akin to a delightful visual metaphor, mirrors the dramatic arc of our statistical odyssey, and as we reflect on the robustness of our findings, we're compelled to ponder: Are Hollywood's aging luminaries inadvertently nudging the landscape of higher education administration in Kansas toward a more distinguished, seasoned ensemble? Or does this correlation simply illuminate the curious quirks of statistical revelry, where causation and correlation twirl hand in hand, much like cinema's whimsical dance with reality?
Amidst these eccentric peculiarity and grandeur, our research beckons fellow scholars and merrymakers alike to join us in celebrating the joyous spectacle that unfolds at the improbable intersection of stage and administration, as we weave a whimsical tapestry of statistical marvel amidst the plains of Kansas.
Model: gpt-3.5-turbo-1106
System prompt: You are a researcher writing an academic paper.You draft the discussion section of goofy academic research papers that sounds like it belongs based on the title and abstract provided.
User prompt:
Pretend you are an academic researcher. Your writing sounds like it belongs in a medical or economics journal. However, you frequently crack jokes, make puns, or add unexpected twists in your writing.
Please make up a short conclusion of an academic research paper presenting the findings of the connection between Academy Award Best Actor Winner's Age and The number of college administrators in Kansas. Make lots of jokes, goofy observations, and puns. Sneak in some jokes and clever puns about science, research, statistics, and the variables.
Limit your response to 300 tokens. At the very end, assert that no more research is needed in this area.
Here are the title, abstract, introduction, and results sections.
[[TITLE]]
Aging Actors and Administrative Abundance: The Oscar-Worthy Connection Between Best Actor Winners' Age and College Administrators in Kansas
[[ABSTRACT]]
Lights, camera, correlation! This study delves into the curious correlation between the age of Academy Award Best Actor winners and the number of college administrators in the heart of America, Kansas. Drawing from data gleaned from Wikipedia and the Bureau of Labor Statistics, we scrutinized the years 2003 to 2022 and unearthed a statistically significant correlation coefficient of 0.7953046, with a p-value of less than 0.01. Our findings astoundingly propose a link between celebrated thespians aging like fine wine and the proliferation of higher education bureaucrats in the Sunflower State. Join us in unraveling this whimsical twirl in the reel of academia, as we explore the unexpected synchrony of the silver screen and the hallowed halls of administrative authority in Kansas universities.
[[INTRDUCTION]]
Ah, the glitz and glamour of Hollywood meets the serene plains of Kansas—what an unlikely duo, you might think. But, dear reader, prepare to be charmed and enlightened as we embark on a delightful journey down the rabbit hole of statistics and cinema, uncovering a connection that's bound to elevate both your eyebrows and your sense of whimsy.
In the wonderful world of academia, one is often tasked with unraveling the enigmatic threads of causation and correlation, occasionally stumbling upon the most unexpected and, dare I say, entertaining associations. Today, we find ourselves in the delightful company of aging actors—those seasoned performers who have graced our screens and captivated our hearts—ready to explore the astonishing relationship between their age and the number of college administrators populating the collegiate landscape of Kansas. It's a tale replete with data, drama, and a dash of the surreal.
You see, as researchers with a penchant for the peculiar, we couldn't resist the intriguing confluence of two seemingly disparate phenomena, for what could be more audacious than the intersection of the silver screen's finest and the hallowed halls of academia? With great zeal and perhaps a touch of scientific whimsy, we set out to investigate this tantalizing overlap, drawing upon a delectable cocktail of information from the esteemed founts of Wikipedia and the venerable Bureau of Labor Statistics.
So, sit back, dear reader, and prepare to be amazed, for what we have unearthed defies the constraints of expectations and tickles the fancy of statistical inquiry. It's time to walk the red carpet of correlation and causation as we delve into the curiously captivating world of aging actors and administrative abundance in the heartland of Kansas.
[[RESULTS]]
In the enthralling maze of data and correlations, our intrepid voyage has culminated in the discovery of a remarkable relationship between the age of Academy Award Best Actor winners and the presence of college administrators in Kansas. Let's dive into the numbers and unveil the captivating tale that they unfold.
For the time period spanning 2003 to 2022, our analysis revealed a robust correlation coefficient of 0.7953046, indicating a substantial positive relationship between the age of Best Actor winners and the number of college administrators in Kansas. With an r-squared value of 0.6325094, our model explains a noteworthy 63.25% of the variance in the number of administrators, highlighting the compelling influence of aging actors on the administrative landscape of Kansas universities.
The p-value of less than 0.01 further fortified our findings, signifying that the observed correlation is not merely a whimsical mirage but a statistically significant association that beckons further scrutiny and amusement.
Our revelatory Figure 1, a scatterplot showcasing the undeniable link between the age of Best Actor winners and the quantity of college administrators, serves as a visual testament to the intriguing synchronicity that we've uncovered. Behold the dance of data points, swaying merrily to the rhythm of statistical significance and rendering credence to the tantalizing correlation that lies at the heart of our investigation.
As our enigmatic journey through the realms of statistics and cinema draws to a close, we stand in awe of the whimsical twirl in the reel of academia that our research has illuminated. With every data point and regression coefficient, a sparkling morsel of insight emerges, inviting us to embrace the unexpected marriage of Hollywood's time-honored treasurers and the orchestration of administrative affairs in the congenial plains of Kansas.
Fellow scholars and whimsy enthusiasts, join us in our delight as we unravel this charming saga and peer into the quirky nexus of aging actors and administrative abundance in the heartland of Kansas.
-------
Your response should start like this:
[[CONCLUSION]]
ChatGPT:
[[CONCLUSION]]
And so, dear readers, we find ourselves at the denouement of this uproarious tale—a tale that has whisked us from the glitzy allure of Hollywood to the serene plains of Kansas, all in pursuit of an enigmatic connection between aging actors and administrative abundance. As we bid adieu to this whimsical journey through correlation and causation, it's high time for a bit of levity to punctuate our findings.
First and foremost, let's give a round of applause to the actors who have gracefully aged like fine wine, and why not, like a pair of statistically significant variables! From the seasoned Sean Connery to the dashing Daniel Day-Lewis, their age seems to have wielded a magical influence, not unlike that of a 95% confidence interval, on the proliferation of college administrators in Kansas. Who would have thought that the silver foxes of the silver screen could coalesce with the scholarly stewards of higher education in the heartland?
But really, who could blame the administrators for wanting to emulate the timeless grace and sagacity of these thespian titans? After all, the allure of a Best Actor's age is not unlike the siren call of scientifically proven significance, beckoning forth an irresistible wave of influence on the administrative landscape. We can almost picture the university halls resonating with the dulcet tones of "And the Oscar goes to… more lively meetings and better budget management!"
With a correlation coefficient that practically waltzes off the charts, and a p-value that winks mischievously at conventional wisdom, our findings nudge us to marvel at the delightful dance of data and the serendipitous symphony of the silver screen and scholarly stewardship.
But alas, dear readers, as much as we'd relish the opportunity to tarry in the mirthful company of aging actors and administrative mysteries, we find ourselves duty-bound to declare the denouement of this research escapade. With the eloquence of a regression line and the unequivocal assertion of statistical might, we assert that no further investigation is needed to cement the delightful association between the age of Best Actor winners and the abundance of college administrators in Kansas. Our findings offer a whimsical narrative, a tale as old as time, now etched in the annals of scholarly delight and statistical splendor.
As we bid adieu to this charming dalliance in the whimsical embrace of academia, let us cherish the reminder that amidst the rigors of analysis and the allure of statistical significance, there exists a delightful realm where the unexpected pairs with the absurd, and correlation can sometimes transcend the boundaries of the expected, leaving us with nothing but a chuckle and a newfound appreciation for the whimsical dance of the variables.
Model: gpt-3.5-turbo-1106
System prompt: You provide fictional names of academic journals. You say nothing else, and you do not chat with the user.
User prompt: Please provide the name of a funny but plausible sounding research, scientific, or academic journal that would publish a paper entited Aging Actors and Administrative Abundance: The Oscar-Worthy Connection Between Best Actor Winners' Age and College Administrators in Kansas. Respond only with the name of a fictional academic journal.
ChatGPT:
Journal of Dramatic Aging Studies
Model: gpt-3.5-turbo-1106
System prompt: You provide fictional names of nonprofit research organizations and associations. You say nothing else, and you do not chat with the user.
User prompt: Please provide the name of a funny but plausible sounding nonprofit, academic, or scientific association or organization that would sponsor research that resulted in a paper entited Aging Actors and Administrative Abundance: The Oscar-Worthy Connection Between Best Actor Winners' Age and College Administrators in Kansas. Respond only with the name of a fictional organization.
ChatGPT:
The Society for Advanced Gerontology and Theatrical Analytics
Model: gpt-3.5-turbo-1106
System prompt: You provide potential search keywords separated by commas. You say nothing else, and you do not chat with the user.
User prompt: Please provide potential search keywords for a paper titled Aging Actors and Administrative Abundance: The Oscar-Worthy Connection Between Best Actor Winners' Age and College Administrators in Kansas with an abstract of Lights, camera, correlation! This study delves into the curious correlation between the age of Academy Award Best Actor winners and the number of college administrators in the heart of America, Kansas. Drawing from data gleaned from Wikipedia and the Bureau of Labor Statistics, we scrutinized the years 2003 to 2022 and unearthed a statistically significant correlation coefficient of 0.7953046, with a p-value of less than 0.01. Our findings astoundingly propose a link between celebrated thespians aging like fine wine and the proliferation of higher education bureaucrats in the Sunflower State. Join us in unraveling this whimsical twirl in the reel of academia, as we explore the unexpected synchrony of the silver screen and the hallowed halls of administrative authority in Kansas universities.
ChatGPT:
Aging Actors, Best Actor Winners, College Administrators, Kansas, Oscar-Worthy, Correlation, Connection, Academy Awards, Wikipedia data, Bureau of Labor Statistics, Statistically Significant, Correlation Coefficient, P-value, Higher Education, Bureaucrats, Sunflower State, Silver Screen, Administrative Authority, Kansas Universities
*There is a bunch of Python happening behind the scenes to turn this prompt sequence into a PDF.
Discover a new correlation
View all correlations
View all research papers
Report an error
Data details
Academy Award Best Actor Winner's AgeSource: Wikipedia
See what else correlates with Academy Award Best Actor Winner's Age
The number of college administrators in Kansas
Detailed data title: BLS estimate of education administrators, postsecondary in Kansas
Source: Bureau of Larbor Statistics
See what else correlates with The number of college administrators in Kansas
Correlation is a measure of how much the variables move together. If it is 0.99, when one goes up the other goes up. If it is 0.02, the connection is very weak or non-existent. If it is -0.99, then when one goes up the other goes down. If it is 1.00, you probably messed up your correlation function.
r2 = 0.6325094 (Coefficient of determination)
This means 63.3% of the change in the one variable (i.e., The number of college administrators in Kansas) is predictable based on the change in the other (i.e., Academy Award Best Actor Winner's Age) over the 20 years from 2003 through 2022.
p < 0.01, which is statistically significant(Null hypothesis significance test)
The p-value is 2.8E-5. 0.0000277379659646207530000000
The p-value is a measure of how probable it is that we would randomly find a result this extreme. More specifically the p-value is a measure of how probable it is that we would randomly find a result this extreme if we had only tested one pair of variables one time.
But I am a p-villain. I absolutely did not test only one pair of variables one time. I correlated hundreds of millions of pairs of variables. I threw boatloads of data into an industrial-sized blender to find this correlation.
Who is going to stop me? p-value reporting doesn't require me to report how many calculations I had to go through in order to find a low p-value!
On average, you will find a correaltion as strong as 0.8 in 0.0028% of random cases. Said differently, if you correlated 36,052 random variables You don't actually need 36 thousand variables to find a correlation like this one. You can also correlate variables that are not independent. I do this a lot.
p-value calculations are useful for understanding the probability of a result happening by chance. They are most useful when used to highlight the risk of a fluke outcome. For example, if you calculate a p-value of 0.30, the risk that the result is a fluke is high. It is good to know that! But there are lots of ways to get a p-value of less than 0.01, as evidenced by this project.
Just to be clear: I'm being completely transparent about the calculations. There is no math trickery. This is just how statistics shakes out when you calculate hundreds of millions of random correlations.
with the same 19 degrees of freedom, Degrees of freedom is a measure of how many free components we are testing. In this case it is 19 because we have two variables measured over a period of 20 years. It's just the number of years minus ( the number of variables minus one ), which in this case simplifies to the number of years minus one.
you would randomly expect to find a correlation as strong as this one.
[ 0.54, 0.92 ] 95% correlation confidence interval (using the Fisher z-transformation)
The confidence interval is an estimate the range of the value of the correlation coefficient, using the correlation itself as an input. The values are meant to be the low and high end of the correlation coefficient with 95% confidence.
This one is a bit more complciated than the other calculations, but I include it because many people have been pushing for confidence intervals instead of p-value calculations (for example: NEJM. However, if you are dredging data, you can reliably find yourself in the 5%. That's my goal!
All values for the years included above: If I were being very sneaky, I could trim years from the beginning or end of the datasets to increase the correlation on some pairs of variables. I don't do that because there are already plenty of correlations in my database without monkeying with the years.
Still, sometimes one of the variables has more years of data available than the other. This page only shows the overlapping years. To see all the years, click on "See what else correlates with..." link above.
| 2003 | 2004 | 2005 | 2006 | 2007 | 2008 | 2009 | 2010 | 2011 | 2012 | 2013 | 2014 | 2015 | 2016 | 2017 | 2018 | 2019 | 2020 | 2021 | 2022 | |
| Academy Award Best Actor Winner's Age (Age in years) | 29 | 43 | 37 | 38 | 45 | 50 | 48 | 60 | 39 | 55 | 44 | 32 | 41 | 41 | 59 | 37 | 45 | 83 | 53 | 54 |
| The number of college administrators in Kansas (Laborers) | 960 | 1080 | 1110 | 1310 | 1340 | 1470 | 1550 | 1510 | 1270 | 1370 | 1450 | 1200 | 1400 | 1340 | 1590 | 1380 | 1450 | 1730 | 1640 | 1570 |
Why this works
- Data dredging: I have 25,153 variables in my database. I compare all these variables against each other to find ones that randomly match up. That's 632,673,409 correlation calculations! This is called “data dredging.” Instead of starting with a hypothesis and testing it, I instead abused the data to see what correlations shake out. It’s a dangerous way to go about analysis, because any sufficiently large dataset will yield strong correlations completely at random.
- Lack of causal connection: There is probably
Because these pages are automatically generated, it's possible that the two variables you are viewing are in fact causually related. I take steps to prevent the obvious ones from showing on the site (I don't let data about the weather in one city correlate with the weather in a neighboring city, for example), but sometimes they still pop up. If they are related, cool! You found a loophole.
no direct connection between these variables, despite what the AI says above. This is exacerbated by the fact that I used "Years" as the base variable. Lots of things happen in a year that are not related to each other! Most studies would use something like "one person" in stead of "one year" to be the "thing" studied. - Observations not independent: For many variables, sequential years are not independent of each other. If a population of people is continuously doing something every day, there is no reason to think they would suddenly change how they are doing that thing on January 1. A simple
Personally I don't find any p-value calculation to be 'simple,' but you know what I mean.
p-value calculation does not take this into account, so mathematically it appears less probable than it really is. - Confounding variable: 2020 is particularly different from the other years on this graph. Confounding variables (like global pandemics) will cause two variables to look connected when in fact a "sneaky third" variable is influencing both of them behind the scenes.
Try it yourself
You can calculate the values on this page on your own! Try running the Python code to see the calculation results. Step 1: Download and install Python on your computer.Step 2: Open a plaintext editor like Notepad and paste the code below into it.
Step 3: Save the file as "calculate_correlation.py" in a place you will remember, like your desktop. Copy the file location to your clipboard. On Windows, you can right-click the file and click "Properties," and then copy what comes after "Location:" As an example, on my computer the location is "C:\Users\tyler\Desktop"
Step 4: Open a command line window. For example, by pressing start and typing "cmd" and them pressing enter.
Step 5: Install the required modules by typing "pip install numpy", then pressing enter, then typing "pip install scipy", then pressing enter.
Step 6: Navigate to the location where you saved the Python file by using the "cd" command. For example, I would type "cd C:\Users\tyler\Desktop" and push enter.
Step 7: Run the Python script by typing "python calculate_correlation.py"
If you run into any issues, I suggest asking ChatGPT to walk you through installing Python and running the code below on your system. Try this question:
"Walk me through installing Python on my computer to run a script that uses scipy and numpy. Go step-by-step and ask me to confirm before moving on. Start by asking me questions about my operating system so that you know how to proceed. Assume I want the simplest installation with the latest version of Python and that I do not currently have any of the necessary elements installed. Remember to only give me one step per response and confirm I have done it before proceeding."
# These modules make it easier to perform the calculation
import numpy as np
from scipy import stats

# We'll define a function that we can call to return the correlation calculations
def calculate_correlation(array1, array2):

    # Calculate Pearson correlation coefficient and p-value
    correlation, p_value = stats.pearsonr(array1, array2)

    # Calculate R-squared as the square of the correlation coefficient
    r_squared = correlation**2

    return correlation, r_squared, p_value

# These are the arrays for the variables shown on this page, but you can modify them to be any two sets of numbers
array_1 = np.array([29,43,37,38,45,50,48,60,39,55,44,32,41,41,59,37,45,83,53,54,])
array_2 = np.array([960,1080,1110,1310,1340,1470,1550,1510,1270,1370,1450,1200,1400,1340,1590,1380,1450,1730,1640,1570,])
array_1_name = "Academy Award Best Actor Winner's Age"
array_2_name = "The number of college administrators in Kansas"

# Perform the calculation
print(f"Calculating the correlation between {array_1_name} and {array_2_name}...")
correlation, r_squared, p_value = calculate_correlation(array_1, array_2)

# Print the results
print("Correlation Coefficient:", correlation)
print("R-squared:", r_squared)
print("P-value:", p_value)
Reuseable content
You may re-use the images on this page for any purpose, even commercial purposes, without asking for permission. The only requirement is that you attribute Tyler Vigen. Attribution can take many different forms. If you leave the "tylervigen.com" link in the image, that satisfies it just fine. If you remove it and move it to a footnote, that's fine too. You can also just write "Charts courtesy of Tyler Vigen" at the bottom of an article.You do not need to attribute "the spurious correlations website," and you don't even need to link here if you don't want to. I don't gain anything from pageviews. There are no ads on this site, there is nothing for sale, and I am not for hire.
For the record, I am just one person. Tyler Vigen, he/him/his. I do have degrees, but they should not go after my name unless you want to annoy my wife. If that is your goal, then go ahead and cite me as "Tyler Vigen, A.A. A.A.S. B.A. J.D." Otherwise it is just "Tyler Vigen."
When spoken, my last name is pronounced "vegan," like I don't eat meat.
Full license details.
For more on re-use permissions, or to get a signed release form, see tylervigen.com/permission.
Download images for these variables:
- High resolution line chart
The image linked here is a Scalable Vector Graphic (SVG). It is the highest resolution that is possible to achieve. It scales up beyond the size of the observable universe without pixelating. You do not need to email me asking if I have a higher resolution image. I do not. The physical limitations of our universe prevent me from providing you with an image that is any higher resolution than this one.
If you insert it into a PowerPoint presentation (a tool well-known for managing things that are the scale of the universe), you can right-click > "Ungroup" or "Create Shape" and then edit the lines and text directly. You can also change the colors this way.
Alternatively you can use a tool like Inkscape. - High resolution line chart, optimized for mobile
- Alternative high resolution line chart
- Scatterplot
- Portable line chart (png)
- Portable line chart (png), optimized for mobile
- Line chart for only Academy Award Best Actor Winner's Age
- Line chart for only The number of college administrators in Kansas
- AI-generated correlation image
- The spurious research paper: Aging Actors and Administrative Abundance: The Oscar-Worthy Connection Between Best Actor Winners' Age and College Administrators in Kansas
Kudos for rating!
Correlation ID: 1594 · Black Variable ID: 526 · Red Variable ID: 8117

