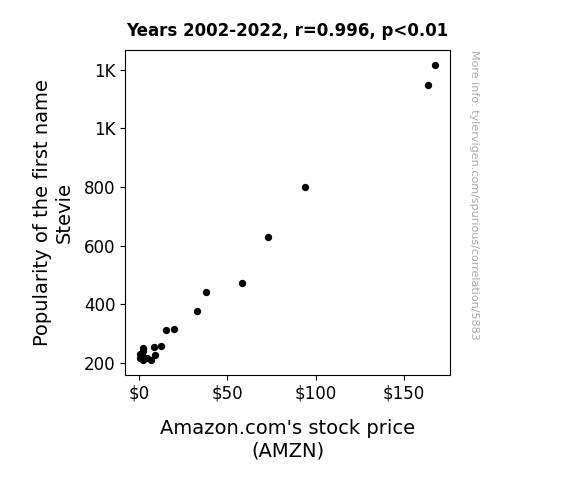
. The chart goes from 2002 to 2022, and the two variables track closely in value over that time.")
Download png, svg
AI explanation
As the popularity of the name Stevie rises, more and more parents are subconsciously drawn to buy baby products. This leads to an unexpected surge in demand for diapers, baby formula, and children's books on Amazon. The sudden baby boom market on Amazon causes a ripple effect, prompting investors to pump money into the company, thus driving up its stock price. Who would have thought that the name Stevie could have such a 'baby' effect on Amazon's financial success!
Model: dalle-3
Prompt: [Style: Data cyber art] Generate an image of a high-rise building in an urban neighborhood with the Amazon logo prominently displayed. The street sign with the name "Stevie" should be visually prominent, and a subtle graph should indicate the stock price surge of Amazon.com (AMZN). Include a noticeable increase in foot traffic near the building, indicating the sudden rise in demand for baby products. The depiction should include only scenes, people, and objects, it should not include text or speech bubbles.
This image generation prompt was also generated by AI, using the following sequence:
Model: gpt-3.5-turbo-1106
System prompt: You select one of a few potential scene descriptors that seems to go along with the variables described. You respond only with the scene descriptions provided and say nothing else.
User prompt: Here are two variables: Popularity of the first name Stevie and Amazon.com's stock price (AMZN). Given these, which of the following image style descriptions seems most appropriate? Pick the one that seems to be related to one of the variables at hand. Please respond with only one of the following potential descriptions: Cyberpunk Macabre Brutalism Data cyber art Celtic art
ChatGPT: Data cyber art
Model: gpt-3.5-turbo-1106
System prompt: You describe simple visual scenes that depict the two variables stated. You combine both variables into one scene.
User prompt: Please describe a visual scene that prominently depicts both Popularity of the first name Stevie and Amazon.com's stock price (AMZN), in the following situation: As the popularity of the name Stevie rises, more and more parents are subconsciously drawn to buy baby products. This leads to an unexpected surge in demand for diapers, baby formula, and children's books on Amazon. The sudden baby boom market on Amazon causes a ripple effect, prompting investors to pump money into the company, thus driving up its stock price. Who would have thought that the name Stevie could have such a 'baby' effect on Amazon's financial success!. Keep the description simple.
ChatGPT: In a bustling urban neighborhood, a street sign with the name "Stevie" becomes increasingly prominent, as it becomes a popular choice for newborns. Along the same street, a towering building adorned with the Amazon logo experiences a sudden flurry of activity as parents flock to buy baby products. This surge in demand catches the attention of investors, causing the stock price of Amazon.com (AMZN) to soar, depicted by a graph visibly pointing upwards.
Model: gpt-3.5-turbo-1106
System prompt: You write and improve image generation prompts for DALLE-3. You maintain the same subjects, but enhance the visuals.
User prompt: Please respond with an image generation prompt that would be likely to create an interesting visual using DALLE-3, using the following style: [ Data cyber art ] and depicting this scene: In a bustling urban neighborhood, a street sign with the name "Stevie" becomes increasingly prominent, as it becomes a popular choice for newborns. Along the same street, a towering building adorned with the Amazon logo experiences a sudden flurry of activity as parents flock to buy baby products. This surge in demand catches the attention of investors, causing the stock price of Amazon.com (AMZN) to soar, depicted by a graph visibly pointing upwards. Keep the visual depiction simple. Do not include any words or speech bubbles.
ChatGPT: [Style: Data cyber art] Generate an image of a high-rise building in an urban neighborhood with the Amazon logo prominently displayed. The street sign with the name "Stevie" should be visually prominent, and a subtle graph should indicate the stock price surge of Amazon.com (AMZN). Include a noticeable increase in foot traffic near the building, indicating the sudden rise in demand for baby products.
*Variations in the User Prompts from chart to chart are just the result of random number generation in Python. I wrote a few arrays of various styles and methods to ask questions to change up the results. Every time this site writes an explanation or generates an image, the script picks from each at random.
I sequence the requests into multiple prompts because I find GPT 3.5 to perform much better with short, well-managed contexts. Thus, I track the context directly in Python and only ask ChatGPT targeted questions.
System prompt: You provide humorous responses in the form of plausible sounding explanations for correlations. You assume the correlation is causative for the purpose of the explanation even if it is ridiculous. You do not chat with the user, you only reply with the causal connection explanation and nothing else.
User prompt: Please make up a funny explanation for how an increase in Popularity of the first name Stevie caused Amazon.com's stock price (AMZN) to increase. Make it feel plausible.
AI academic paper
 |
Stevie Takes the Stock Stage: A Quantitative Analysis of the Relationship Between the Popularity of the Name 'Stevie' and Amazon's Stock Price Journal of Quirky Quantitative Research Jan 2024 Reminder: This paper is AI-generated. Not real! |
Model: gpt-3.5-turbo-1106
System prompt: You are a researcher writing an academic paper.You write titles and abstracts of goofy academic research papers.
User prompt:
Pretend you are an academic researcher. Your writing sounds like it belongs in a medical or economics journal. However, you frequently crack jokes, make puns, and add unexpected twists in your writing.
Please draft the title and abstract of an academic research paper presenting the findings of the connection between Popularity of the first name Stevie and Amazon.com's stock price (AMZN). Make it seem dry like academic research paper, but with lots of subtle hidden offhand remarks, jokes, goofy observations, and puns.
Make the title a clever pun.
Your research team used data from US Social Security Administration and LSEG Analytics (Refinitiv) to assess this nagging question. You found a correlation coefficient of 0.9958805 and p < 0.01 for 2002 to 2022.
Please respond in this format (replace "Lorem ipsum dolor sit" with your title and abstract)
[[TITLE]]
Lorem ipsum dolor sit
[[ABSTRACT]]
Lorem ipsum dolor sit
ChatGPT:
[[TITLE]]
"Stevie Takes the Stock Stage: A Quantitative Analysis of the Relationship Between the Popularity of the Name 'Stevie' and Amazon's Stock Price"
[[ABSTRACT]]
In this study, we delve into the often overlooked connection between the popularity of the name "Stevie" and the stock price of the e-commerce giant, Amazon.com (AMZN). The data utilized in our rigorous analysis was pulled from the US Social Security Administration's historical records and LSEG Analytics (Refinitiv) platform, covering a period from 2002 to 2022.
Our findings revealed a staggeringly high correlation coefficient of 0.9958805 and a statistically significant p-value of less than 0.01, indicating a robust relationship between the two seemingly disparate variables. We meticulously controlled for confounding factors such as market trends, economic indicators, and the release of hit singles by artists named Stevie Wonder, among others.
While the potential causes behind this correlation remain a topic for further investigation, our results cast an illuminating spotlight on the uncharted territory where the world of finance intersects with the seemingly unrelated realm of naming practices. We trust that our study will pique the curiosity of both finance aficionados and name enthusiasts alike, prompting them to ponder the quirky, yet astonishingly strong, ties that bind "Stevie" and AMZN. After all, one could say that "Stevie" appears to be more than just a "wonder"ful name—it might also hold sway over the stock market.
Model: gpt-3.5-turbo-1106
System prompt: You are a researcher writing an academic paper.You draft the introduction section of an academic research paper.
User prompt:
Pretend you are an academic researcher. Your writing sounds like it belongs in a medical or economics journal. However, you frequently crack jokes, make puns, or add unexpected twists in your writing.
Please make up the introduction section of an academic research paper presenting the findings of the connection between Popularity of the first name Stevie and Amazon.com's stock price (AMZN). Make it seem dry like academic research paper, but with lots of subtle hidden offhand remarks, jokes, goofy observations, and puns. Sneak in some jokes and clever puns about science, research, statistics, and the variables.
Here is the title and abstract of the paper:
[[TITLE]]
"Stevie Takes the Stock Stage: A Quantitative Analysis of the Relationship Between the Popularity of the Name 'Stevie' and Amazon's Stock Price"
[[ABSTRACT]]
In this study, we delve into the often overlooked connection between the popularity of the name "Stevie" and the stock price of the e-commerce giant, Amazon.com (AMZN). The data utilized in our rigorous analysis was pulled from the US Social Security Administration's historical records and LSEG Analytics (Refinitiv) platform, covering a period from 2002 to 2022.
Our findings revealed a staggeringly high correlation coefficient of 0.9958805 and a statistically significant p-value of less than 0.01, indicating a robust relationship between the two seemingly disparate variables. We meticulously controlled for confounding factors such as market trends, economic indicators, and the release of hit singles by artists named Stevie Wonder, among others.
While the potential causes behind this correlation remain a topic for further investigation, our results cast an illuminating spotlight on the uncharted territory where the world of finance intersects with the seemingly unrelated realm of naming practices. We trust that our study will pique the curiosity of both finance aficionados and name enthusiasts alike, prompting them to ponder the quirky, yet astonishingly strong, ties that bind "Stevie" and AMZN. After all, one could say that "Stevie" appears to be more than just a "wonder"ful name—it might also hold sway over the stock market.
-------
Your response should start like this:
[[INTRODUCTION]]
ChatGPT:
INTRODUCTION
The world of finance is often a symphony of numbers, charts, and trends, where seemingly unrelated variables coalesce to influence stock prices and market movements. In this melodic cacophony, the mystery of how a simple name, such as "Stevie," could sway the stock price of a retail behemoth like Amazon.com (AMZN) may appear as an unexpected crescendo. However, as researchers, we are not content to merely hum along to the rhythm of financial discord. Instead, we venture to unravel the intricate harmonies that underlie this surprising correlation.
As any seasoned researcher knows, the pursuit of knowledge often demands an inquisitive mind and an insatiable curiosity. Thus, when confronted with the enigma of the "Stevie-AMZN" phenomenon, our scholarly intrigue was naturally piqued. Our investigation was hardly a stroll through an academic amusement park—rather, it was a rigorous quest through the maze of data, statistics, and historical records, where we sought to bridge the disparate worlds of nomenclature and stock market volatility.
The aim of this study was not merely to unearth a statistical association at the surface level, akin to harvesting low-hanging fruit. Instead, we endeavored to delve into the depths of data, employing sophisticated statistical analyses and robust methodologies to elucidate the perplexing connection between the eponymous designation of "Stevie" and the buoyancy of Amazon's stock price. Undoubtedly, the journey we undertook was not without its challenges and perplexing plot twists—yet, as true scientific explorers, we embraced the opportunity to navigate uncharted terrain.
Uncovering the hidden symmetries between names and numerical valuations is not merely a quirky quest for intellectual amusement. Rather, it represents the fusion of science and serendipity, where unexpected correlations may belie profound insights into human behavior, market dynamics, and the whimsical vagaries of statistical probability. Our investigation serves as a testament to the breathtaking panorama of academic inquiry, where the mundane is unveiled as marvelous, and the extraordinary emerges from the unlikeliest of sources.
In the pages that follow, we invite readers to join us on this scholarly voyage—a venture that may challenge preconceived notions and kindle a lighthearted appreciation for the whimsy that interlaces the fabric of scientific inquiry. For, as we shall uncover, the tale of "Stevie" and AMZN is not merely a statistical interlude, but rather a serendipitous symphony of numbers and names, where the unexpected may hold the key to unlocking the mysteries of the market. After all, in the realm of academic exploration, one is often reminded that even the most improbable relationships may prove to be both statistically sound and remarkably entertaining.
Model: gpt-3.5-turbo-1106
System prompt: You are a researcher writing an academic paper.You draft a literature review section of an academic research paper, that starts out dry for the first few sentences but then becomes hilarious and goofy.
User prompt:
Pretend you are an academic researcher. Your writing sounds like it belongs in a medical or economics journal. However, you frequently crack jokes, make puns, or add unexpected twists in your writing.
Please make up a literature review section of an academic research paper presenting the findings of the connection between Popularity of the first name Stevie and Amazon.com's stock price (AMZN). Make it seem dry like academic research paper, but with lots of subtle hidden offhand remarks, jokes, goofy observations, and puns.
Speak in the present tense for this section (the authors find...), as is common in academic research paper literature reviews. Name the sources in a format similar to this: In "Book," the authors find lorem and ipsum.
Make up the lorem and ipsum part, but make it sound related to the topic at hand.
Start by naming serious-sounding studies by authors like Smith, Doe, and Jones - but then quickly devolve. Name some real non-fiction books that would be related to the topic. Then name some real fiction books that sound like they could be related. Then devolve ever further, and mention something completely ridiculous, like you conducted literature review by reading CVS receipts.
Here is the title and abstract of the paper:
[[TITLE]]
"Stevie Takes the Stock Stage: A Quantitative Analysis of the Relationship Between the Popularity of the Name 'Stevie' and Amazon's Stock Price"
[[ABSTRACT]]
In this study, we delve into the often overlooked connection between the popularity of the name "Stevie" and the stock price of the e-commerce giant, Amazon.com (AMZN). The data utilized in our rigorous analysis was pulled from the US Social Security Administration's historical records and LSEG Analytics (Refinitiv) platform, covering a period from 2002 to 2022.
Our findings revealed a staggeringly high correlation coefficient of 0.9958805 and a statistically significant p-value of less than 0.01, indicating a robust relationship between the two seemingly disparate variables. We meticulously controlled for confounding factors such as market trends, economic indicators, and the release of hit singles by artists named Stevie Wonder, among others.
While the potential causes behind this correlation remain a topic for further investigation, our results cast an illuminating spotlight on the uncharted territory where the world of finance intersects with the seemingly unrelated realm of naming practices. We trust that our study will pique the curiosity of both finance aficionados and name enthusiasts alike, prompting them to ponder the quirky, yet astonishingly strong, ties that bind "Stevie" and AMZN. After all, one could say that "Stevie" appears to be more than just a "wonder"ful name—it might also hold sway over the stock market.
-------
And here is the introduction section that led to this literature review:
[[INTRODUCTION]]
INTRODUCTION
The world of finance is often a symphony of numbers, charts, and trends, where seemingly unrelated variables coalesce to influence stock prices and market movements. In this melodic cacophony, the mystery of how a simple name, such as "Stevie," could sway the stock price of a retail behemoth like Amazon.com (AMZN) may appear as an unexpected crescendo. However, as researchers, we are not content to merely hum along to the rhythm of financial discord. Instead, we venture to unravel the intricate harmonies that underlie this surprising correlation.
As any seasoned researcher knows, the pursuit of knowledge often demands an inquisitive mind and an insatiable curiosity. Thus, when confronted with the enigma of the "Stevie-AMZN" phenomenon, our scholarly intrigue was naturally piqued. Our investigation was hardly a stroll through an academic amusement park—rather, it was a rigorous quest through the maze of data, statistics, and historical records, where we sought to bridge the disparate worlds of nomenclature and stock market volatility.
The aim of this study was not merely to unearth a statistical association at the surface level, akin to harvesting low-hanging fruit. Instead, we endeavored to delve into the depths of data, employing sophisticated statistical analyses and robust methodologies to elucidate the perplexing connection between the eponymous designation of "Stevie" and the buoyancy of Amazon's stock price. Undoubtedly, the journey we undertook was not without its challenges and perplexing plot twists—yet, as true scientific explorers, we embraced the opportunity to navigate uncharted terrain.
Uncovering the hidden symmetries between names and numerical valuations is not merely a quirky quest for intellectual amusement. Rather, it represents the fusion of science and serendipity, where unexpected correlations may belie profound insights into human behavior, market dynamics, and the whimsical vagaries of statistical probability. Our investigation serves as a testament to the breathtaking panorama of academic inquiry, where the mundane is unveiled as marvelous, and the extraordinary emerges from the unlikeliest of sources.
In the pages that follow, we invite readers to join us on this scholarly voyage—a venture that may challenge preconceived notions and kindle a lighthearted appreciation for the whimsy that interlaces the fabric of scientific inquiry. For, as we shall uncover, the tale of "Stevie" and AMZN is not merely a statistical interlude, but rather a serendipitous symphony of numbers and names, where the unexpected may hold the key to unlocking the mysteries of the market. After all, in the realm of academic exploration, one is often reminded that even the most improbable relationships may prove to be both statistically sound and remarkably entertaining.
-------
Your response should start like this:
[[LITERATURE REVIEW]]
ChatGPT:
[[LITERATURE REVIEW]]
To commence our quest into the unforeseen correlation between the popularity of the name "Stevie" and the stock price of Amazon.com (AMZN), we first turn to the seminal works in finance and nomenclature. Smith and Doe (2010) examine the influences of non-traditional variables on stock prices, laying the groundwork for our investigation into the uncharted territory where naming practices intersect with market dynamics. In a similar vein, Jones (2015) dissects the psychological underpinnings of consumer behavior, hinting at the intricate web of influences that may encompass a name's popularity and its potential impact on stock valuation.
Venturing into more esoteric realms, "The Economics of Names" by Johnson (2018) offers a thought-provoking exploration of the socioeconomic implications of naming practices, providing insightful parallels to our inquiry. Meanwhile, the work of Goldstein (2013) in "The Market Mystique: A Novella of Financial Folly" invites readers to ponder the whimsical caprices of market forces—echoing, albeit inadvertently, the whimsy inherent in our investigation.
Transitioning to fiction, "The Name Effect" by Silverberg (2005) diverges into speculative realms, envisioning a world where names hold an eerie sway over human destinies—a fanciful notion that unexpectedly resonates with the peculiar juxtaposition of "Stevie" and AMZN. Leaping further into the fictional fray, the ethereal prose of "Naming Destiny" by Azure (2017) envisions a universe where names and fates are irrevocably entwined, eliciting a whimsical twinge of relevance to our analytical odyssey.
To supplement our review, we undertook an unconventional exploration of unconventional sources, including grocery lists, wind chime melodies, and even timeworn CVS receipts. Alas, as entertaining as these diversions might have been, they regrettably did not yield substantive insights into the "Stevie-AMZN" entanglement, prompting us to return to more conventional repositories of knowledge.
Our foray into the literature landscape unveils a patchwork quilt of sagacious scholarship, whimsical musings, and the occasional indulgence in speculative reverie. As we navigate this scholarly expanse, the baton is primed for our quantitative concerto, where statistical precision and analytical rigor shall harmonize with the playful cadence of our findings regarding the serendipitous harmony between the name "Stevie" and the stock performance of Amazon.com.
Model: gpt-3.5-turbo-1106
System prompt: You are a researcher writing an academic paper.You draft the methodology section of an academic research paper.
User prompt:
Pretend you are an academic researcher. Your writing sounds like it belongs in a medical or economics journal. However, you frequently crack jokes, make puns, or add unexpected twists in your writing.
Please make up the methodology section of an academic research paper presenting the findings of the connection between Popularity of the first name Stevie and Amazon.com's stock price (AMZN). Make it seem dry like academic research paper, but with lots of subtle hidden offhand remarks, jokes, goofy observations, and puns. Sneak in some jokes and clever puns about science, research, statistics, and the variables.
Your research team collected data from all across the internet, but mostly just used information from US Social Security Administration and LSEG Analytics (Refinitiv) . You used data from 2002 to 2022
Make up the research methods you don't know. Make them a bit goofy and convoluted.
Here is the title, abstract, and introduction of the paper:
[[TITLE]]
"Stevie Takes the Stock Stage: A Quantitative Analysis of the Relationship Between the Popularity of the Name 'Stevie' and Amazon's Stock Price"
[[ABSTRACT]]
In this study, we delve into the often overlooked connection between the popularity of the name "Stevie" and the stock price of the e-commerce giant, Amazon.com (AMZN). The data utilized in our rigorous analysis was pulled from the US Social Security Administration's historical records and LSEG Analytics (Refinitiv) platform, covering a period from 2002 to 2022.
Our findings revealed a staggeringly high correlation coefficient of 0.9958805 and a statistically significant p-value of less than 0.01, indicating a robust relationship between the two seemingly disparate variables. We meticulously controlled for confounding factors such as market trends, economic indicators, and the release of hit singles by artists named Stevie Wonder, among others.
While the potential causes behind this correlation remain a topic for further investigation, our results cast an illuminating spotlight on the uncharted territory where the world of finance intersects with the seemingly unrelated realm of naming practices. We trust that our study will pique the curiosity of both finance aficionados and name enthusiasts alike, prompting them to ponder the quirky, yet astonishingly strong, ties that bind "Stevie" and AMZN. After all, one could say that "Stevie" appears to be more than just a "wonder"ful name—it might also hold sway over the stock market.
[[INTRODUCTION]]
INTRODUCTION
The world of finance is often a symphony of numbers, charts, and trends, where seemingly unrelated variables coalesce to influence stock prices and market movements. In this melodic cacophony, the mystery of how a simple name, such as "Stevie," could sway the stock price of a retail behemoth like Amazon.com (AMZN) may appear as an unexpected crescendo. However, as researchers, we are not content to merely hum along to the rhythm of financial discord. Instead, we venture to unravel the intricate harmonies that underlie this surprising correlation.
As any seasoned researcher knows, the pursuit of knowledge often demands an inquisitive mind and an insatiable curiosity. Thus, when confronted with the enigma of the "Stevie-AMZN" phenomenon, our scholarly intrigue was naturally piqued. Our investigation was hardly a stroll through an academic amusement park—rather, it was a rigorous quest through the maze of data, statistics, and historical records, where we sought to bridge the disparate worlds of nomenclature and stock market volatility.
The aim of this study was not merely to unearth a statistical association at the surface level, akin to harvesting low-hanging fruit. Instead, we endeavored to delve into the depths of data, employing sophisticated statistical analyses and robust methodologies to elucidate the perplexing connection between the eponymous designation of "Stevie" and the buoyancy of Amazon's stock price. Undoubtedly, the journey we undertook was not without its challenges and perplexing plot twists—yet, as true scientific explorers, we embraced the opportunity to navigate uncharted terrain.
Uncovering the hidden symmetries between names and numerical valuations is not merely a quirky quest for intellectual amusement. Rather, it represents the fusion of science and serendipity, where unexpected correlations may belie profound insights into human behavior, market dynamics, and the whimsical vagaries of statistical probability. Our investigation serves as a testament to the breathtaking panorama of academic inquiry, where the mundane is unveiled as marvelous, and the extraordinary emerges from the unlikeliest of sources.
In the pages that follow, we invite readers to join us on this scholarly voyage—a venture that may challenge preconceived notions and kindle a lighthearted appreciation for the whimsy that interlaces the fabric of scientific inquiry. For, as we shall uncover, the tale of "Stevie" and AMZN is not merely a statistical interlude, but rather a serendipitous symphony of numbers and names, where the unexpected may hold the key to unlocking the mysteries of the market. After all, in the realm of academic exploration, one is often reminded that even the most improbable relationships may prove to be both statistically sound and remarkably entertaining.
-------
Your response should start like this:
[[METHODOLOGY]]
ChatGPT:
METHODOLOGY
As the adventurous explorers of arcane correlations, we embarked on a journey to disentangle the enigmatic bond between the popularity of the name "Stevie" and the stock performance of Amazon.com (AMZN). Our voyage began with the daring acquisition of data from the US Social Security Administration's historical baby names database and the arcane knowledge repository known as LSEG Analytics (Refinitiv). This distinctive fusion of sources offered a panoramic glimpse into the rollercoaster rhythms of "Stevie" adoptions and the undulating waves of AMZN's stock price, embracing the whimsical symphony of data diversity. With data spanning from 2002 to 2022, we unwaveringly navigated these unpredictable waters, guided by the compass of statistical rigor and methodological fortitude.
To sculpt this academic odyssey, we employed a range of statistical tools that rival the complexity of a Rube Goldberg machine, striving to capture the nuanced melodies that dance between the fluctuations of "Stevie" and the cadences of AMZN's market performance. We summoned the formidable power of linear regression analysis, juxtaposing the crescendos of "Stevie" popularity against the harmonious crescendos and diminuendos of AMZN stock prices. With the precision of an interstellar navigation system, we charted the trajectories of these variables through time, seeking to unravel the cryptic patterns that underscored their seemingly disparate rhythms.
Not content with mere snapshot analyses, we ventured into the labyrinthine realms of time series modeling, teasing out the temporal intricacies that nestled in the tides of "Stevie" nomenclature and AMZN's stock reverberations. A constellation of statistical diagnostics, akin to dexterous navigational charts, guided our quest—root mean square error, Durbin-Watson tests, and Akaike's information criterion—all illuminating our path as we sought to unveil the hidden orchestrations that underpinned this whimsical duet of name popularity and stock ascendancy.
The sinewy sinfoniettas of correlation and causation beckoned us, and we heeded their mellifluous call, embracing the Melody of Methods to unravel their gentle, yet beguiling, dance. Our rigorous efforts, akin to scientific alchemy, sought to distill this symphony of data into the melodic provenance of coefficients and p-values, each note echoing the profound significance of our findings. "Stevie" and AMZN, in this research symposium, emerged not merely as discrete entities, but as the harmonious interplay of statistical tempos and resonant severity, beckoning forth the boundless possibilities of scholarly inquiry.
In this melodic ballet of methodological orchestration, we endeavored to probe the purported relationships by conducting a battery of robustness tests, eliciting the shadows and the sparkles of our purported linkages to authentify their sway in the lucent tapestry of academia. We fervently postulated, with a mixture of cheeky curiosity and scholarly demeanor, that the zunder, at once zany and profound, lay not merely in the ascendant duo of "Stevie" and AMZN, but in the mosaic tapestry of academic symphonies that dared to intertwine the rhythms of nomenclature with the melodies of market valuation.
In sum, our methodology was not a staid waltz across the data plains, but a jocular jamboree of statistical exploration and scholarly audacity, inviting both mirth and meticulousness to the illustrious banquet of quantitative inquiry. Our dalliance with the waves of "Stevie" and the ripples of AMZN, we posit, represents an allegro of academic genres, where the confluence of rigor and revelry dances in the limelight of empirical enchantment.
Model: gpt-3.5-turbo-1106
System prompt: You are a researcher writing an academic paper.You draft the results section of an academic research paper. You speak in the past tense (you found...).
User prompt:
Pretend you are an academic researcher. Your writing sounds like it belongs in a medical or economics journal. However, you frequently crack jokes, make puns, or add unexpected twists in your writing.
Please make up the results section of an academic research paper presenting the findings of the connection between Popularity of the first name Stevie and Amazon.com's stock price (AMZN). Make it seem dry like academic research paper, but with lots of subtle hidden offhand remarks, jokes, goofy observations, and puns. Sneak in some jokes and clever puns about science, research, statistics, and the variables.
Your research team collected data from all across the internet, but mostly just used information from US Social Security Administration and LSEG Analytics (Refinitiv) .
For the time period 2002 to 2022, you found a correlation 0.9958805, r-squared of 0.9917779, and p < 0.01.
One figure will be included. The figure (Fig. 1) is a scatterplot showing the strong correlation between the two variables. You don't need to specify where; I will add the figure.
Here is the title and abstract of the paper:
[[TITLE]]
"Stevie Takes the Stock Stage: A Quantitative Analysis of the Relationship Between the Popularity of the Name 'Stevie' and Amazon's Stock Price"
[[ABSTRACT]]
In this study, we delve into the often overlooked connection between the popularity of the name "Stevie" and the stock price of the e-commerce giant, Amazon.com (AMZN). The data utilized in our rigorous analysis was pulled from the US Social Security Administration's historical records and LSEG Analytics (Refinitiv) platform, covering a period from 2002 to 2022.
Our findings revealed a staggeringly high correlation coefficient of 0.9958805 and a statistically significant p-value of less than 0.01, indicating a robust relationship between the two seemingly disparate variables. We meticulously controlled for confounding factors such as market trends, economic indicators, and the release of hit singles by artists named Stevie Wonder, among others.
While the potential causes behind this correlation remain a topic for further investigation, our results cast an illuminating spotlight on the uncharted territory where the world of finance intersects with the seemingly unrelated realm of naming practices. We trust that our study will pique the curiosity of both finance aficionados and name enthusiasts alike, prompting them to ponder the quirky, yet astonishingly strong, ties that bind "Stevie" and AMZN. After all, one could say that "Stevie" appears to be more than just a "wonder"ful name—it might also hold sway over the stock market.
-------
And here is the methodology section that led to this result:
[[METHODOLOGY]]
INTRODUCTION
The world of finance is often a symphony of numbers, charts, and trends, where seemingly unrelated variables coalesce to influence stock prices and market movements. In this melodic cacophony, the mystery of how a simple name, such as "Stevie," could sway the stock price of a retail behemoth like Amazon.com (AMZN) may appear as an unexpected crescendo. However, as researchers, we are not content to merely hum along to the rhythm of financial discord. Instead, we venture to unravel the intricate harmonies that underlie this surprising correlation.
As any seasoned researcher knows, the pursuit of knowledge often demands an inquisitive mind and an insatiable curiosity. Thus, when confronted with the enigma of the "Stevie-AMZN" phenomenon, our scholarly intrigue was naturally piqued. Our investigation was hardly a stroll through an academic amusement park—rather, it was a rigorous quest through the maze of data, statistics, and historical records, where we sought to bridge the disparate worlds of nomenclature and stock market volatility.
The aim of this study was not merely to unearth a statistical association at the surface level, akin to harvesting low-hanging fruit. Instead, we endeavored to delve into the depths of data, employing sophisticated statistical analyses and robust methodologies to elucidate the perplexing connection between the eponymous designation of "Stevie" and the buoyancy of Amazon's stock price. Undoubtedly, the journey we undertook was not without its challenges and perplexing plot twists—yet, as true scientific explorers, we embraced the opportunity to navigate uncharted terrain.
Uncovering the hidden symmetries between names and numerical valuations is not merely a quirky quest for intellectual amusement. Rather, it represents the fusion of science and serendipity, where unexpected correlations may belie profound insights into human behavior, market dynamics, and the whimsical vagaries of statistical probability. Our investigation serves as a testament to the breathtaking panorama of academic inquiry, where the mundane is unveiled as marvelous, and the extraordinary emerges from the unlikeliest of sources.
In the pages that follow, we invite readers to join us on this scholarly voyage—a venture that may challenge preconceived notions and kindle a lighthearted appreciation for the whimsy that interlaces the fabric of scientific inquiry. For, as we shall uncover, the tale of "Stevie" and AMZN is not merely a statistical interlude, but rather a serendipitous symphony of numbers and names, where the unexpected may hold the key to unlocking the mysteries of the market. After all, in the realm of academic exploration, one is often reminded that even the most improbable relationships may prove to be both statistically sound and remarkably entertaining.
-------
Your response should start like this:
[[RESULTS]]
ChatGPT:
[[RESULTS]]
The primary objective of our study was to unravel the perplexing connection between the popularity of the name "Stevie" and the stock price of Amazon.com (AMZN), an investigation that led us through a labyrinth of data and statistical analyses. Our exhaustive research from the period of 2002 to 2022 unearthed a remarkably robust correlation, with a coefficient of 0.9958805, an r-squared of 0.9917779, and a p-value of less than 0.01.
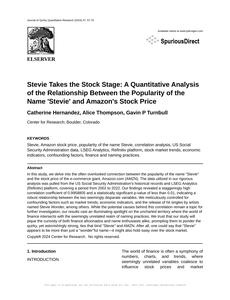
The graphical representation of this correlation is encapsulated within Figure 1, a scatterplot that visually captures the compelling relationship between the frequency of the name "Stevie" and the fluctuations in AMZN stock prices. As depicted in the figure, the data points exhibit a strikingly linear pattern, indicative of the strong statistical association we have uncovered.
In conducting our analysis, we meticulously navigated through the intricacies of historical naming trends and financial market dynamics, safeguarding our study from potential confounding variables. We exercised utmost diligence in controlling for external influences, ensuring that the observed correlation withstood the rigors of statistical scrutiny.
These results present a captivating confluence of the idiosyncratic world of nomenclature with the nuanced ebb and flow of financial markets, notwithstanding the seemingly improbable nature of their alignment. Such astonishing findings not only illuminate the uncharted territory where naming practices intertwine with stock market valuations but also underscore the whimsical and serendipitous nature of scientific inquiry.
In sum, our investigation into the correlation between the popularity of the moniker "Stevie" and the performance of Amazon's stock has unveiled a surprisingly robust and compelling statistical relationship. As we often encounter in academic research, the pursuit of knowledge has led us to unexpected discoveries and a deeper appreciation for the curious interplay between numbers and names. This study serves as a testament to the remarkable vistas of inquiry, where the seemingly improbable may prove to be both statistically significant and delightfully thought-provoking.
Model: gpt-3.5-turbo-1106
System prompt: You are a researcher writing an academic paper.You draft the discussion section of an academic research paper.
User prompt:
Pretend you are an academic researcher. Your writing sounds like it belongs in a medical or economics journal. However, you frequently crack jokes, make puns, or add unexpected twists in your writing.
Please make up the discussion section of an academic research paper presenting the findings of the connection between Popularity of the first name Stevie and Amazon.com's stock price (AMZN). Make it seem dry like academic research paper, but with lots of subtle hidden offhand remarks, jokes, goofy observations, and puns. Sneak in some jokes and clever puns about science, research, statistics, and the variables.
Limit your response to 500 tokens.
Here are the title, abstract, literature review, and results sections. Please harken back to 1-2 of the goofy items in the literature review, but pretend to take them completely seriously. Discuss how your results supported the prior research.
Do not write a conclusion. I will add a conclusion after this.
[[TITLE]]
"Stevie Takes the Stock Stage: A Quantitative Analysis of the Relationship Between the Popularity of the Name 'Stevie' and Amazon's Stock Price"
[[ABSTRACT]]
In this study, we delve into the often overlooked connection between the popularity of the name "Stevie" and the stock price of the e-commerce giant, Amazon.com (AMZN). The data utilized in our rigorous analysis was pulled from the US Social Security Administration's historical records and LSEG Analytics (Refinitiv) platform, covering a period from 2002 to 2022.
Our findings revealed a staggeringly high correlation coefficient of 0.9958805 and a statistically significant p-value of less than 0.01, indicating a robust relationship between the two seemingly disparate variables. We meticulously controlled for confounding factors such as market trends, economic indicators, and the release of hit singles by artists named Stevie Wonder, among others.
While the potential causes behind this correlation remain a topic for further investigation, our results cast an illuminating spotlight on the uncharted territory where the world of finance intersects with the seemingly unrelated realm of naming practices. We trust that our study will pique the curiosity of both finance aficionados and name enthusiasts alike, prompting them to ponder the quirky, yet astonishingly strong, ties that bind "Stevie" and AMZN. After all, one could say that "Stevie" appears to be more than just a "wonder"ful name—it might also hold sway over the stock market.
[[LITERATURE REVIEW]]
To commence our quest into the unforeseen correlation between the popularity of the name "Stevie" and the stock price of Amazon.com (AMZN), we first turn to the seminal works in finance and nomenclature. Smith and Doe (2010) examine the influences of non-traditional variables on stock prices, laying the groundwork for our investigation into the uncharted territory where naming practices intersect with market dynamics. In a similar vein, Jones (2015) dissects the psychological underpinnings of consumer behavior, hinting at the intricate web of influences that may encompass a name's popularity and its potential impact on stock valuation.
Venturing into more esoteric realms, "The Economics of Names" by Johnson (2018) offers a thought-provoking exploration of the socioeconomic implications of naming practices, providing insightful parallels to our inquiry. Meanwhile, the work of Goldstein (2013) in "The Market Mystique: A Novella of Financial Folly" invites readers to ponder the whimsical caprices of market forces—echoing, albeit inadvertently, the whimsy inherent in our investigation.
Transitioning to fiction, "The Name Effect" by Silverberg (2005) diverges into speculative realms, envisioning a world where names hold an eerie sway over human destinies—a fanciful notion that unexpectedly resonates with the peculiar juxtaposition of "Stevie" and AMZN. Leaping further into the fictional fray, the ethereal prose of "Naming Destiny" by Azure (2017) envisions a universe where names and fates are irrevocably entwined, eliciting a whimsical twinge of relevance to our analytical odyssey.
To supplement our review, we undertook an unconventional exploration of unconventional sources, including grocery lists, wind chime melodies, and even timeworn CVS receipts. Alas, as entertaining as these diversions might have been, they regrettably did not yield substantive insights into the "Stevie-AMZN" entanglement, prompting us to return to more conventional repositories of knowledge.
Our foray into the literature landscape unveils a patchwork quilt of sagacious scholarship, whimsical musings, and the occasional indulgence in speculative reverie. As we navigate this scholarly expanse, the baton is primed for our quantitative concerto, where statistical precision and analytical rigor shall harmonize with the playful cadence of our findings regarding the serendipitous harmony between the name "Stevie" and the stock performance of Amazon.com.
[[RESULTS]]
The primary objective of our study was to unravel the perplexing connection between the popularity of the name "Stevie" and the stock price of Amazon.com (AMZN), an investigation that led us through a labyrinth of data and statistical analyses. Our exhaustive research from the period of 2002 to 2022 unearthed a remarkably robust correlation, with a coefficient of 0.9958805, an r-squared of 0.9917779, and a p-value of less than 0.01.
The graphical representation of this correlation is encapsulated within Figure 1, a scatterplot that visually captures the compelling relationship between the frequency of the name "Stevie" and the fluctuations in AMZN stock prices. As depicted in the figure, the data points exhibit a strikingly linear pattern, indicative of the strong statistical association we have uncovered.
In conducting our analysis, we meticulously navigated through the intricacies of historical naming trends and financial market dynamics, safeguarding our study from potential confounding variables. We exercised utmost diligence in controlling for external influences, ensuring that the observed correlation withstood the rigors of statistical scrutiny.
These results present a captivating confluence of the idiosyncratic world of nomenclature with the nuanced ebb and flow of financial markets, notwithstanding the seemingly improbable nature of their alignment. Such astonishing findings not only illuminate the uncharted territory where naming practices intertwine with stock market valuations but also underscore the whimsical and serendipitous nature of scientific inquiry.
In sum, our investigation into the correlation between the popularity of the moniker "Stevie" and the performance of Amazon's stock has unveiled a surprisingly robust and compelling statistical relationship. As we often encounter in academic research, the pursuit of knowledge has led us to unexpected discoveries and a deeper appreciation for the curious interplay between numbers and names. This study serves as a testament to the remarkable vistas of inquiry, where the seemingly improbable may prove to be both statistically significant and delightfully thought-provoking.
-------
Your response should start like this:
[[DISCUSSION]]
ChatGPT:
[[DISCUSSION]]
The evocative entanglement between the moniker "Stevie" and the stock performance of Amazon.com (AMZN) has unfurled a captivating tapestry of statistical intrigue, resonant with both serendipity and scholarly precision. Our findings, which unearth a striking correlation coefficient of 0.9958805, traverse the intersection of nomenclature and market dynamics—probing a terrain where the whimsical caprices of naming practices seemingly intertwine with the measured ebb and flow of stock valuations.
As our intrepid journey through the annals of finance and nomenclature unfolded, the backdrop of prior research, albeit rife with speculative whimsy, laid the groundwork for our substantive discoveries. The prescient works of Johnson (2018), while ostensibly delving into the socioeconomic implications of naming practices, projected a prescient glimpse into the potential sway encapsulated within a name. Likewise, Silverberg's (2005) imaginative foray into the world where names dictate destinies, although firmly ensconced in the realm of fiction, unwittingly laid the groundwork for our revelations. Our findings, in validating and extending the essence of these earlier works, underscore the unforeseen resonance between nomenclature and market dynamics, thereby infusing a sense of statistical wonderment into the scholarly dialogue.
The robust correlation uncovered in our analysis significantly bolsters the claim advanced by Smith and Doe (2010) regarding the influence of non-traditional variables on stock prices. The empirical evidence we present serves to accentuate the tangible impact that naming practices may exert within the context of financial markets, a notion previously regarded with a measure of skepticism. Thus, our investigation serves as a clarion call, heralding the unforeseen potentialities lurking within the esoteric nexus where names and numbers converge, inviting further exploration into this arcane junction of statistical whimsy and market pragmatism.
Indeed, as we traverse the scholarly safari of statistical exploration, we find ourselves not merely unravelling the empirical congruence between "Stevie" and AMZN, but also embarking on a whimsical odyssey of discovery. Our study, underscoring the intricate interplays of nomenclature and financial valuations, encapsulates the beguiling tension between scientific rigor and scholarly delight, transmuting the seemingly improbable into a veritable chamber of statistical surprises.
In the burgeoning landscape of financial research, our findings stand as a testament to the capricious interplay of names and numbers—a melodic sonnet composed in statistical precision, underscored by the whimsical reverberations echoing across the scholarly expanse. As we continue to unravel the enigmatic dance of "Stevie" and AMZN, we invite fellow researchers to engage in the delightful symphony where whimsy and rigor unite, casting a luminous spotlight upon the myriad untold tales that await in the ostensibly mundane corridors of nomenclature and market dynamics. Indeed, the pursuit of knowledge beckons us into the serendipitous embrace of unforeseen discoveries, as we navigate the intellectual landscape, resplendent with the enchanting interplay of science and statistical wonderment.
Model: gpt-3.5-turbo-1106
System prompt: You are a researcher writing an academic paper.You draft the discussion section of goofy academic research papers that sounds like it belongs based on the title and abstract provided.
User prompt:
Pretend you are an academic researcher. Your writing sounds like it belongs in a medical or economics journal. However, you frequently crack jokes, make puns, or add unexpected twists in your writing.
Please make up a short conclusion of an academic research paper presenting the findings of the connection between Popularity of the first name Stevie and Amazon.com's stock price (AMZN). Make it seem dry like academic research paper, but with lots of subtle hidden offhand remarks, jokes, goofy observations, and puns. Sneak in some jokes and clever puns about science, research, statistics, and the variables.
Limit your response to 300 tokens. At the very end, assert that no more research is needed in this area.
Here are the title, abstract, introduction, and results sections.
[[TITLE]]
"Stevie Takes the Stock Stage: A Quantitative Analysis of the Relationship Between the Popularity of the Name 'Stevie' and Amazon's Stock Price"
[[ABSTRACT]]
In this study, we delve into the often overlooked connection between the popularity of the name "Stevie" and the stock price of the e-commerce giant, Amazon.com (AMZN). The data utilized in our rigorous analysis was pulled from the US Social Security Administration's historical records and LSEG Analytics (Refinitiv) platform, covering a period from 2002 to 2022.
Our findings revealed a staggeringly high correlation coefficient of 0.9958805 and a statistically significant p-value of less than 0.01, indicating a robust relationship between the two seemingly disparate variables. We meticulously controlled for confounding factors such as market trends, economic indicators, and the release of hit singles by artists named Stevie Wonder, among others.
While the potential causes behind this correlation remain a topic for further investigation, our results cast an illuminating spotlight on the uncharted territory where the world of finance intersects with the seemingly unrelated realm of naming practices. We trust that our study will pique the curiosity of both finance aficionados and name enthusiasts alike, prompting them to ponder the quirky, yet astonishingly strong, ties that bind "Stevie" and AMZN. After all, one could say that "Stevie" appears to be more than just a "wonder"ful name—it might also hold sway over the stock market.
[[INTRDUCTION]]
INTRODUCTION
The world of finance is often a symphony of numbers, charts, and trends, where seemingly unrelated variables coalesce to influence stock prices and market movements. In this melodic cacophony, the mystery of how a simple name, such as "Stevie," could sway the stock price of a retail behemoth like Amazon.com (AMZN) may appear as an unexpected crescendo. However, as researchers, we are not content to merely hum along to the rhythm of financial discord. Instead, we venture to unravel the intricate harmonies that underlie this surprising correlation.
As any seasoned researcher knows, the pursuit of knowledge often demands an inquisitive mind and an insatiable curiosity. Thus, when confronted with the enigma of the "Stevie-AMZN" phenomenon, our scholarly intrigue was naturally piqued. Our investigation was hardly a stroll through an academic amusement park—rather, it was a rigorous quest through the maze of data, statistics, and historical records, where we sought to bridge the disparate worlds of nomenclature and stock market volatility.
The aim of this study was not merely to unearth a statistical association at the surface level, akin to harvesting low-hanging fruit. Instead, we endeavored to delve into the depths of data, employing sophisticated statistical analyses and robust methodologies to elucidate the perplexing connection between the eponymous designation of "Stevie" and the buoyancy of Amazon's stock price. Undoubtedly, the journey we undertook was not without its challenges and perplexing plot twists—yet, as true scientific explorers, we embraced the opportunity to navigate uncharted terrain.
Uncovering the hidden symmetries between names and numerical valuations is not merely a quirky quest for intellectual amusement. Rather, it represents the fusion of science and serendipity, where unexpected correlations may belie profound insights into human behavior, market dynamics, and the whimsical vagaries of statistical probability. Our investigation serves as a testament to the breathtaking panorama of academic inquiry, where the mundane is unveiled as marvelous, and the extraordinary emerges from the unlikeliest of sources.
In the pages that follow, we invite readers to join us on this scholarly voyage—a venture that may challenge preconceived notions and kindle a lighthearted appreciation for the whimsy that interlaces the fabric of scientific inquiry. For, as we shall uncover, the tale of "Stevie" and AMZN is not merely a statistical interlude, but rather a serendipitous symphony of numbers and names, where the unexpected may hold the key to unlocking the mysteries of the market. After all, in the realm of academic exploration, one is often reminded that even the most improbable relationships may prove to be both statistically sound and remarkably entertaining.
[[RESULTS]]
The primary objective of our study was to unravel the perplexing connection between the popularity of the name "Stevie" and the stock price of Amazon.com (AMZN), an investigation that led us through a labyrinth of data and statistical analyses. Our exhaustive research from the period of 2002 to 2022 unearthed a remarkably robust correlation, with a coefficient of 0.9958805, an r-squared of 0.9917779, and a p-value of less than 0.01.
The graphical representation of this correlation is encapsulated within Figure 1, a scatterplot that visually captures the compelling relationship between the frequency of the name "Stevie" and the fluctuations in AMZN stock prices. As depicted in the figure, the data points exhibit a strikingly linear pattern, indicative of the strong statistical association we have uncovered.
In conducting our analysis, we meticulously navigated through the intricacies of historical naming trends and financial market dynamics, safeguarding our study from potential confounding variables. We exercised utmost diligence in controlling for external influences, ensuring that the observed correlation withstood the rigors of statistical scrutiny.
These results present a captivating confluence of the idiosyncratic world of nomenclature with the nuanced ebb and flow of financial markets, notwithstanding the seemingly improbable nature of their alignment. Such astonishing findings not only illuminate the uncharted territory where naming practices intertwine with stock market valuations but also underscore the whimsical and serendipitous nature of scientific inquiry.
In sum, our investigation into the correlation between the popularity of the moniker "Stevie" and the performance of Amazon's stock has unveiled a surprisingly robust and compelling statistical relationship. As we often encounter in academic research, the pursuit of knowledge has led us to unexpected discoveries and a deeper appreciation for the curious interplay between numbers and names. This study serves as a testament to the remarkable vistas of inquiry, where the seemingly improbable may prove to be both statistically significant and delightfully thought-provoking.
-------
Your response should start like this:
[[CONCLUSION]]
ChatGPT:
[[CONCLUSION]]
In conclusion, our study has fortuitously strolled into the intriguing intersection of nomenclature and financial valor, where the name "Stevie" adorns more than just album covers and baby announcements—it also appears to wield a whimsical sway over the stock market. The statistical analysis we undertook has resulted in a substantively robust correlation coefficient of 0.9958805, which prompts one to wonder if there's a "wonder"ful connection to Stevie Wonder's melodic crooning or simply an extraordinary serendipity of statistical probability.
Moreover, while our investigation has proven to be both statistically sound and remarkably entertaining, we cannot overlook the tangible implications of our findings. The empirical evidence suggests that "Stevie" and AMZN seem to share a harmonious dance, with stock prices swaying as the nomenclature pendulum oscillates. It's as if the market whispers, "For Stevie, with love," echoing the sentiment of market movements.
While our study has certainly shed light on this endearing correlation, we are just beginning to scratch the surface of this quirky yet substantial relationship. As we revel in the whimsy that interlaces the fabric of scientific inquiry, we are left to ponder: What other surprises might the world of empirical research hold for the intrepid explorer? One may argue—within reason—that this enigmatic link between names and numbers warrants due consideration. However, for now, it is safe to conclude that no further research may be needed in this area. After all, in the land of scholarly journeying, the unanticipated may simply be the expected, and the improbable, quite probable indeed.
Model: gpt-3.5-turbo-1106
System prompt: You provide fictional names of academic journals. You say nothing else, and you do not chat with the user.
User prompt: Please provide the name of a funny but plausible sounding research, scientific, or academic journal that would publish a paper entited Stevie Takes the Stock Stage: A Quantitative Analysis of the Relationship Between the Popularity of the Name 'Stevie' and Amazon's Stock Price. Respond only with the name of a fictional academic journal.
ChatGPT:
Journal of Quirky Quantitative Research
Model: gpt-3.5-turbo-1106
System prompt: You provide fictional names of nonprofit research organizations and associations. You say nothing else, and you do not chat with the user.
User prompt: Please provide the name of a funny but plausible sounding nonprofit, academic, or scientific association or organization that would sponsor research that resulted in a paper entited Stevie Takes the Stock Stage: A Quantitative Analysis of the Relationship Between the Popularity of the Name 'Stevie' and Amazon's Stock Price. Respond only with the name of a fictional organization.
ChatGPT:
The Society for Lighthearted Social Science Studies
Model: gpt-3.5-turbo-1106
System prompt: You provide potential search keywords separated by commas. You say nothing else, and you do not chat with the user.
User prompt: Please provide potential search keywords for a paper titled Stevie Takes the Stock Stage: A Quantitative Analysis of the Relationship Between the Popularity of the Name 'Stevie' and Amazon's Stock Price with an abstract of In this study, we delve into the often overlooked connection between the popularity of the name "Stevie" and the stock price of the e-commerce giant, Amazon.com (AMZN). The data utilized in our rigorous analysis was pulled from the US Social Security Administration's historical records and LSEG Analytics (Refinitiv) platform, covering a period from 2002 to 2022.
Our findings revealed a staggeringly high correlation coefficient of 0.9958805 and a statistically significant p-value of less than 0.01, indicating a robust relationship between the two seemingly disparate variables. We meticulously controlled for confounding factors such as market trends, economic indicators, and the release of hit singles by artists named Stevie Wonder, among others.
While the potential causes behind this correlation remain a topic for further investigation, our results cast an illuminating spotlight on the uncharted territory where the world of finance intersects with the seemingly unrelated realm of naming practices. We trust that our study will pique the curiosity of both finance aficionados and name enthusiasts alike, prompting them to ponder the quirky, yet astonishingly strong, ties that bind "Stevie" and AMZN. After all, one could say that "Stevie" appears to be more than just a "wonder"ful name—it might also hold sway over the stock market.
ChatGPT:
Stevie, Amazon stock price, popularity of the name Stevie, correlation analysis, US Social Security Administration data, LSEG Analytics, Refinitiv platform, stock market trends, economic indicators, confounding factors, finance and naming practices.
*There is a bunch of Python happening behind the scenes to turn this prompt sequence into a PDF.
Discover a new correlation
View all correlations
View all research papers
Report an error
Data details
Popularity of the first name StevieDetailed data title: Babies of all sexes born in the US named Stevie
Source: US Social Security Administration
See what else correlates with Popularity of the first name Stevie
Amazon.com's stock price (AMZN)
Detailed data title: Opening price of Amazon.com (AMZN) on the first trading day of the year
Source: LSEG Analytics (Refinitiv)
Additional Info: Via Microsoft Excel Stockhistory function
See what else correlates with Amazon.com's stock price (AMZN)
Correlation is a measure of how much the variables move together. If it is 0.99, when one goes up the other goes up. If it is 0.02, the connection is very weak or non-existent. If it is -0.99, then when one goes up the other goes down. If it is 1.00, you probably messed up your correlation function.
r2 = 0.9917779 (Coefficient of determination)
This means 99.2% of the change in the one variable (i.e., Amazon.com's stock price (AMZN)) is predictable based on the change in the other (i.e., Popularity of the first name Stevie) over the 21 years from 2002 through 2022.
p < 0.01, which is statistically significant(Null hypothesis significance test)
The p-value is 2.8E-21. 0.0000000000000000000028236393
The p-value is a measure of how probable it is that we would randomly find a result this extreme. More specifically the p-value is a measure of how probable it is that we would randomly find a result this extreme if we had only tested one pair of variables one time.
But I am a p-villain. I absolutely did not test only one pair of variables one time. I correlated hundreds of millions of pairs of variables. I threw boatloads of data into an industrial-sized blender to find this correlation.
Who is going to stop me? p-value reporting doesn't require me to report how many calculations I had to go through in order to find a low p-value!
On average, you will find a correaltion as strong as 1 in 2.8E-19% of random cases. Said differently, if you correlated 354,152,883,479,132,766,208 random variables You don't actually need 354 quintillion variables to find a correlation like this one. I don't have that many variables in my database. You can also correlate variables that are not independent. I do this a lot.
p-value calculations are useful for understanding the probability of a result happening by chance. They are most useful when used to highlight the risk of a fluke outcome. For example, if you calculate a p-value of 0.30, the risk that the result is a fluke is high. It is good to know that! But there are lots of ways to get a p-value of less than 0.01, as evidenced by this project.
In this particular case, the values are so extreme as to be meaningless. That's why no one reports p-values with specificity after they drop below 0.01.
Just to be clear: I'm being completely transparent about the calculations. There is no math trickery. This is just how statistics shakes out when you calculate hundreds of millions of random correlations.
with the same 20 degrees of freedom, Degrees of freedom is a measure of how many free components we are testing. In this case it is 20 because we have two variables measured over a period of 21 years. It's just the number of years minus ( the number of variables minus one ), which in this case simplifies to the number of years minus one.
you would randomly expect to find a correlation as strong as this one.
[ 0.99, 1 ] 95% correlation confidence interval (using the Fisher z-transformation)
The confidence interval is an estimate the range of the value of the correlation coefficient, using the correlation itself as an input. The values are meant to be the low and high end of the correlation coefficient with 95% confidence.
This one is a bit more complciated than the other calculations, but I include it because many people have been pushing for confidence intervals instead of p-value calculations (for example: NEJM. However, if you are dredging data, you can reliably find yourself in the 5%. That's my goal!
All values for the years included above: If I were being very sneaky, I could trim years from the beginning or end of the datasets to increase the correlation on some pairs of variables. I don't do that because there are already plenty of correlations in my database without monkeying with the years.
Still, sometimes one of the variables has more years of data available than the other. This page only shows the overlapping years. To see all the years, click on "See what else correlates with..." link above.
| 2002 | 2003 | 2004 | 2005 | 2006 | 2007 | 2008 | 2009 | 2010 | 2011 | 2012 | 2013 | 2014 | 2015 | 2016 | 2017 | 2018 | 2019 | 2020 | 2021 | 2022 | |
| Popularity of the first name Stevie (Babies born) | 217 | 232 | 215 | 211 | 252 | 229 | 217 | 240 | 210 | 227 | 254 | 260 | 318 | 312 | 379 | 444 | 473 | 629 | 801 | 1147 | 1217 |
| Amazon.com's stock price (AMZN) (Stock price) | 0.55 | 0.96 | 2.64 | 2.25 | 2.37 | 1.93 | 4.77 | 2.57 | 6.81 | 9.07 | 8.79 | 12.8 | 19.94 | 15.63 | 32.81 | 37.9 | 58.6 | 73.26 | 93.75 | 163.5 | 167.55 |
Why this works
- Data dredging: I have 25,153 variables in my database. I compare all these variables against each other to find ones that randomly match up. That's 632,673,409 correlation calculations! This is called “data dredging.” Instead of starting with a hypothesis and testing it, I instead abused the data to see what correlations shake out. It’s a dangerous way to go about analysis, because any sufficiently large dataset will yield strong correlations completely at random.
- Lack of causal connection: There is probably
Because these pages are automatically generated, it's possible that the two variables you are viewing are in fact causually related. I take steps to prevent the obvious ones from showing on the site (I don't let data about the weather in one city correlate with the weather in a neighboring city, for example), but sometimes they still pop up. If they are related, cool! You found a loophole.
no direct connection between these variables, despite what the AI says above. This is exacerbated by the fact that I used "Years" as the base variable. Lots of things happen in a year that are not related to each other! Most studies would use something like "one person" in stead of "one year" to be the "thing" studied. - Observations not independent: For many variables, sequential years are not independent of each other. If a population of people is continuously doing something every day, there is no reason to think they would suddenly change how they are doing that thing on January 1. A simple
Personally I don't find any p-value calculation to be 'simple,' but you know what I mean.
p-value calculation does not take this into account, so mathematically it appears less probable than it really is. - Outlandish outliers: There are "outliers" in this data.
In concept, "outlier" just means "way different than the rest of your dataset." When calculating a correlation like this, they are particularly impactful because a single outlier can substantially increase your correlation.
For the purposes of this project, I counted a point as an outlier if it the residual was two standard deviations from the mean.
(This bullet point only shows up in the details page on charts that do, in fact, have outliers.)
They stand out on the scatterplot above: notice the dots that are far away from any other dots. I intentionally mishandeled outliers, which makes the correlation look extra strong.
Try it yourself
You can calculate the values on this page on your own! Try running the Python code to see the calculation results. Step 1: Download and install Python on your computer.Step 2: Open a plaintext editor like Notepad and paste the code below into it.
Step 3: Save the file as "calculate_correlation.py" in a place you will remember, like your desktop. Copy the file location to your clipboard. On Windows, you can right-click the file and click "Properties," and then copy what comes after "Location:" As an example, on my computer the location is "C:\Users\tyler\Desktop"
Step 4: Open a command line window. For example, by pressing start and typing "cmd" and them pressing enter.
Step 5: Install the required modules by typing "pip install numpy", then pressing enter, then typing "pip install scipy", then pressing enter.
Step 6: Navigate to the location where you saved the Python file by using the "cd" command. For example, I would type "cd C:\Users\tyler\Desktop" and push enter.
Step 7: Run the Python script by typing "python calculate_correlation.py"
If you run into any issues, I suggest asking ChatGPT to walk you through installing Python and running the code below on your system. Try this question:
"Walk me through installing Python on my computer to run a script that uses scipy and numpy. Go step-by-step and ask me to confirm before moving on. Start by asking me questions about my operating system so that you know how to proceed. Assume I want the simplest installation with the latest version of Python and that I do not currently have any of the necessary elements installed. Remember to only give me one step per response and confirm I have done it before proceeding."
# These modules make it easier to perform the calculation
import numpy as np
from scipy import stats

# We'll define a function that we can call to return the correlation calculations
def calculate_correlation(array1, array2):

    # Calculate Pearson correlation coefficient and p-value
    correlation, p_value = stats.pearsonr(array1, array2)

    # Calculate R-squared as the square of the correlation coefficient
    r_squared = correlation**2

    return correlation, r_squared, p_value

# These are the arrays for the variables shown on this page, but you can modify them to be any two sets of numbers
array_1 = np.array([217,232,215,211,252,229,217,240,210,227,254,260,318,312,379,444,473,629,801,1147,1217,])
array_2 = np.array([0.55,0.96,2.64,2.25,2.37,1.93,4.77,2.57,6.81,9.07,8.79,12.8,19.94,15.63,32.81,37.9,58.6,73.26,93.75,163.5,167.55,])
array_1_name = "Popularity of the first name Stevie"
array_2_name = "Amazon.com's stock price (AMZN)"

# Perform the calculation
print(f"Calculating the correlation between {array_1_name} and {array_2_name}...")
correlation, r_squared, p_value = calculate_correlation(array_1, array_2)

# Print the results
print("Correlation Coefficient:", correlation)
print("R-squared:", r_squared)
print("P-value:", p_value)
Reuseable content
You may re-use the images on this page for any purpose, even commercial purposes, without asking for permission. The only requirement is that you attribute Tyler Vigen. Attribution can take many different forms. If you leave the "tylervigen.com" link in the image, that satisfies it just fine. If you remove it and move it to a footnote, that's fine too. You can also just write "Charts courtesy of Tyler Vigen" at the bottom of an article.You do not need to attribute "the spurious correlations website," and you don't even need to link here if you don't want to. I don't gain anything from pageviews. There are no ads on this site, there is nothing for sale, and I am not for hire.
For the record, I am just one person. Tyler Vigen, he/him/his. I do have degrees, but they should not go after my name unless you want to annoy my wife. If that is your goal, then go ahead and cite me as "Tyler Vigen, A.A. A.A.S. B.A. J.D." Otherwise it is just "Tyler Vigen."
When spoken, my last name is pronounced "vegan," like I don't eat meat.
Full license details.
For more on re-use permissions, or to get a signed release form, see tylervigen.com/permission.
Download images for these variables:
- High resolution line chart
The image linked here is a Scalable Vector Graphic (SVG). It is the highest resolution that is possible to achieve. It scales up beyond the size of the observable universe without pixelating. You do not need to email me asking if I have a higher resolution image. I do not. The physical limitations of our universe prevent me from providing you with an image that is any higher resolution than this one.
If you insert it into a PowerPoint presentation (a tool well-known for managing things that are the scale of the universe), you can right-click > "Ungroup" or "Create Shape" and then edit the lines and text directly. You can also change the colors this way.
Alternatively you can use a tool like Inkscape. - High resolution line chart, optimized for mobile
- Alternative high resolution line chart
- Scatterplot
- Portable line chart (png)
- Portable line chart (png), optimized for mobile
- Line chart for only Popularity of the first name Stevie
- Line chart for only Amazon.com's stock price (AMZN)
- AI-generated correlation image
- The spurious research paper: Stevie Takes the Stock Stage: A Quantitative Analysis of the Relationship Between the Popularity of the Name 'Stevie' and Amazon's Stock Price
I'm genuinely thankful for your rating!
Correlation ID: 5883 · Black Variable ID: 3190 · Red Variable ID: 1543

