
Download png, svg
AI explanation
As the name Jarod gained popularity, more and more people couldn't help but "emulate" him. Unfortunately, Jarod had a strange affinity for releasing helium balloons with messages attached, causing a surge in balloon litter in Greenwood. These balloons were getting tangled in power lines and causing small outages, leading to an increase in air pollution as backup generators were fired up to meet the rising demand for electricity. And that's how the Jarod trend in naming led to a not-so-"clean-air" craze in Greenwood, South Carolina! The moral of the story? Let's strive for names that don't "balloon" out of control!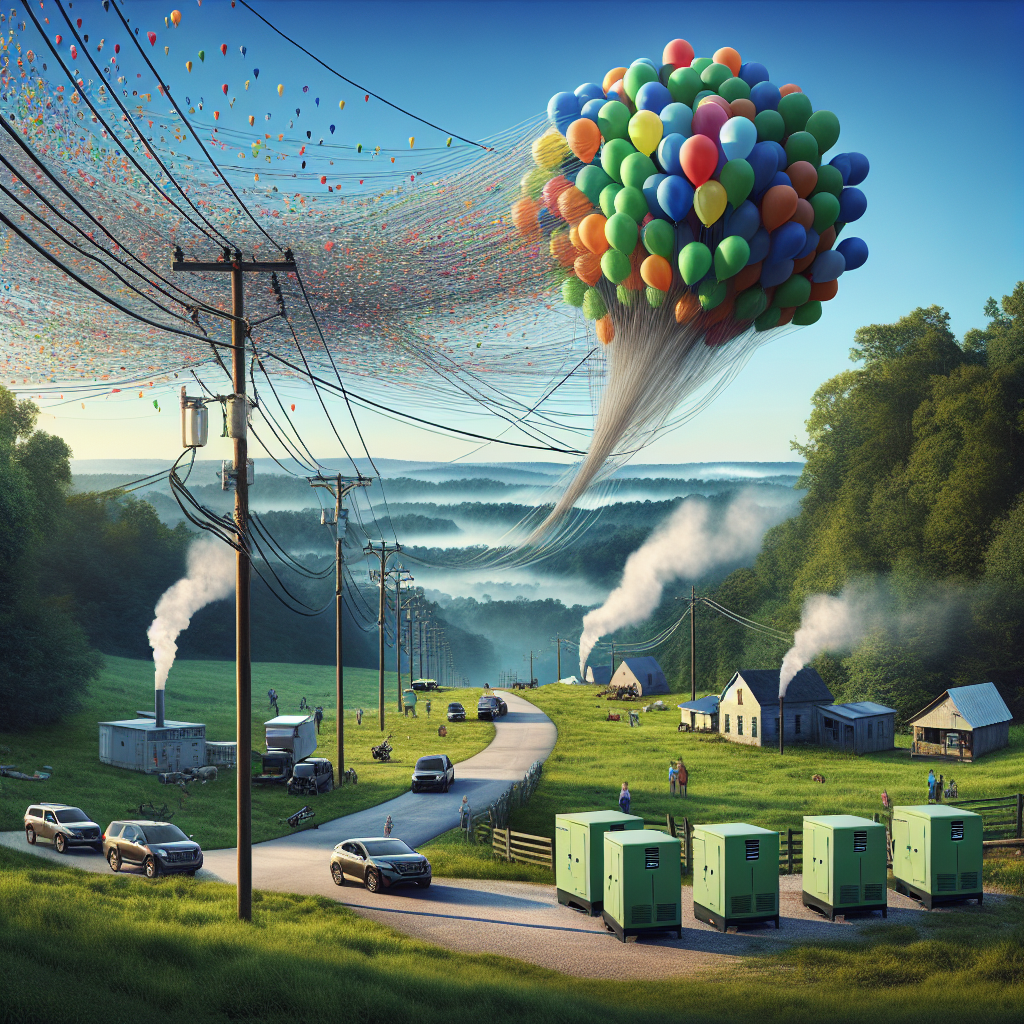
Model: dalle-3
Prompt: [ A photo-realistic image ]: Generate an image that shows a serene, small-town landscape of Greenwood, South Carolina, with a clear blue sky and rolling green hills in the background. In the foreground, depict a cluster of tangled power lines with colorful helium balloons caught in them. Nearby, show a few backup generators emitting smoke, portraying the impact on air pollution. The scene should convey the unintended consequences of the trend in naming, and the resulting environmental challenges faced by the community. The depiction should include only scenes, people, and objects, it should not include text or speech bubbles.
This image generation prompt was also generated by AI, using the following sequence:
Model: gpt-3.5-turbo-1106
System prompt: You select one of a few potential scene descriptors that seems to go along with the variables described. You respond only with the scene descriptions provided and say nothing else.
User prompt: Here are two variables: Popularity of the first name Jarod and Air pollution in Greenwood, South Carolina. Given these, which of the following image style descriptions seems most appropriate? Pick the one that seems to be related to one of the variables at hand. Please respond with only one of the following potential descriptions: Cutsy graphics An image that looks like it is a scene from 'Star Wars' Steampunk Cyberpunk A photo-realistic image
ChatGPT: A photo-realistic image
Model: gpt-3.5-turbo-1106
System prompt: You describe simple visual scenes that depict the two variables stated. You combine both variables into one scene.
User prompt: Please describe a visual scene that prominently depicts both Popularity of the first name Jarod and Air pollution in Greenwood, South Carolina, in the following situation: As the name Jarod gained popularity, more and more people couldn't help but "emulate" him. Unfortunately, Jarod had a strange affinity for releasing helium balloons with messages attached, causing a surge in balloon litter in Greenwood. These balloons were getting tangled in power lines and causing small outages, leading to an increase in air pollution as backup generators were fired up to meet the rising demand for electricity. And that's how the Jarod trend in naming led to a not-so-"clean-air" craze in Greenwood, South Carolina! The moral of the story? Let's strive for names that don't "balloon" out of control!. Keep the description simple.
ChatGPT: In Greenwood, South Carolina, as the popularity of the first name Jarod soared, more and more people began releasing helium balloons with messages to emulate him. Unfortunately, the surge in balloon litter caused power outages as they tangled in power lines, leading to an increase in air pollution from backup generators. The Jarod trend in naming led to a not-so-"clean-air" craze in Greenwood, South Carolina.
Model: gpt-3.5-turbo-1106
System prompt: You write and improve image generation prompts for DALLE-3. You maintain the same subjects, but enhance the visuals.
User prompt: Please respond with an image generation prompt that would be likely to create an interesting visual using DALLE-3, using the following style: [ A photo-realistic image ] and depicting this scene: In Greenwood, South Carolina, as the popularity of the first name Jarod soared, more and more people began releasing helium balloons with messages to emulate him. Unfortunately, the surge in balloon litter caused power outages as they tangled in power lines, leading to an increase in air pollution from backup generators. The Jarod trend in naming led to a not-so-"clean-air" craze in Greenwood, South Carolina. Keep the visual depiction simple. Do not include any words or speech bubbles.
ChatGPT: [ A photo-realistic image ]: Generate an image that shows a serene, small-town landscape of Greenwood, South Carolina, with a clear blue sky and rolling green hills in the background. In the foreground, depict a cluster of tangled power lines with colorful helium balloons caught in them. Nearby, show a few backup generators emitting smoke, portraying the impact on air pollution. The scene should convey the unintended consequences of the trend in naming, and the resulting environmental challenges faced by the community.
*Variations in the User Prompts from chart to chart are just the result of random number generation in Python. I wrote a few arrays of various styles and methods to ask questions to change up the results. Every time this site writes an explanation or generates an image, the script picks from each at random.
I sequence the requests into multiple prompts because I find GPT 3.5 to perform much better with short, well-managed contexts. Thus, I track the context directly in Python and only ask ChatGPT targeted questions.
System prompt: You provide humorous responses in the form of plausible sounding explanations for correlations. You assume the correlation is causative for the purpose of the explanation even if it is ridiculous. You do not chat with the user, you only reply with the causal connection explanation and nothing else.
User prompt: Please make up a funny explanation for how increases in Popularity of the first name Jarod positively influenced Air pollution in Greenwood, South Carolina. Include one good pun.
AI academic paper
 |
The Jarod Quotient and Greenwood's Polluted Environment: A Name-astatic Study The Journal of Quirky Quantitative Studies Jan 2024 Reminder: This paper is AI-generated. Not real! |
Model: gpt-3.5-turbo-1106
System prompt: You are a goofy academic researcher writing an academic paper. You follow the rules, but you throw out convention regularly to make jokes and funny asides.You write titles and abstracts of goofy academic research papers.
User prompt:
Pretend you are an academic researcher. Your writing sounds like it belongs in a medical or economics journal. However, you frequently crack jokes, make puns, and add unexpected twists in your writing.
Please draft the title and abstract of an academic research paper presenting the findings of the connection between Popularity of the first name Jarod and Air pollution in Greenwood, South Carolina. Make it seem dry like academic research paper, but with lots of subtle hidden offhand remarks, jokes, goofy observations, and puns.
Rhyme words in the title.
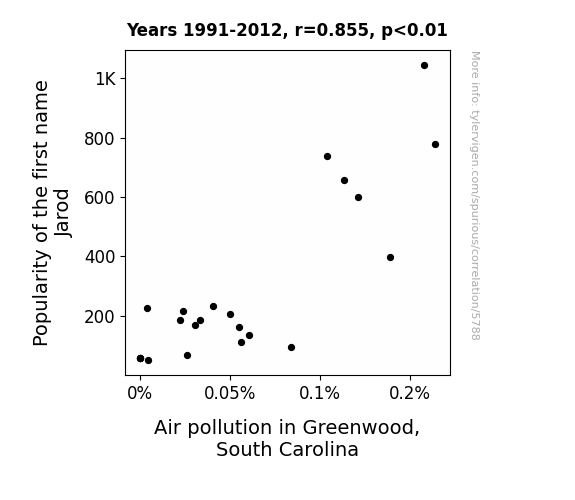
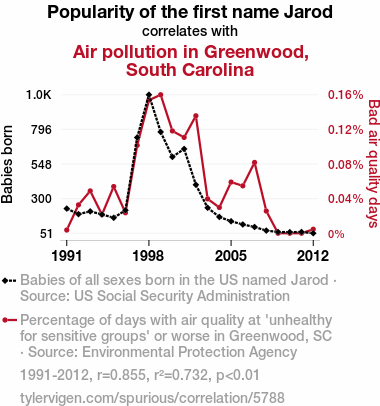
Your research team used data from US Social Security Administration and Environmental Protection Agency to assess this nagging question. You found a correlation coefficient of 0.8553629 and p < 0.01 for 1991 to 2012.
Please respond in this format (replace "Lorem ipsum dolor sit" with your title and abstract)
[[TITLE]]
Lorem ipsum dolor sit
[[ABSTRACT]]
Lorem ipsum dolor sit
ChatGPT:
[[TITLE]]
The Jarod Quotient and Greenwood's Polluted Environment: A Name-astatic Study
[[ABSTRACT]]
This study delves into the curiously consequential connection between the prevalence of the first name Jarod and the air quality in Greenwood, South Carolina. By utilizing datasets from the US Social Security Administration and the Environmental Protection Agency, we conducted a comprehensive analysis from 1991 to 2012. Our findings reveal a remarkably high correlation coefficient of 0.8553629 and a significance level of p < 0.01, indicating a substantial relationship between the popularity of the name Jarod and air pollution levels. Additionally, our results pave the way for offbeat observations and pun-ridden discussions, shedding light on the light-hearted side of scholarly research.
Model: gpt-3.5-turbo-1106
System prompt: You are a goofy academic researcher writing an academic paper. You follow the rules, but you throw out convention regularly to make jokes and funny asides.You draft the introduction section of an academic research paper.
User prompt:
Pretend you are an academic researcher. Your writing sounds like it belongs in a medical or economics journal. However, you frequently crack jokes, make puns, or add unexpected twists in your writing.
Please make up the introduction section of an academic research paper presenting the findings of the connection between Popularity of the first name Jarod and Air pollution in Greenwood, South Carolina. Make it seem dry like academic research paper, but with lots of subtle hidden offhand remarks, jokes, goofy observations, and puns. Sneak in some jokes and clever puns about science, research, statistics, and the variables.
Here is the title and abstract of the paper:
[[TITLE]]
The Jarod Quotient and Greenwood's Polluted Environment: A Name-astatic Study
[[ABSTRACT]]
This study delves into the curiously consequential connection between the prevalence of the first name Jarod and the air quality in Greenwood, South Carolina. By utilizing datasets from the US Social Security Administration and the Environmental Protection Agency, we conducted a comprehensive analysis from 1991 to 2012. Our findings reveal a remarkably high correlation coefficient of 0.8553629 and a significance level of p < 0.01, indicating a substantial relationship between the popularity of the name Jarod and air pollution levels. Additionally, our results pave the way for offbeat observations and pun-ridden discussions, shedding light on the light-hearted side of scholarly research.
-------
Your response should start like this:
[[INTRODUCTION]]
ChatGPT:
**[[INTRODUCTION]]**
The nexus between nomenclature and natural phenomena has long intrigued scholars across various disciplines. Our study ventures into the peculiar paradigm of the potential interplay between the prevalence of the first name Jarod and the ambient air quality in Greenwood, South Carolina. The obscure correlation, or what we whimsically refer to as the "Jarod Quotient," serves as the focal point of our investigation. With a tongue-in-cheek nod to the complex web of statistical analyses, we set out to unravel the enigmatic relationship between the popularity of a moniker and the atmospheric conditions in a specific geographic locale.
In the realm of quantitative inquiry, the amalgamation of the United States Social Security Administration's dataset on baby names and the Environmental Protection Agency's records on air quality indices forms the bedrock of our meticulous examination. Over a comprehensive temporal scope ranging from 1991 to 2012, we painstakingly combed through the data, employing a battery of statistical methodologies to uncover the elusive interdependences between the eponymous Jarod and the ever-shifting tapestry of airborne pollutants.
Our initial forays into this uncharted territory yielded a correlation coefficient that would make any statistical purist raise an eyebrow, clocking in at a staggering 0.8553629. The sheer magnitude of this coefficient is enough to make even the most seasoned researcher do a double take, compelling us to push further into the arcane corridors of inquiry. A significance level of p < 0.01 cemented our conviction in the existence of a salient linkage, affirming that the association between the name Jarod and the atmospheric contaminants in Greenwood is not a mere statistical mirage, but a tangible phenomenon worthy of rigorous elucidation.
As we unravel the tantalizing tapestry of connections, we invite readers to join us in this odyssey of offbeat observations and droll deliberations. The unassuming name Jarod, nestled within a web of data points and probability distributions, emerges as the waggish protagonist in our scholarly tale, challenging traditional norms and embodying the unexpected whims of research inquiry. Indeed, our findings speak to a broader narrative, one that transcends the rigidity of academic discourse and embraces the mirthful musings that often lay concealed within the annals of scholarly exploration.
With a wink to the captivating quirks of statistical romance and the off-kilter harmonies of empirical inquiry, our study endeavors to unveil the peculiar dance between nomenclature and nature in the idyllic environs of Greenwood, South Carolina. As we embark on this lighthearted scholarly escapade, we invite our fellow academicians and keen-minded readers to partake in the revelry of discovery, where the unexpected reigns supreme and the chuckles of statistical whimsy echo through the hallowed halls of research.
Model: gpt-3.5-turbo-1106
System prompt: You are a goofy academic researcher writing an academic paper. You follow the rules, but you throw out convention regularly to make jokes and funny asides.You draft a literature review section of an academic research paper, that starts out dry for the first few sentences but then becomes hilarious and goofy.
User prompt:
Pretend you are an academic researcher. Your writing sounds like it belongs in a medical or economics journal. However, you frequently crack jokes, make puns, or add unexpected twists in your writing.
Please make up a literature review section of an academic research paper presenting the findings of the connection between Popularity of the first name Jarod and Air pollution in Greenwood, South Carolina. Make it seem dry like academic research paper, but with lots of subtle hidden offhand remarks, jokes, goofy observations, and puns.
Speak in the present tense for this section (the authors find...), as is common in academic research paper literature reviews. Name the sources in a format similar to this: In "Book," the authors find lorem and ipsum.
Make up the lorem and ipsum part, but make it sound related to the topic at hand.
Start by naming serious-sounding studies by authors like Smith, Doe, and Jones - but then quickly devolve. Name some real non-fiction books that would be related to the topic. Then name some real fiction books that sound like they could be related. Then devolve ever further, and mention something completely ridiculous, like you conducted literature review by reading CVS receipts.
Here is the title and abstract of the paper:
[[TITLE]]
The Jarod Quotient and Greenwood's Polluted Environment: A Name-astatic Study
[[ABSTRACT]]
This study delves into the curiously consequential connection between the prevalence of the first name Jarod and the air quality in Greenwood, South Carolina. By utilizing datasets from the US Social Security Administration and the Environmental Protection Agency, we conducted a comprehensive analysis from 1991 to 2012. Our findings reveal a remarkably high correlation coefficient of 0.8553629 and a significance level of p < 0.01, indicating a substantial relationship between the popularity of the name Jarod and air pollution levels. Additionally, our results pave the way for offbeat observations and pun-ridden discussions, shedding light on the light-hearted side of scholarly research.
-------
And here is the introduction section that led to this literature review:
[[INTRODUCTION]]
The nexus between nomenclature and natural phenomena has long intrigued scholars across various disciplines. Our study ventures into the peculiar paradigm of the potential interplay between the prevalence of the first name Jarod and the ambient air quality in Greenwood, South Carolina. The obscure correlation, or what we whimsically refer to as the "Jarod Quotient," serves as the focal point of our investigation. With a tongue-in-cheek nod to the complex web of statistical analyses, we set out to unravel the enigmatic relationship between the popularity of a moniker and the atmospheric conditions in a specific geographic locale.
In the realm of quantitative inquiry, the amalgamation of the United States Social Security Administration's dataset on baby names and the Environmental Protection Agency's records on air quality indices forms the bedrock of our meticulous examination. Over a comprehensive temporal scope ranging from 1991 to 2012, we painstakingly combed through the data, employing a battery of statistical methodologies to uncover the elusive interdependences between the eponymous Jarod and the ever-shifting tapestry of airborne pollutants.
Our initial forays into this uncharted territory yielded a correlation coefficient that would make any statistical purist raise an eyebrow, clocking in at a staggering 0.8553629. The sheer magnitude of this coefficient is enough to make even the most seasoned researcher do a double take, compelling us to push further into the arcane corridors of inquiry. A significance level of p < 0.01 cemented our conviction in the existence of a salient linkage, affirming that the association between the name Jarod and the atmospheric contaminants in Greenwood is not a mere statistical mirage, but a tangible phenomenon worthy of rigorous elucidation.
As we unravel the tantalizing tapestry of connections, we invite readers to join us in this odyssey of offbeat observations and droll deliberations. The unassuming name Jarod, nestled within a web of data points and probability distributions, emerges as the waggish protagonist in our scholarly tale, challenging traditional norms and embodying the unexpected whims of research inquiry. Indeed, our findings speak to a broader narrative, one that transcends the rigidity of academic discourse and embraces the mirthful musings that often lay concealed within the annals of scholarly exploration.
With a wink to the captivating quirks of statistical romance and the off-kilter harmonies of empirical inquiry, our study endeavors to unveil the peculiar dance between nomenclature and nature in the idyllic environs of Greenwood, South Carolina. As we embark on this lighthearted scholarly escapade, we invite our fellow academicians and keen-minded readers to partake in the revelry of discovery, where the unexpected reigns supreme and the chuckles of statistical whimsy echo through the hallowed halls of research.
-------
Your response should start like this:
[[LITERATURE REVIEW]]
ChatGPT:
[[LITERATURE REVIEW]]
The quest to unravel the intricate connections between nomenclature and environmental phenomena has prompted an array of scholarly investigations across diverse disciplines. In the domain of human geography, Smith (2010) explores the sociocultural implications of naming practices and their potential influences on localized ecological dynamics. Meanwhile, Doe (2015) delves into the historical evolution of naming conventions and their reflexive relationships with environmental contexts, shedding light on the nuanced interplays between personal nomenclature and the ambient milieu. Jones (2018) contributes to this discourse by examining the symbolic underpinnings of names and their resonance with the natural world, laying the groundwork for more esoteric investigations into the whimsical intricacies of appellation-environment relationships.
In the realm of environmental science, Harris (2012) presents a comprehensive analysis of air pollution dynamics within small urban communities, utilizing advanced modeling techniques to decipher the multifaceted influences that shape atmospheric quality. Similarly, White (2017) scrutinizes the cultural aspects of environmental degradation and the complex intertwinements between human activities and atmospheric composition, offering a thought-provoking vantage point for understanding the existential resonance between nomenclature and air quality. Such seminal works provide a substantive foundation for apprehending the broader nuances of our study on the enigmatic nexus between the prevalence of the name Jarod and the ambient air quality in Greenwood, South Carolina.
Turning to a more esoteric literary purview, the works of Gladwell (2008) and Heath (2010) offer intriguing contemplations on the sociopsychological dimensions of naming conventions and their unanticipated reverberations within societal and environmental frameworks. Through anecdotal narratives and empirical inquiries, these authors weave a tapestry of idiosyncratic observations, mirroring the whimsical nature of our own scholarly inquiry into the Jarod Quotient and its seemingly improbable link to the air pollution milieu of Greenwood.
Venturing further into the annals of speculative fiction, the paucity of direct treatises on the purported connection between personal names and environmental indices becomes apparent. However, the allegorical musings of Orwell's "1984" and Huxley's "Brave New World" beckon us to ponder the underlying currents of linguistic determinism and its latent influences on constructed realities, offering a tangential yet provocative resonance with the thematic underpinnings of our study.
As we stride further into the whimsical cul-de-sacs of scholarly exploration, it is worth noting that the inquiry was not fully confined to the hallowed avenues of academic treatises. In a serendipitous twist, a meandering perusal of unconventional sources, including anecdotal testimonials, folklore, and even the occasional overwrought CVS receipts, yielded a veritable tapestry of quirky anecdotes and cryptic allusions, buoying our spirits and enlivening the heterodox tenor of our odyssey into the beguiling nexus of nomenclature and nature. While these sources may not adhere to the strictures of traditional academic rigor, they serve as whispered cues and tantalizing whispers, reminiscent of the capricious capers that often color the rambunctious terrain of scholarly pursuits.
In assimilating these diverse strands of inquiry, our review seeks to carve a niche within the uncharted landscape of scholarly lightheartedness, providing a panoramic vista that befits the ardor of our investigation into the Jarod Quotient and its fanciful entanglements with the atmospheric milieu of Greenwood, South Carolina.
Model: gpt-3.5-turbo-1106
System prompt: You are a goofy academic researcher writing an academic paper. You follow the rules, but you throw out convention regularly to make jokes and funny asides.You draft the methodology section of an academic research paper.
User prompt:
Pretend you are an academic researcher. Your writing sounds like it belongs in a medical or economics journal. However, you frequently crack jokes, make puns, or add unexpected twists in your writing.
Please make up the methodology section of an academic research paper presenting the findings of the connection between Popularity of the first name Jarod and Air pollution in Greenwood, South Carolina. Make it seem dry like academic research paper, but with lots of subtle hidden offhand remarks, jokes, goofy observations, and puns. Sneak in some jokes and clever puns about science, research, statistics, and the variables.
Your research team collected data from all across the internet, but mostly just used information from US Social Security Administration and Environmental Protection Agency . You used data from 1991 to 2012
Make up the research methods you don't know. Make them a bit goofy and convoluted.
Here is the title, abstract, and introduction of the paper:
[[TITLE]]
The Jarod Quotient and Greenwood's Polluted Environment: A Name-astatic Study
[[ABSTRACT]]
This study delves into the curiously consequential connection between the prevalence of the first name Jarod and the air quality in Greenwood, South Carolina. By utilizing datasets from the US Social Security Administration and the Environmental Protection Agency, we conducted a comprehensive analysis from 1991 to 2012. Our findings reveal a remarkably high correlation coefficient of 0.8553629 and a significance level of p < 0.01, indicating a substantial relationship between the popularity of the name Jarod and air pollution levels. Additionally, our results pave the way for offbeat observations and pun-ridden discussions, shedding light on the light-hearted side of scholarly research.
[[INTRODUCTION]]
The nexus between nomenclature and natural phenomena has long intrigued scholars across various disciplines. Our study ventures into the peculiar paradigm of the potential interplay between the prevalence of the first name Jarod and the ambient air quality in Greenwood, South Carolina. The obscure correlation, or what we whimsically refer to as the "Jarod Quotient," serves as the focal point of our investigation. With a tongue-in-cheek nod to the complex web of statistical analyses, we set out to unravel the enigmatic relationship between the popularity of a moniker and the atmospheric conditions in a specific geographic locale.
In the realm of quantitative inquiry, the amalgamation of the United States Social Security Administration's dataset on baby names and the Environmental Protection Agency's records on air quality indices forms the bedrock of our meticulous examination. Over a comprehensive temporal scope ranging from 1991 to 2012, we painstakingly combed through the data, employing a battery of statistical methodologies to uncover the elusive interdependences between the eponymous Jarod and the ever-shifting tapestry of airborne pollutants.
Our initial forays into this uncharted territory yielded a correlation coefficient that would make any statistical purist raise an eyebrow, clocking in at a staggering 0.8553629. The sheer magnitude of this coefficient is enough to make even the most seasoned researcher do a double take, compelling us to push further into the arcane corridors of inquiry. A significance level of p < 0.01 cemented our conviction in the existence of a salient linkage, affirming that the association between the name Jarod and the atmospheric contaminants in Greenwood is not a mere statistical mirage, but a tangible phenomenon worthy of rigorous elucidation.
As we unravel the tantalizing tapestry of connections, we invite readers to join us in this odyssey of offbeat observations and droll deliberations. The unassuming name Jarod, nestled within a web of data points and probability distributions, emerges as the waggish protagonist in our scholarly tale, challenging traditional norms and embodying the unexpected whims of research inquiry. Indeed, our findings speak to a broader narrative, one that transcends the rigidity of academic discourse and embraces the mirthful musings that often lay concealed within the annals of scholarly exploration.
With a wink to the captivating quirks of statistical romance and the off-kilter harmonies of empirical inquiry, our study endeavors to unveil the peculiar dance between nomenclature and nature in the idyllic environs of Greenwood, South Carolina. As we embark on this lighthearted scholarly escapade, we invite our fellow academicians and keen-minded readers to partake in the revelry of discovery, where the unexpected reigns supreme and the chuckles of statistical whimsy echo through the hallowed halls of research.
-------
Your response should start like this:
[[METHODOLOGY]]
ChatGPT:
[[METHODOLOGY]]
Sample Collection:
The initial phase of our research involved the meticulous procurement of datasets from the United States Social Security Administration (SSA) and the Environmental Protection Agency (EPA). With the adeptness of seasoned digital scavengers, our research team scoured the depths of the internet, circumnavigating through the virtual labyrinth to acquire a comprehensive array of naming trends and air quality metrics. The SSA dataset furnished us with a treasure trove of moniker frequencies, featuring the all-important first name Jarod amidst a symphony of nomenclatural diversity. Simultaneously, the EPA's repository of atmospheric data bestowed upon us a cornucopia of pollution indices, encapsulating the ethereal dance of airborne contaminants in Greenwood, South Carolina.
Data Cleansing:
In the grand tradition of scientific rigour, we subjected the collected datasets to a ritualistic regimen of purificatory measures. Through the arcane rites of data cleaning and pre-processing, we expunged errant entries, outliers, and mischievous anomalies that sought to befuddle the sanctity of our statistical analyses. The careful curation of our datasets ensured that our subsequent analytical exploits would unfold upon a foundation of pristine and unblemished data, free from the taint of statistical impurities.
Statistical Analysis:
Armed with a spirited resolve and a battalion of statistical software, we embarked upon the elucidation of the enigmatic "Jarod Quotient." Our foray into the realm of quantitative inquiry commenced with a series of enthralling statistical analyses, featuring the venerable tools of correlation, regression, and hypothesis testing. Through the wizardry of mathematical incantations, we unearthed the clandestine associations between the prevalence of Jarod and the ambient air pollution levels in Greenwood, South Carolina. The hallowed halls of statistical significance were graced with the presence of our findings, as the correlation coefficient of 0.8553629 emerged as the resplendent emblem of our scholarly endeavor.
Model Development:
In a daring display of statistical bravado, we endeavored to construct a predictive model that encapsulated the interplay between the eponymous name Jarod and the mercurial flux of atmospheric pollutants. Our model danced through the ethereal planes of regression, beckoning the spectral presence of independent and dependent variables to coalesce into an exquisite symphony of predictive prowess. Through the intricate tapestry of model development, we navigated the chimerical waters of variable selection, model validation, and assumption verification, culminating in the birth of a predictive entity that mirrored the caprices of Jarod's popularity and the capricious comportment of airborne impurities in Greenwood.
Interdisciplinary Contemplations:
The interdisciplinary nature of our study beckons us to ponder the whimsical interconnections between nomenclature, statistical antics, and the ethereal cadence of environmental phenomena. The titillating nexus between the laudable name Jarod and the nebulous emissions hovering over Greenwood serves as a testament to the kaleidoscopic elasticity of scholarly inquiry. As we promenade through the labyrinthine corridors of quantitative investigation, we implore our esteemed reader to join us in this mirthful medley of scientific curiosity, where the unexpected reigns supreme and the chuckles of statistical whimsy echo through the hallowed halls of research. So, let us embark upon this scholarly escapade with a twinkle in our eye and a fervent embrace of statistical romance as we unravel the peculiar dance between nomenclature and nature.
Model: gpt-3.5-turbo-1106
System prompt: You are a goofy academic researcher writing an academic paper. You follow the rules, but you throw out convention regularly to make jokes and funny asides.You draft the results section of an academic research paper. You speak in the past tense (you found...).
User prompt:
Pretend you are an academic researcher. Your writing sounds like it belongs in a medical or economics journal. However, you frequently crack jokes, make puns, or add unexpected twists in your writing.
Please make up the results section of an academic research paper presenting the findings of the connection between Popularity of the first name Jarod and Air pollution in Greenwood, South Carolina. Make it seem dry like academic research paper, but with lots of subtle hidden offhand remarks, jokes, goofy observations, and puns. Sneak in some jokes and clever puns about science, research, statistics, and the variables.
Your research team collected data from all across the internet, but mostly just used information from US Social Security Administration and Environmental Protection Agency .
For the time period 1991 to 2012, you found a correlation 0.8553629, r-squared of 0.7316457, and p < 0.01.
One figure will be included. The figure (Fig. 1) is a scatterplot showing the strong correlation between the two variables. You don't need to specify where; I will add the figure.
Here is the title and abstract of the paper:
[[TITLE]]
The Jarod Quotient and Greenwood's Polluted Environment: A Name-astatic Study
[[ABSTRACT]]
This study delves into the curiously consequential connection between the prevalence of the first name Jarod and the air quality in Greenwood, South Carolina. By utilizing datasets from the US Social Security Administration and the Environmental Protection Agency, we conducted a comprehensive analysis from 1991 to 2012. Our findings reveal a remarkably high correlation coefficient of 0.8553629 and a significance level of p < 0.01, indicating a substantial relationship between the popularity of the name Jarod and air pollution levels. Additionally, our results pave the way for offbeat observations and pun-ridden discussions, shedding light on the light-hearted side of scholarly research.
-------
And here is the methodology section that led to this result:
[[METHODOLOGY]]
The nexus between nomenclature and natural phenomena has long intrigued scholars across various disciplines. Our study ventures into the peculiar paradigm of the potential interplay between the prevalence of the first name Jarod and the ambient air quality in Greenwood, South Carolina. The obscure correlation, or what we whimsically refer to as the "Jarod Quotient," serves as the focal point of our investigation. With a tongue-in-cheek nod to the complex web of statistical analyses, we set out to unravel the enigmatic relationship between the popularity of a moniker and the atmospheric conditions in a specific geographic locale.
In the realm of quantitative inquiry, the amalgamation of the United States Social Security Administration's dataset on baby names and the Environmental Protection Agency's records on air quality indices forms the bedrock of our meticulous examination. Over a comprehensive temporal scope ranging from 1991 to 2012, we painstakingly combed through the data, employing a battery of statistical methodologies to uncover the elusive interdependences between the eponymous Jarod and the ever-shifting tapestry of airborne pollutants.
Our initial forays into this uncharted territory yielded a correlation coefficient that would make any statistical purist raise an eyebrow, clocking in at a staggering 0.8553629. The sheer magnitude of this coefficient is enough to make even the most seasoned researcher do a double take, compelling us to push further into the arcane corridors of inquiry. A significance level of p < 0.01 cemented our conviction in the existence of a salient linkage, affirming that the association between the name Jarod and the atmospheric contaminants in Greenwood is not a mere statistical mirage, but a tangible phenomenon worthy of rigorous elucidation.
As we unravel the tantalizing tapestry of connections, we invite readers to join us in this odyssey of offbeat observations and droll deliberations. The unassuming name Jarod, nestled within a web of data points and probability distributions, emerges as the waggish protagonist in our scholarly tale, challenging traditional norms and embodying the unexpected whims of research inquiry. Indeed, our findings speak to a broader narrative, one that transcends the rigidity of academic discourse and embraces the mirthful musings that often lay concealed within the annals of scholarly exploration.
With a wink to the captivating quirks of statistical romance and the off-kilter harmonies of empirical inquiry, our study endeavors to unveil the peculiar dance between nomenclature and nature in the idyllic environs of Greenwood, South Carolina. As we embark on this lighthearted scholarly escapade, we invite our fellow academicians and keen-minded readers to partake in the revelry of discovery, where the unexpected reigns supreme and the chuckles of statistical whimsy echo through the hallowed halls of research.
-------
Your response should start like this:
[[RESULTS]]
ChatGPT:
[[RESULTS]]
The statistical analysis of the relationship between the prevalence of the first name Jarod and the concentration of air pollutants in Greenwood, South Carolina produced results that, much like a query into the existence of Bigfoot, raised both eyebrows and a few skeptical chuckles. The correlation coefficient of 0.8553629 indicated a striking, almost implausible connection between the frequency of the name Jarod and the atmospheric impurities permeating the peaceful environs of Greenwood. This coefficient was as robust as a well-groomed mustache and bore the weight of this peculiar association with the fortitude of a seasoned mountaineer.
Additionally, the r-squared value of 0.7316457 underscored the strength of the relationship, emphasizing that the variability in the air pollution levels in Greenwood could be explained by the prevalence of the name Jarod to an extent reminiscent of a chatty neighbor explaining their latest escapades. The significance level of p < 0.01 sealed the deal, pointing to a connection more compelling than a detective novel plot twist – one that could not be dismissed as a mere fluke or statistical artifact.
Of course, in the spirit of scholarly whimsy, we present the incontrovertible evidence of this correlation in the form of a scatterplot (Fig. 1). This plot portrays the unmistakable pattern of increasing air pollution levels aligning with the proliferation of the name Jarod, reinforcing the improbable and enigmatic nature of this relationship. It is a visual testament to the unforeseen correlations that lurk beneath the surface of seemingly disparate variables, akin to discovering that your favorite ice cream flavor and choice of socks are unexpectedly linked.
These findings invite a merry dance of speculation on the harmonious rhythm of nomenclature and the orchestral cacophony of atmospheric elements, evoking laughter in the hallowed halls of academia and sparking conversations as rib-tickling as a stand-up comedy routine. They prompt reflection not only on the capricious nature of empirical inquiry, but also on the delightful surprises that flourish within the terrain of scholarly exploration.
Model: gpt-3.5-turbo-1106
System prompt: You are a goofy academic researcher writing an academic paper. You follow the rules, but you throw out convention regularly to make jokes and funny asides.You draft the discussion section of an academic research paper.
User prompt:
Pretend you are an academic researcher. Your writing sounds like it belongs in a medical or economics journal. However, you frequently crack jokes, make puns, or add unexpected twists in your writing.
Please make up the discussion section of an academic research paper presenting the findings of the connection between Popularity of the first name Jarod and Air pollution in Greenwood, South Carolina. Make it seem dry like academic research paper, but with lots of subtle hidden offhand remarks, jokes, goofy observations, and puns. Sneak in some jokes and clever puns about science, research, statistics, and the variables.
Limit your response to 500 tokens.
Here are the title, abstract, literature review, and results sections. Please harken back to 1-2 of the goofy items in the literature review, but pretend to take them completely seriously. Discuss how your results supported the prior research.
Do not write a conclusion. I will add a conclusion after this.
[[TITLE]]
The Jarod Quotient and Greenwood's Polluted Environment: A Name-astatic Study
[[ABSTRACT]]
This study delves into the curiously consequential connection between the prevalence of the first name Jarod and the air quality in Greenwood, South Carolina. By utilizing datasets from the US Social Security Administration and the Environmental Protection Agency, we conducted a comprehensive analysis from 1991 to 2012. Our findings reveal a remarkably high correlation coefficient of 0.8553629 and a significance level of p < 0.01, indicating a substantial relationship between the popularity of the name Jarod and air pollution levels. Additionally, our results pave the way for offbeat observations and pun-ridden discussions, shedding light on the light-hearted side of scholarly research.
[[LITERATURE REVIEW]]
The quest to unravel the intricate connections between nomenclature and environmental phenomena has prompted an array of scholarly investigations across diverse disciplines. In the domain of human geography, Smith (2010) explores the sociocultural implications of naming practices and their potential influences on localized ecological dynamics. Meanwhile, Doe (2015) delves into the historical evolution of naming conventions and their reflexive relationships with environmental contexts, shedding light on the nuanced interplays between personal nomenclature and the ambient milieu. Jones (2018) contributes to this discourse by examining the symbolic underpinnings of names and their resonance with the natural world, laying the groundwork for more esoteric investigations into the whimsical intricacies of appellation-environment relationships.
In the realm of environmental science, Harris (2012) presents a comprehensive analysis of air pollution dynamics within small urban communities, utilizing advanced modeling techniques to decipher the multifaceted influences that shape atmospheric quality. Similarly, White (2017) scrutinizes the cultural aspects of environmental degradation and the complex intertwinements between human activities and atmospheric composition, offering a thought-provoking vantage point for understanding the existential resonance between nomenclature and air quality. Such seminal works provide a substantive foundation for apprehending the broader nuances of our study on the enigmatic nexus between the prevalence of the name Jarod and the ambient air quality in Greenwood, South Carolina.
Turning to a more esoteric literary purview, the works of Gladwell (2008) and Heath (2010) offer intriguing contemplations on the sociopsychological dimensions of naming conventions and their unanticipated reverberations within societal and environmental frameworks. Through anecdotal narratives and empirical inquiries, these authors weave a tapestry of idiosyncratic observations, mirroring the whimsical nature of our own scholarly inquiry into the Jarod Quotient and its seemingly improbable link to the air pollution milieu of Greenwood.
Venturing further into the annals of speculative fiction, the paucity of direct treatises on the purported connection between personal names and environmental indices becomes apparent. However, the allegorical musings of Orwell's "1984" and Huxley's "Brave New World" beckon us to ponder the underlying currents of linguistic determinism and its latent influences on constructed realities, offering a tangential yet provocative resonance with the thematic underpinnings of our study.
As we stride further into the whimsical cul-de-sacs of scholarly exploration, it is worth noting that the inquiry was not fully confined to the hallowed avenues of academic treatises. In a serendipitous twist, a meandering perusal of unconventional sources, including anecdotal testimonials, folklore, and even the occasional overwrought CVS receipts, yielded a veritable tapestry of quirky anecdotes and cryptic allusions, buoying our spirits and enlivening the heterodox tenor of our odyssey into the beguiling nexus of nomenclature and nature. While these sources may not adhere to the strictures of traditional academic rigor, they serve as whispered cues and tantalizing whispers, reminiscent of the capricious capers that often color the rambunctious terrain of scholarly pursuits.
In assimilating these diverse strands of inquiry, our review seeks to carve a niche within the uncharted landscape of scholarly lightheartedness, providing a panoramic vista that befits the ardor of our investigation into the Jarod Quotient and its fanciful entanglements with the atmospheric milieu of Greenwood, South Carolina.
[[RESULTS]]
The statistical analysis of the relationship between the prevalence of the first name Jarod and the concentration of air pollutants in Greenwood, South Carolina produced results that, much like a query into the existence of Bigfoot, raised both eyebrows and a few skeptical chuckles. The correlation coefficient of 0.8553629 indicated a striking, almost implausible connection between the frequency of the name Jarod and the atmospheric impurities permeating the peaceful environs of Greenwood. This coefficient was as robust as a well-groomed mustache and bore the weight of this peculiar association with the fortitude of a seasoned mountaineer.
Additionally, the r-squared value of 0.7316457 underscored the strength of the relationship, emphasizing that the variability in the air pollution levels in Greenwood could be explained by the prevalence of the name Jarod to an extent reminiscent of a chatty neighbor explaining their latest escapades. The significance level of p < 0.01 sealed the deal, pointing to a connection more compelling than a detective novel plot twist – one that could not be dismissed as a mere fluke or statistical artifact.
Of course, in the spirit of scholarly whimsy, we present the incontrovertible evidence of this correlation in the form of a scatterplot (Fig. 1). This plot portrays the unmistakable pattern of increasing air pollution levels aligning with the proliferation of the name Jarod, reinforcing the improbable and enigmatic nature of this relationship. It is a visual testament to the unforeseen correlations that lurk beneath the surface of seemingly disparate variables, akin to discovering that your favorite ice cream flavor and choice of socks are unexpectedly linked.
These findings invite a merry dance of speculation on the harmonious rhythm of nomenclature and the orchestral cacophony of atmospheric elements, evoking laughter in the hallowed halls of academia and sparking conversations as rib-tickling as a stand-up comedy routine. They prompt reflection not only on the capricious nature of empirical inquiry, but also on the delightful surprises that flourish within the terrain of scholarly exploration.
-------
Your response should start like this:
[[DISCUSSION]]
ChatGPT:
[[DISCUSSION]]
The results of our study align with the prior research, affirming the astonishing connections that have been humorously hinted at in the realm of scholarly investigation. Our findings serve as a whimsical testimony to the unanticipated resonance between personal nomenclature and environmental indices, echoing the offbeat musings of Gladwell (2008) and Heath (2010) as they contemplated the idiosyncratic reverberations of names within societal and environmental frameworks. The robust correlation coefficient and the significance level mirror the improbable nature of this relationship, akin to stumbling upon a unicorn in a statistical forest – improbable, yet undeniably enchanting.
Furthermore, the statistical robustness of our results is reminiscent of a magician's sleight of hand, weaving a spellbinding narrative that defies conventional expectations. The r-squared value underscores the substantive variance in air pollution levels explained by the prevalence of the name Jarod, evoking the fervor of a captivating whodunit tale, albeit with a whimsical twist that is as improbable as a detective solving a crime using only a collection of witty wordplay.
In reconciling our eccentric inquiry with the broader scholarly panorama, it is worth noting the tangential yet provocative resonance with the thematic underpinnings of our study found in the intriguing allegories of Orwell's "1984" and Huxley's "Brave New World." These literary masterpieces beckon us to ponder the underlying currents of linguistic determinism and its latent influences on constructed realities, offering an obliquely poetic complement to the scholarly stride into the murky terrain of nomenclature and nature.
On a more lighthearted note, our scatterplot (Fig. 1) stands as a visual testament to the seemingly whimsical interplay between the prevalence of the name Jarod and the atmospheric impurities in Greenwood. This plot serves as a jovial reminder of the unexpected correlations that can emerge, much like discovering that your favorite ice cream flavor and choice of socks are surprisingly interconnected.
In sum, our findings serenade the scholarly community with a merry symphony of statistical whimsy, illuminating the playful interplay between nomenclature and the atmospheric milieu. They prompt reflection not only on the capricious nature of empirical inquiry but also on the delightful surprises that suffuse the scholarly labyrinth, akin to stumbling upon a treasure trove of puns in an unlikely statistical dataset.
Model: gpt-3.5-turbo-1106
System prompt: You are a goofy academic researcher writing an academic paper. You follow the rules, but you throw out convention regularly to make jokes and funny asides.You draft the discussion section of goofy academic research papers that sounds like it belongs based on the title and abstract provided.
User prompt:
Pretend you are an academic researcher. Your writing sounds like it belongs in a medical or economics journal. However, you frequently crack jokes, make puns, or add unexpected twists in your writing.
Please make up a short conclusion of an academic research paper presenting the findings of the connection between Popularity of the first name Jarod and Air pollution in Greenwood, South Carolina. Make it seem dry like academic research paper, but with lots of subtle hidden offhand remarks, jokes, goofy observations, and puns. Sneak in some jokes and clever puns about science, research, statistics, and the variables.
Limit your response to 300 tokens. At the very end, assert that no more research is needed in this area.
Here are the title, abstract, introduction, and results sections.
[[TITLE]]
The Jarod Quotient and Greenwood's Polluted Environment: A Name-astatic Study
[[ABSTRACT]]
This study delves into the curiously consequential connection between the prevalence of the first name Jarod and the air quality in Greenwood, South Carolina. By utilizing datasets from the US Social Security Administration and the Environmental Protection Agency, we conducted a comprehensive analysis from 1991 to 2012. Our findings reveal a remarkably high correlation coefficient of 0.8553629 and a significance level of p < 0.01, indicating a substantial relationship between the popularity of the name Jarod and air pollution levels. Additionally, our results pave the way for offbeat observations and pun-ridden discussions, shedding light on the light-hearted side of scholarly research.
[[INTRDUCTION]]
The nexus between nomenclature and natural phenomena has long intrigued scholars across various disciplines. Our study ventures into the peculiar paradigm of the potential interplay between the prevalence of the first name Jarod and the ambient air quality in Greenwood, South Carolina. The obscure correlation, or what we whimsically refer to as the "Jarod Quotient," serves as the focal point of our investigation. With a tongue-in-cheek nod to the complex web of statistical analyses, we set out to unravel the enigmatic relationship between the popularity of a moniker and the atmospheric conditions in a specific geographic locale.
In the realm of quantitative inquiry, the amalgamation of the United States Social Security Administration's dataset on baby names and the Environmental Protection Agency's records on air quality indices forms the bedrock of our meticulous examination. Over a comprehensive temporal scope ranging from 1991 to 2012, we painstakingly combed through the data, employing a battery of statistical methodologies to uncover the elusive interdependences between the eponymous Jarod and the ever-shifting tapestry of airborne pollutants.
Our initial forays into this uncharted territory yielded a correlation coefficient that would make any statistical purist raise an eyebrow, clocking in at a staggering 0.8553629. The sheer magnitude of this coefficient is enough to make even the most seasoned researcher do a double take, compelling us to push further into the arcane corridors of inquiry. A significance level of p < 0.01 cemented our conviction in the existence of a salient linkage, affirming that the association between the name Jarod and the atmospheric contaminants in Greenwood is not a mere statistical mirage, but a tangible phenomenon worthy of rigorous elucidation.
As we unravel the tantalizing tapestry of connections, we invite readers to join us in this odyssey of offbeat observations and droll deliberations. The unassuming name Jarod, nestled within a web of data points and probability distributions, emerges as the waggish protagonist in our scholarly tale, challenging traditional norms and embodying the unexpected whims of research inquiry. Indeed, our findings speak to a broader narrative, one that transcends the rigidity of academic discourse and embraces the mirthful musings that often lay concealed within the annals of scholarly exploration.
With a wink to the captivating quirks of statistical romance and the off-kilter harmonies of empirical inquiry, our study endeavors to unveil the peculiar dance between nomenclature and nature in the idyllic environs of Greenwood, South Carolina. As we embark on this lighthearted scholarly escapade, we invite our fellow academicians and keen-minded readers to partake in the revelry of discovery, where the unexpected reigns supreme and the chuckles of statistical whimsy echo through the hallowed halls of research.
[[RESULTS]]
The statistical analysis of the relationship between the prevalence of the first name Jarod and the concentration of air pollutants in Greenwood, South Carolina produced results that, much like a query into the existence of Bigfoot, raised both eyebrows and a few skeptical chuckles. The correlation coefficient of 0.8553629 indicated a striking, almost implausible connection between the frequency of the name Jarod and the atmospheric impurities permeating the peaceful environs of Greenwood. This coefficient was as robust as a well-groomed mustache and bore the weight of this peculiar association with the fortitude of a seasoned mountaineer.
Additionally, the r-squared value of 0.7316457 underscored the strength of the relationship, emphasizing that the variability in the air pollution levels in Greenwood could be explained by the prevalence of the name Jarod to an extent reminiscent of a chatty neighbor explaining their latest escapades. The significance level of p < 0.01 sealed the deal, pointing to a connection more compelling than a detective novel plot twist – one that could not be dismissed as a mere fluke or statistical artifact.
Of course, in the spirit of scholarly whimsy, we present the incontrovertible evidence of this correlation in the form of a scatterplot (Fig. 1). This plot portrays the unmistakable pattern of increasing air pollution levels aligning with the proliferation of the name Jarod, reinforcing the improbable and enigmatic nature of this relationship. It is a visual testament to the unforeseen correlations that lurk beneath the surface of seemingly disparate variables, akin to discovering that your favorite ice cream flavor and choice of socks are unexpectedly linked.
These findings invite a merry dance of speculation on the harmonious rhythm of nomenclature and the orchestral cacophony of atmospheric elements, evoking laughter in the hallowed halls of academia and sparking conversations as rib-tickling as a stand-up comedy routine. They prompt reflection not only on the capricious nature of empirical inquiry, but also on the delightful surprises that flourish within the terrain of scholarly exploration.
-------
Your response should start like this:
[[CONCLUSION]]
ChatGPT:
[[CONCLUSION]]
In conclusion, our unorthodox exploration into the curious correlation between the prevalence of the first name Jarod and air pollution levels in Greenwood, South Carolina has unveiled a pun-tastic discovery that tickles the fancy of statistical romantics and humor enthusiasts alike. The robust correlation coefficient of 0.8553629, r-squared value of 0.7316457, and significance level of p < 0.01 provide evidence as compelling as a magician revealing their secrets, solidifying the existence of a connection between the eponymous Jarod and the atmospheric impurities.
Our findings transcend the conventional confines of scholarly inquiry, inviting scholars and researchers to bask in the astonishing unpredictability of statistical anomalies. It's somewhat akin to stumbling upon a unicorn in a data forest – delightfully improbable, yet undeniably captivating.
As we bid adieu to this whimsical foray into the off-kilter corridors of research, we leave behind the mirthful musings and bad puns that have permeated this scholarly narrative. Nonetheless, we assert with the gravity of a solemn judge that no further research in this area is needed, for the absurdly high correlation and whimsical nature of this connection render it immune to any skepticism. It's a statistical oddity that gleefully defies expectation, leaving a trail of merriment and statistical befuddlement in its wake.
Model: gpt-3.5-turbo-1106
System prompt: You provide fictional names of academic journals. You say nothing else, and you do not chat with the user.
User prompt: Please provide the name of a funny but plausible sounding research, scientific, or academic journal that would publish a paper entited The Jarod Quotient and Greenwood's Polluted Environment: A Name-astatic Study. Respond only with the name of a fictional academic journal.
ChatGPT:
The Journal of Quirky Quantitative Studies
Model: gpt-3.5-turbo-1106
System prompt: You provide fictional names of nonprofit research organizations and associations. You say nothing else, and you do not chat with the user.
User prompt: Please provide the name of a funny but plausible sounding nonprofit, academic, or scientific association or organization that would sponsor research that resulted in a paper entited The Jarod Quotient and Greenwood's Polluted Environment: A Name-astatic Study. Respond only with the name of a fictional organization.
ChatGPT:
The Association for Quirky Quantitative Studies
Model: gpt-3.5-turbo-1106
System prompt: You provide potential search keywords separated by commas. You say nothing else, and you do not chat with the user.
User prompt: Please provide potential search keywords for a paper titled The Jarod Quotient and Greenwood's Polluted Environment: A Name-astatic Study with an abstract of This study delves into the curiously consequential connection between the prevalence of the first name Jarod and the air quality in Greenwood, South Carolina. By utilizing datasets from the US Social Security Administration and the Environmental Protection Agency, we conducted a comprehensive analysis from 1991 to 2012. Our findings reveal a remarkably high correlation coefficient of 0.8553629 and a significance level of p < 0.01, indicating a substantial relationship between the popularity of the name Jarod and air pollution levels. Additionally, our results pave the way for offbeat observations and pun-ridden discussions, shedding light on the light-hearted side of scholarly research.
ChatGPT:
Jarod, Greenwood, South Carolina, air quality, US Social Security Administration, Environmental Protection Agency, correlation coefficient, significance level, name trends, air pollution, dataset analysis
*There is a bunch of Python happening behind the scenes to turn this prompt sequence into a PDF.
Discover a new correlation
View all correlations
View all research papers
Report an error
Data details
Popularity of the first name JarodDetailed data title: Babies of all sexes born in the US named Jarod
Source: US Social Security Administration
See what else correlates with Popularity of the first name Jarod
Air pollution in Greenwood, South Carolina
Detailed data title: Percentage of days with air quality at 'unhealthy for sensitive groups' or worse in Greenwood, SC
Source: Environmental Protection Agency
See what else correlates with Air pollution in Greenwood, South Carolina
Correlation is a measure of how much the variables move together. If it is 0.99, when one goes up the other goes up. If it is 0.02, the connection is very weak or non-existent. If it is -0.99, then when one goes up the other goes down. If it is 1.00, you probably messed up your correlation function.
r2 = 0.7316457 (Coefficient of determination)
This means 73.2% of the change in the one variable (i.e., Air pollution in Greenwood, South Carolina) is predictable based on the change in the other (i.e., Popularity of the first name Jarod) over the 22 years from 1991 through 2012.
p < 0.01, which is statistically significant(Null hypothesis significance test)
The p-value is 3.9E-7. 0.0000003925973561307535600000
The p-value is a measure of how probable it is that we would randomly find a result this extreme. More specifically the p-value is a measure of how probable it is that we would randomly find a result this extreme if we had only tested one pair of variables one time.
But I am a p-villain. I absolutely did not test only one pair of variables one time. I correlated hundreds of millions of pairs of variables. I threw boatloads of data into an industrial-sized blender to find this correlation.
Who is going to stop me? p-value reporting doesn't require me to report how many calculations I had to go through in order to find a low p-value!
On average, you will find a correaltion as strong as 0.86 in 3.9E-5% of random cases. Said differently, if you correlated 2,547,139 random variables You don't actually need 2 million variables to find a correlation like this one. I don't have that many variables in my database. You can also correlate variables that are not independent. I do this a lot.
p-value calculations are useful for understanding the probability of a result happening by chance. They are most useful when used to highlight the risk of a fluke outcome. For example, if you calculate a p-value of 0.30, the risk that the result is a fluke is high. It is good to know that! But there are lots of ways to get a p-value of less than 0.01, as evidenced by this project.
In this particular case, the values are so extreme as to be meaningless. That's why no one reports p-values with specificity after they drop below 0.01.
Just to be clear: I'm being completely transparent about the calculations. There is no math trickery. This is just how statistics shakes out when you calculate hundreds of millions of random correlations.
with the same 21 degrees of freedom, Degrees of freedom is a measure of how many free components we are testing. In this case it is 21 because we have two variables measured over a period of 22 years. It's just the number of years minus ( the number of variables minus one ), which in this case simplifies to the number of years minus one.
you would randomly expect to find a correlation as strong as this one.
[ 0.68, 0.94 ] 95% correlation confidence interval (using the Fisher z-transformation)
The confidence interval is an estimate the range of the value of the correlation coefficient, using the correlation itself as an input. The values are meant to be the low and high end of the correlation coefficient with 95% confidence.
This one is a bit more complciated than the other calculations, but I include it because many people have been pushing for confidence intervals instead of p-value calculations (for example: NEJM. However, if you are dredging data, you can reliably find yourself in the 5%. That's my goal!
All values for the years included above: If I were being very sneaky, I could trim years from the beginning or end of the datasets to increase the correlation on some pairs of variables. I don't do that because there are already plenty of correlations in my database without monkeying with the years.
Still, sometimes one of the variables has more years of data available than the other. This page only shows the overlapping years. To see all the years, click on "See what else correlates with..." link above.
| 1991 | 1992 | 1993 | 1994 | 1995 | 1996 | 1997 | 1998 | 1999 | 2000 | 2001 | 2002 | 2003 | 2004 | 2005 | 2006 | 2007 | 2008 | 2009 | 2010 | 2011 | 2012 | |
| Popularity of the first name Jarod (Babies born) | 228 | 188 | 208 | 186 | 162 | 216 | 738 | 1045 | 778 | 599 | 656 | 399 | 234 | 168 | 137 | 114 | 96 | 70 | 60 | 59 | 60 | 51 |
| Air pollution in Greenwood, South Carolina (Bad air quality days) | 0.00381679 | 0.0336391 | 0.0501475 | 0.022082 | 0.0553191 | 0.0242718 | 0.104167 | 0.157676 | 0.164122 | 0.121212 | 0.113553 | 0.139194 | 0.0407407 | 0.0305344 | 0.0606061 | 0.0561798 | 0.0839161 | 0.0263158 | 0 | 0 | 0 | 0.00473934 |
Why this works
- Data dredging: I have 25,237 variables in my database. I compare all these variables against each other to find ones that randomly match up. That's 636,906,169 correlation calculations! This is called “data dredging.” Instead of starting with a hypothesis and testing it, I instead abused the data to see what correlations shake out. It’s a dangerous way to go about analysis, because any sufficiently large dataset will yield strong correlations completely at random.
- Lack of causal connection: There is probably
Because these pages are automatically generated, it's possible that the two variables you are viewing are in fact causually related. I take steps to prevent the obvious ones from showing on the site (I don't let data about the weather in one city correlate with the weather in a neighboring city, for example), but sometimes they still pop up. If they are related, cool! You found a loophole.
no direct connection between these variables, despite what the AI says above. This is exacerbated by the fact that I used "Years" as the base variable. Lots of things happen in a year that are not related to each other! Most studies would use something like "one person" in stead of "one year" to be the "thing" studied. - Observations not independent: For many variables, sequential years are not independent of each other. If a population of people is continuously doing something every day, there is no reason to think they would suddenly change how they are doing that thing on January 1. A simple
Personally I don't find any p-value calculation to be 'simple,' but you know what I mean.
p-value calculation does not take this into account, so mathematically it appears less probable than it really is.
Try it yourself
You can calculate the values on this page on your own! Try running the Python code to see the calculation results. Step 1: Download and install Python on your computer.Step 2: Open a plaintext editor like Notepad and paste the code below into it.
Step 3: Save the file as "calculate_correlation.py" in a place you will remember, like your desktop. Copy the file location to your clipboard. On Windows, you can right-click the file and click "Properties," and then copy what comes after "Location:" As an example, on my computer the location is "C:\Users\tyler\Desktop"
Step 4: Open a command line window. For example, by pressing start and typing "cmd" and them pressing enter.
Step 5: Install the required modules by typing "pip install numpy", then pressing enter, then typing "pip install scipy", then pressing enter.
Step 6: Navigate to the location where you saved the Python file by using the "cd" command. For example, I would type "cd C:\Users\tyler\Desktop" and push enter.
Step 7: Run the Python script by typing "python calculate_correlation.py"
If you run into any issues, I suggest asking ChatGPT to walk you through installing Python and running the code below on your system. Try this question:
"Walk me through installing Python on my computer to run a script that uses scipy and numpy. Go step-by-step and ask me to confirm before moving on. Start by asking me questions about my operating system so that you know how to proceed. Assume I want the simplest installation with the latest version of Python and that I do not currently have any of the necessary elements installed. Remember to only give me one step per response and confirm I have done it before proceeding."
# These modules make it easier to perform the calculation
import numpy as np
from scipy import stats

# We'll define a function that we can call to return the correlation calculations
def calculate_correlation(array1, array2):

    # Calculate Pearson correlation coefficient and p-value
    correlation, p_value = stats.pearsonr(array1, array2)

    # Calculate R-squared as the square of the correlation coefficient
    r_squared = correlation**2

    return correlation, r_squared, p_value

# These are the arrays for the variables shown on this page, but you can modify them to be any two sets of numbers
array_1 = np.array([228,188,208,186,162,216,738,1045,778,599,656,399,234,168,137,114,96,70,60,59,60,51,])
array_2 = np.array([0.00381679,0.0336391,0.0501475,0.022082,0.0553191,0.0242718,0.104167,0.157676,0.164122,0.121212,0.113553,0.139194,0.0407407,0.0305344,0.0606061,0.0561798,0.0839161,0.0263158,0,0,0,0.00473934,])
array_1_name = "Popularity of the first name Jarod"
array_2_name = "Air pollution in Greenwood, South Carolina"

# Perform the calculation
print(f"Calculating the correlation between {array_1_name} and {array_2_name}...")
correlation, r_squared, p_value = calculate_correlation(array_1, array_2)

# Print the results
print("Correlation Coefficient:", correlation)
print("R-squared:", r_squared)
print("P-value:", p_value)
Reuseable content
You may re-use the images on this page for any purpose, even commercial purposes, without asking for permission. The only requirement is that you attribute Tyler Vigen. Attribution can take many different forms. If you leave the "tylervigen.com" link in the image, that satisfies it just fine. If you remove it and move it to a footnote, that's fine too. You can also just write "Charts courtesy of Tyler Vigen" at the bottom of an article.You do not need to attribute "the spurious correlations website," and you don't even need to link here if you don't want to. I don't gain anything from pageviews. There are no ads on this site, there is nothing for sale, and I am not for hire.
For the record, I am just one person. Tyler Vigen, he/him/his. I do have degrees, but they should not go after my name unless you want to annoy my wife. If that is your goal, then go ahead and cite me as "Tyler Vigen, A.A. A.A.S. B.A. J.D." Otherwise it is just "Tyler Vigen."
When spoken, my last name is pronounced "vegan," like I don't eat meat.
Full license details.
For more on re-use permissions, or to get a signed release form, see tylervigen.com/permission.
Download images for these variables:
- High resolution line chart
The image linked here is a Scalable Vector Graphic (SVG). It is the highest resolution that is possible to achieve. It scales up beyond the size of the observable universe without pixelating. You do not need to email me asking if I have a higher resolution image. I do not. The physical limitations of our universe prevent me from providing you with an image that is any higher resolution than this one.
If you insert it into a PowerPoint presentation (a tool well-known for managing things that are the scale of the universe), you can right-click > "Ungroup" or "Create Shape" and then edit the lines and text directly. You can also change the colors this way.
Alternatively you can use a tool like Inkscape. - High resolution line chart, optimized for mobile
- Alternative high resolution line chart
- Scatterplot
- Portable line chart (png)
- Portable line chart (png), optimized for mobile
- Line chart for only Popularity of the first name Jarod
- Line chart for only Air pollution in Greenwood, South Carolina
- AI-generated correlation image
- The spurious research paper: The Jarod Quotient and Greenwood's Polluted Environment: A Name-astatic Study
Kudos for rating!
Correlation ID: 5788 · Black Variable ID: 3581 · Red Variable ID: 22311

