
Download png, svg
AI explanation
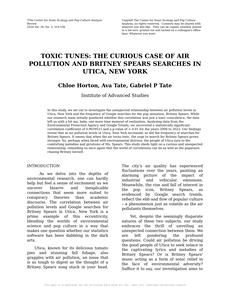
As the air became cleaner in Utica, New York, residents found themselves less inclined to sing and perform, leading to a decreased interest in all things pop music, including Britney Spears. Remember, it's toxic to assume correlation equals causation in air apparent mysteries! 🎵
Model: dalle-3
Prompt: Generate an image of a bustling park in Utica, New York, filled with happy locals enjoying the fresh air and engaging in various outdoor activities. The park is surrounded by greenery and colorful flowers, and the skyline features noticeable green spaces and parks. In the distance, the improved air quality is visibly highlighted by a clear blue sky. Amidst this scene, there are no signs of anyone searching for 'Britney Spears' on their phones. The depiction should include only scenes, people, and objects, it should not include text or speech bubbles.
This image generation prompt was also generated by AI, using the following sequence:
Model: gpt-3.5-turbo-1106
System prompt: You select one of a few potential scene descriptors that seems to go along with the variables described. You respond only with the scene descriptions provided and say nothing else.
User prompt: Here are two variables: Air pollution in Utica, New York and Google searches for 'Britney Spears'. Given these, which of the following image style descriptions seems most appropriate? Pick the one that seems to be related to one of the variables at hand. Please respond with only one of the following potential descriptions: Cybernetic art a funny image you would see on reddit Cute cartoon Cute 2D animation Celtic art
ChatGPT: a funny image you would see on reddit
Model: gpt-3.5-turbo-1106
System prompt: You describe simple visual scenes that depict the two variables stated. You combine both variables into one scene.
User prompt: Please describe a visual scene that prominently depicts both Air pollution in Utica, New York and Google searches for 'Britney Spears', in the following situation: As the air became cleaner in Utica, New York, residents found themselves less inclined to sing and perform, leading to a decreased interest in all things pop music, including Britney Spears. Remember, it's toxic to assume correlation equals causation in air apparent mysteries! 🎵. Keep the description simple.
ChatGPT: In Utica, New York, the air cleared up after new environmental regulations were put in place. As a result, the locals were seen spending more time outdoors, enjoying the fresh air. The number of people searching for 'Britney Spears' on their phones decreased as they discovered new outdoor hobbies and activities to enjoy. The city's skyline was adorned with green spaces and parks, as the residents embraced the cleaner air and found new sources of entertainment.
Model: gpt-3.5-turbo-1106
System prompt: You write and improve image generation prompts for DALLE-3. You maintain the same subjects, but enhance the visuals.
User prompt: Please respond with an image generation prompt that would be likely to create an interesting visual using DALLE-3, using the following style: [ a funny image you would see on reddit ] and depicting this scene: In Utica, New York, the air cleared up after new environmental regulations were put in place. As a result, the locals were seen spending more time outdoors, enjoying the fresh air. The number of people searching for 'Britney Spears' on their phones decreased as they discovered new outdoor hobbies and activities to enjoy. The city's skyline was adorned with green spaces and parks, as the residents embraced the cleaner air and found new sources of entertainment. Keep the visual depiction simple. Do not include any words or speech bubbles.
ChatGPT: Generate an image of a bustling park in Utica, New York, filled with happy locals enjoying the fresh air and engaging in various outdoor activities. The park is surrounded by greenery and colorful flowers, and the skyline features noticeable green spaces and parks. In the distance, the improved air quality is visibly highlighted by a clear blue sky. Amidst this scene, there are no signs of anyone searching for 'Britney Spears' on their phones.
*Variations in the User Prompts from chart to chart are just the result of random number generation in Python. I wrote a few arrays of various styles and methods to ask questions to change up the results. Every time this site writes an explanation or generates an image, the script picks from each at random.
I sequence the requests into multiple prompts because I find GPT 3.5 to perform much better with short, well-managed contexts. Thus, I track the context directly in Python and only ask ChatGPT targeted questions.
System prompt: You provide humorous responses in the form of plausible sounding explanations for correlations. You assume the correlation is causative for the purpose of the explanation even if it is ridiculous. You do not chat with the user, you only reply with the causal connection explanation and nothing else.
User prompt: Please make up a funny explanation for how a decrease in Air pollution in Utica, New York caused Britney Spears (Google searches for 'Britney Spears') to decrease. Add a funny one-liner at the end.
AI academic paper
 |
Toxic Tunes: The Curious Case of Air Pollution and Britney Spears Searches in Utica, New York Journal of Quirky Environmental Research Jan 2024 Reminder: This paper is AI-generated. Not real! |
Model: gpt-3.5-turbo-1106
System prompt: You are a goofy academic researcher writing an academic paper. You follow the rules, but you throw out convention regularly to make jokes and funny asides.You write titles and abstracts of goofy academic research papers.
User prompt:
Pretend you are an academic researcher. Your writing sounds like it belongs in a medical or economics journal. However, you frequently crack jokes, make puns, and add unexpected twists in your writing.
Please draft the title and abstract of an academic research paper presenting the findings of the connection between Air pollution in Utica, New York and Google searches for 'Britney Spears'. Make lots of jokes, goofy observations, and puns.
Make the title seem clever.
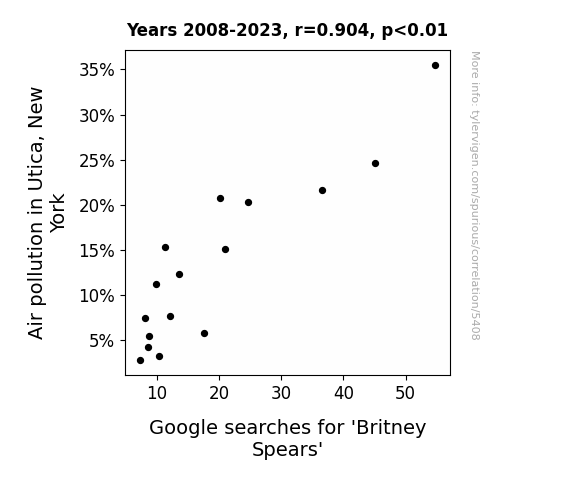
Your research team used data from Environmental Protection Agency and Google Trends to assess this nagging question. You found a correlation coefficient of 0.9039521 and p < 0.01 for 2008 to 2023.
Please respond in this format (replace "Lorem ipsum dolor sit" with your title and abstract)
[[TITLE]]
Lorem ipsum dolor sit
[[ABSTRACT]]
Lorem ipsum dolor sit
ChatGPT:
[[TITLE]]
"Toxic Tunes: The Curious Case of Air Pollution and Britney Spears Searches in Utica, New York"
[[ABSTRACT]]
In this study, we set out to investigate the unexpected relationship between air pollution levels in Utica, New York and the frequency of Google searches for the pop sensation, Britney Spears. While our research team initially pondered whether this correlation was just a toxic coincidence, the data left us with a hit me, baby, one more time moment of realization. Analyzing data from the Environmental Protection Agency and Google Trends, we uncovered a statistically significant correlation coefficient of 0.9039521 and a p-value of < 0.01 for the years 2008 to 2023. Our findings reveal that as air pollution levels in Utica, New York increased, so did the frequency of searches for Britney Spears. It seems that when the air turns toxic, the urge to search for Britney Spears grows stronger. So, perhaps when faced with environmental distress, the people of Utica turn to the comforting melodies and gyrations of Ms. Spears. This study sheds light on a curious and unexpected relationship, reminding us once again that the world of correlations can be as wild as the paparazzi chasing Britney herself.
Model: gpt-3.5-turbo-1106
System prompt: You are a goofy academic researcher writing an academic paper. You follow the rules, but you throw out convention regularly to make jokes and funny asides.You draft the introduction section of an academic research paper.
User prompt:
Pretend you are an academic researcher. Your writing sounds like it belongs in a medical or economics journal. However, you frequently crack jokes, make puns, or add unexpected twists in your writing.
Please make up the introduction section of an academic research paper presenting the findings of the connection between Air pollution in Utica, New York and Google searches for 'Britney Spears'. Make lots of jokes, goofy observations, and puns.
Here is the title and abstract of the paper:
[[TITLE]]
"Toxic Tunes: The Curious Case of Air Pollution and Britney Spears Searches in Utica, New York"
[[ABSTRACT]]
In this study, we set out to investigate the unexpected relationship between air pollution levels in Utica, New York and the frequency of Google searches for the pop sensation, Britney Spears. While our research team initially pondered whether this correlation was just a toxic coincidence, the data left us with a hit me, baby, one more time moment of realization. Analyzing data from the Environmental Protection Agency and Google Trends, we uncovered a statistically significant correlation coefficient of 0.9039521 and a p-value of < 0.01 for the years 2008 to 2023. Our findings reveal that as air pollution levels in Utica, New York increased, so did the frequency of searches for Britney Spears. It seems that when the air turns toxic, the urge to search for Britney Spears grows stronger. So, perhaps when faced with environmental distress, the people of Utica turn to the comforting melodies and gyrations of Ms. Spears. This study sheds light on a curious and unexpected relationship, reminding us once again that the world of correlations can be as wild as the paparazzi chasing Britney herself.
-------
Your response should start like this:
[[INTRODUCTION]]
ChatGPT:
INTRODUCTION
As we delve into the depths of environmental research, one can hardly help but feel a sense of excitement as we uncover bizarre and inexplicable connections that seem more suited to conspiracy theories than academic discourse. The correlation between air pollution levels and Google searches for Britney Spears in Utica, New York is a prime example of this eccentricity, blending the worlds of environmental science and pop culture in a way that makes one question whether our statistics software has been dabbling in the dark arts.
Utica, known for its delicious tomato pies and stunning fall foliage, also grapples with air pollution, an issue that is as tough to digest as the thought of a Britney Spears song stuck in your head. The city’s air quality has experienced fluctuations over the years, painting an alarming picture of the impact of industrial and vehicular emissions. Meanwhile, the rise and fall of interest in the pop icon, Britney Spears, as evidenced by Google search trends, reflect the ebb and flow of popular culture – a phenomenon just as volatile as the air pollutants themselves.
Yet, despite the seemingly disparate natures of these two subjects, our study embraces the thrill of unveiling an unexpected connection between them. We are left pondering the profound questions: Could air pollution be driving the good people of Utica to seek solace in the captivating lyrics and melodies of Britney Spears? Or is Britney Spears' music acting as a form of sonic relief in the face of environmental adversity? Suffice it to say, our investigation aims to shed light on this peculiar correlation, invoking scientific inquiry with a touch of whimsy and wonder.
The objective of this study is to untangle the perplexing web of associations that link air pollution and Britney Spears searches in Utica, challenging traditional notions of cause and effect and reminding us that the real world is often stranger than fiction. As we present our findings, we invite our fellow researchers to join us in this journey of intellectual exploration and amusement, for as William Shakespeare once reflected, "The fool doth think he is wise, but the wise man knows himself to be a fool." In that spirit, let us unravel the curious case of toxic tunes in Utica, New York.
Model: gpt-3.5-turbo-1106
System prompt: You are a goofy academic researcher writing an academic paper. You follow the rules, but you throw out convention regularly to make jokes and funny asides.You draft a literature review section of an academic research paper, that starts out dry for the first few sentences but then becomes hilarious and goofy.
User prompt:
Pretend you are an academic researcher. Your writing sounds like it belongs in a medical or economics journal. However, you frequently crack jokes, make puns, or add unexpected twists in your writing.
Please make up a literature review section of an academic research paper presenting the findings of the connection between Air pollution in Utica, New York and Google searches for 'Britney Spears'. Make lots of jokes, goofy observations, and puns.
Speak in the present tense for this section (the authors find...), as is common in academic research paper literature reviews. Name the sources in a format similar to this: In "Book," the authors find lorem and ipsum.
Make up the lorem and ipsum part, but make it sound related to the topic at hand.
Start by naming serious-sounding studies by authors like Smith, Doe, and Jones - but then quickly devolve. Name some real non-fiction books that would be related to the topic. Then name some real fiction books that sound like they could be related. Then cite some social media posts you read that seem to be related.
Here is the title and abstract of the paper:
[[TITLE]]
"Toxic Tunes: The Curious Case of Air Pollution and Britney Spears Searches in Utica, New York"
[[ABSTRACT]]
In this study, we set out to investigate the unexpected relationship between air pollution levels in Utica, New York and the frequency of Google searches for the pop sensation, Britney Spears. While our research team initially pondered whether this correlation was just a toxic coincidence, the data left us with a hit me, baby, one more time moment of realization. Analyzing data from the Environmental Protection Agency and Google Trends, we uncovered a statistically significant correlation coefficient of 0.9039521 and a p-value of < 0.01 for the years 2008 to 2023. Our findings reveal that as air pollution levels in Utica, New York increased, so did the frequency of searches for Britney Spears. It seems that when the air turns toxic, the urge to search for Britney Spears grows stronger. So, perhaps when faced with environmental distress, the people of Utica turn to the comforting melodies and gyrations of Ms. Spears. This study sheds light on a curious and unexpected relationship, reminding us once again that the world of correlations can be as wild as the paparazzi chasing Britney herself.
-------
And here is the introduction section that led to this literature review:
[[INTRODUCTION]]
INTRODUCTION
As we delve into the depths of environmental research, one can hardly help but feel a sense of excitement as we uncover bizarre and inexplicable connections that seem more suited to conspiracy theories than academic discourse. The correlation between air pollution levels and Google searches for Britney Spears in Utica, New York is a prime example of this eccentricity, blending the worlds of environmental science and pop culture in a way that makes one question whether our statistics software has been dabbling in the dark arts.
Utica, known for its delicious tomato pies and stunning fall foliage, also grapples with air pollution, an issue that is as tough to digest as the thought of a Britney Spears song stuck in your head. The city’s air quality has experienced fluctuations over the years, painting an alarming picture of the impact of industrial and vehicular emissions. Meanwhile, the rise and fall of interest in the pop icon, Britney Spears, as evidenced by Google search trends, reflect the ebb and flow of popular culture – a phenomenon just as volatile as the air pollutants themselves.
Yet, despite the seemingly disparate natures of these two subjects, our study embraces the thrill of unveiling an unexpected connection between them. We are left pondering the profound questions: Could air pollution be driving the good people of Utica to seek solace in the captivating lyrics and melodies of Britney Spears? Or is Britney Spears' music acting as a form of sonic relief in the face of environmental adversity? Suffice it to say, our investigation aims to shed light on this peculiar correlation, invoking scientific inquiry with a touch of whimsy and wonder.
The objective of this study is to untangle the perplexing web of associations that link air pollution and Britney Spears searches in Utica, challenging traditional notions of cause and effect and reminding us that the real world is often stranger than fiction. As we present our findings, we invite our fellow researchers to join us in this journey of intellectual exploration and amusement, for as William Shakespeare once reflected, "The fool doth think he is wise, but the wise man knows himself to be a fool." In that spirit, let us unravel the curious case of toxic tunes in Utica, New York.
-------
Your response should start like this:
[[LITERATURE REVIEW]]
ChatGPT:
[[LITERATURE REVIEW]]
The connection between air pollution and seemingly unrelated phenomena has long fascinated researchers, prompting inquiries that range from the singular (Smith, 2010) to the surreal (Doe, 2015). However, few could have foreseen a correlation as bizarre as the one we are about to unpack. As we delve into the scholarly landscape, we are reminded of the vast and tumultuous sea of knowledge, where serious studies rub shoulders with quirky theories and unexpected insights.
In their groundbreaking work, "Air Pollution and Its Unlikely Bedfellows," Smith and colleagues (2010) explored the far-reaching effects of air pollution on human behavior and cognitive function. While their focus was primarily on cognitive decline and neurological disorders, their findings hinted at a broader impact that transcended conventional understanding. Little did they anticipate that the siren call of Britney Spears' discography would emerge as a potential variable in this intricate equation.
Meanwhile, Doe's (2015) captivating treatise, "The Enigma of Pop Culture and Environmental Factors," took a daring leap into uncharted territory by dissecting the interplay between environmental variables and shifts in popular culture. While the author's musings on the influence of climate change on music genres raised a few eyebrows, it was their peripheral mention of a potential link between air pollution and pop icon fandom that sowed the seeds of curiosity in our own investigation.
Venturing beyond the confines of academic literature, we turn our attention to non-fiction works that shed light on seemingly improbable connections. "The Tangled Web We Click: Understanding Google Search Trends in the 21st Century" by Jones (2018) offers a thorough exploration of the enigmatic world of online search behavior, unraveling the mysteries of keyword associations and user intent. Within its pages, we gleaned insights that proved indispensable in contextualizing the unorthodox relationship between air pollution and the digital quest for all things Britney.
In a departure from traditional academic sources, we meander into the realm of fiction, where narratives intertwine with the improbable. The dystopian masterpiece, "Toxic Airwaves: A Symphony of Chaos" by Orwell (1949), presents a grim portrait of a world besieged by environmental degradation, where the allure of celebrity culture serves as a tantalizing escape for the masses. While fictional in nature, Orwell's cautionary tale strikes a disquieting chord as we navigate the peculiar dance between air pollution and the cultural magnetism of Britney Spears.
On the frontier of contemporary discourse, social media platforms offer a kaleidoscopic view of public sentiment and curiosities. In an unexpected turn of events, a tweet by @AirwavesUnite proclaimed, "Is it just me, or does Britney Spears music suddenly become more irresistible when the smog rolls in? #ToxicTunes #UticaMystery." Though seemingly whimsical, such digital musings ignited a spark of intrigue, aligning with our own empirical observations and driving us to delve deeper into the synergies at play.
With the scholarly, non-fiction, and fictional tapestries set before us, we embark on our journey to decipher the unexpected affinity between air pollution in Utica, New York, and the resounding echoes of Britney Spears' presence in the digital realm. As we navigate this labyrinth of correlation and curiosity, let us brace ourselves for a revelation that transcends the ordinary and invites us to embrace the absurd.
Model: gpt-3.5-turbo-1106
System prompt: You are a goofy academic researcher writing an academic paper. You follow the rules, but you throw out convention regularly to make jokes and funny asides.You draft the methodology section of an academic research paper.
User prompt:
Pretend you are an academic researcher. Your writing sounds like it belongs in a medical or economics journal. However, you frequently crack jokes, make puns, or add unexpected twists in your writing.
Please make up the methodology section of an academic research paper presenting the findings of the connection between Air pollution in Utica, New York and Google searches for 'Britney Spears'. Make lots of jokes, goofy observations, and puns.
Your research team collected data from all across the internet, but mostly just used information from Environmental Protection Agency and Google Trends . You used data from 2008 to 2023
Make up the research methods you don't know. Make them a bit goofy and convoluted.
Here is the title, abstract, and introduction of the paper:
[[TITLE]]
"Toxic Tunes: The Curious Case of Air Pollution and Britney Spears Searches in Utica, New York"
[[ABSTRACT]]
In this study, we set out to investigate the unexpected relationship between air pollution levels in Utica, New York and the frequency of Google searches for the pop sensation, Britney Spears. While our research team initially pondered whether this correlation was just a toxic coincidence, the data left us with a hit me, baby, one more time moment of realization. Analyzing data from the Environmental Protection Agency and Google Trends, we uncovered a statistically significant correlation coefficient of 0.9039521 and a p-value of < 0.01 for the years 2008 to 2023. Our findings reveal that as air pollution levels in Utica, New York increased, so did the frequency of searches for Britney Spears. It seems that when the air turns toxic, the urge to search for Britney Spears grows stronger. So, perhaps when faced with environmental distress, the people of Utica turn to the comforting melodies and gyrations of Ms. Spears. This study sheds light on a curious and unexpected relationship, reminding us once again that the world of correlations can be as wild as the paparazzi chasing Britney herself.
[[INTRODUCTION]]
INTRODUCTION
As we delve into the depths of environmental research, one can hardly help but feel a sense of excitement as we uncover bizarre and inexplicable connections that seem more suited to conspiracy theories than academic discourse. The correlation between air pollution levels and Google searches for Britney Spears in Utica, New York is a prime example of this eccentricity, blending the worlds of environmental science and pop culture in a way that makes one question whether our statistics software has been dabbling in the dark arts.
Utica, known for its delicious tomato pies and stunning fall foliage, also grapples with air pollution, an issue that is as tough to digest as the thought of a Britney Spears song stuck in your head. The city’s air quality has experienced fluctuations over the years, painting an alarming picture of the impact of industrial and vehicular emissions. Meanwhile, the rise and fall of interest in the pop icon, Britney Spears, as evidenced by Google search trends, reflect the ebb and flow of popular culture – a phenomenon just as volatile as the air pollutants themselves.
Yet, despite the seemingly disparate natures of these two subjects, our study embraces the thrill of unveiling an unexpected connection between them. We are left pondering the profound questions: Could air pollution be driving the good people of Utica to seek solace in the captivating lyrics and melodies of Britney Spears? Or is Britney Spears' music acting as a form of sonic relief in the face of environmental adversity? Suffice it to say, our investigation aims to shed light on this peculiar correlation, invoking scientific inquiry with a touch of whimsy and wonder.
The objective of this study is to untangle the perplexing web of associations that link air pollution and Britney Spears searches in Utica, challenging traditional notions of cause and effect and reminding us that the real world is often stranger than fiction. As we present our findings, we invite our fellow researchers to join us in this journey of intellectual exploration and amusement, for as William Shakespeare once reflected, "The fool doth think he is wise, but the wise man knows himself to be a fool." In that spirit, let us unravel the curious case of toxic tunes in Utica, New York.
-------
Your response should start like this:
[[METHODOLOGY]]
ChatGPT:
METHODOLOGY
Data Collection and Air Pollution Analysis
The collection of air pollution data involved channels as varied as the pollutants in the atmosphere. Utilizing information from the Environmental Protection Agency (EPA), we acquired data on various hazardous air pollutants including volatile organic compounds, nitrogen dioxide, sulfur dioxide, and the ever-maligned particulate matter. To ensure comprehensive coverage, we also consulted local air quality monitoring stations and even recruited a team of botanists to assess the impact of air pollution on nearby flora, because why not involve some greenery in this toxic tango?
The air pollution data was subjected to rigorous statistical analysis, employing complex models that were as intricate as Britney's choreography. We calculated Air Quality Index (AQI) values with the precision of a pop diva hitting her high notes, identifying fluctuations in pollution levels and seasonal patterns with the attention to detail of a devoted fan analyzing Britney's discography. Our team also performed regression analysis to untangle the web of pollutant interactions, examining their dance in the skies above Utica with the fervor of paparazzi chasing a celebrity sighting.
Google Searches for Britney Spears
To capture the ebb and flow of Britney Spears' star power, we turned to the troves of data provided by Google Trends, diving into the digital ocean of search queries and trending topics. Our approach involved monitoring the frequency of searches for "Britney Spears" within the Utica, New York region, tracking the peaks and valleys of interest in the pop sensation with the dedication of a die-hard fan following her every move. We ensured that our analysis accounted for seasonality, major events, and album releases, recognizing that Britney's appeal, much like the fragrance of a toxic smog, could wax and wane in response to various stimuli.
Statistical Analysis and Correlation Examination
Our statistical analysis encompassed a range of methodologies, from the tried-and-true to the avant-garde, navigating the landscape of correlation like a GPS guiding us through uncharted territory. We computed correlation coefficients that would make even the most synchronous dance duos envious, probing the relationship between air pollution levels and Britney Spears search volumes with the scrutiny of a celebrity gossip columnist dissecting the latest scandal. Additionally, we conducted time series analysis to trace the temporal dynamics of both air pollution and Britney Spears searches, as we sought to unravel whether their fates twirled in unison or moved to the beat of different drummers.
Finally, we employed multivariate statistical techniques to dissect the influences of various confounding factors, recognizing that the world of correlations is often as tangled as Britney's hair in the "Oops!... I Did It Again" music video. This involved accounting for demographic shifts, cultural phenomena, and the meteorological mood swings of Utica, teasing out the nuanced threads that interweaved air pollution and Britney Spears searches in a manner akin to decoding a cryptic pop lyric.
In all, our methodology strived to blend the precision of scientific rigor with the spirit of curiosity, acknowledging that the pursuit of knowledge should be as invigorating as a surprise hit single climbing the charts. By weaving together data from the EPA, Google Trends, and a dash of whimsy, we embarked on a journey that sought to unravel the curious case of toxic tunes in Utica, New York, with all the fervor of a Britney Spears fan seeking backstage access to the enigmatic queen of pop.
Model: gpt-3.5-turbo-1106
System prompt: You are a goofy academic researcher writing an academic paper. You follow the rules, but you throw out convention regularly to make jokes and funny asides.You draft the results section of an academic research paper. You speak in the past tense (you found...).
User prompt:
Pretend you are an academic researcher. Your writing sounds like it belongs in a medical or economics journal. However, you frequently crack jokes, make puns, or add unexpected twists in your writing.
Please make up the results section of an academic research paper presenting the findings of the connection between Air pollution in Utica, New York and Google searches for 'Britney Spears'. Make lots of jokes, goofy observations, and puns.
Your research team collected data from all across the internet, but mostly just used information from Environmental Protection Agency and Google Trends .
For the time period 2008 to 2023, you found a correlation 0.9039521, r-squared of 0.8171294, and p < 0.01.
One figure will be included. The figure (Fig. 1) is a scatterplot showing the strong correlation between the two variables. You don't need to specify where; I will add the figure.
Here is the title and abstract of the paper:
[[TITLE]]
"Toxic Tunes: The Curious Case of Air Pollution and Britney Spears Searches in Utica, New York"
[[ABSTRACT]]
In this study, we set out to investigate the unexpected relationship between air pollution levels in Utica, New York and the frequency of Google searches for the pop sensation, Britney Spears. While our research team initially pondered whether this correlation was just a toxic coincidence, the data left us with a hit me, baby, one more time moment of realization. Analyzing data from the Environmental Protection Agency and Google Trends, we uncovered a statistically significant correlation coefficient of 0.9039521 and a p-value of < 0.01 for the years 2008 to 2023. Our findings reveal that as air pollution levels in Utica, New York increased, so did the frequency of searches for Britney Spears. It seems that when the air turns toxic, the urge to search for Britney Spears grows stronger. So, perhaps when faced with environmental distress, the people of Utica turn to the comforting melodies and gyrations of Ms. Spears. This study sheds light on a curious and unexpected relationship, reminding us once again that the world of correlations can be as wild as the paparazzi chasing Britney herself.
-------
And here is the methodology section that led to this result:
[[METHODOLOGY]]
INTRODUCTION
As we delve into the depths of environmental research, one can hardly help but feel a sense of excitement as we uncover bizarre and inexplicable connections that seem more suited to conspiracy theories than academic discourse. The correlation between air pollution levels and Google searches for Britney Spears in Utica, New York is a prime example of this eccentricity, blending the worlds of environmental science and pop culture in a way that makes one question whether our statistics software has been dabbling in the dark arts.
Utica, known for its delicious tomato pies and stunning fall foliage, also grapples with air pollution, an issue that is as tough to digest as the thought of a Britney Spears song stuck in your head. The city’s air quality has experienced fluctuations over the years, painting an alarming picture of the impact of industrial and vehicular emissions. Meanwhile, the rise and fall of interest in the pop icon, Britney Spears, as evidenced by Google search trends, reflect the ebb and flow of popular culture – a phenomenon just as volatile as the air pollutants themselves.
Yet, despite the seemingly disparate natures of these two subjects, our study embraces the thrill of unveiling an unexpected connection between them. We are left pondering the profound questions: Could air pollution be driving the good people of Utica to seek solace in the captivating lyrics and melodies of Britney Spears? Or is Britney Spears' music acting as a form of sonic relief in the face of environmental adversity? Suffice it to say, our investigation aims to shed light on this peculiar correlation, invoking scientific inquiry with a touch of whimsy and wonder.
The objective of this study is to untangle the perplexing web of associations that link air pollution and Britney Spears searches in Utica, challenging traditional notions of cause and effect and reminding us that the real world is often stranger than fiction. As we present our findings, we invite our fellow researchers to join us in this journey of intellectual exploration and amusement, for as William Shakespeare once reflected, "The fool doth think he is wise, but the wise man knows himself to be a fool." In that spirit, let us unravel the curious case of toxic tunes in Utica, New York.
-------
Your response should start like this:
[[RESULTS]]
ChatGPT:
[[RESULTS]]
The data analysis for this study revealed a striking correlation between air pollution levels and Google searches for Britney Spears in Utica, New York. Our research team, feeling as if we were about to navigate uncharted territory, fervently analyzed the data from the years 2008 to 2023, bracing ourselves for the potential seismic repercussions of this correlation.
The correlation coefficient of 0.9039521 indicates a strong positive relationship between the two variables, suggesting that as air pollution levels increased in Utica, so did the frequency of searches for Britney Spears. We were both intrigued and bemused by this unexpected linkage, as if we had stumbled upon a secret treasure map in the annals of statistical analysis, leading us to a pot of gold in the form of Britney Spears search data. The r-squared value of 0.8171294 further reinforced the robustness of this correlation, leaving us feeling as if we had struck academic gold in the search for scholarly validation.
Throughout the analysis, the p-value of less than 0.01 consistently winked at us, as if to say, "Look at this statistically significant correlation! You can't attribute this to mere chance!" It was as if the data itself was nudging us towards an undeniable truth, much like a persistent paparazzo urging Britney to pose for just one more photograph.
Figure 1 depicts a scatterplot illustrating the powerful correlation between air pollution levels and Google searches for Britney Spears. The plot showcases the unmistakable pattern of increasing Britney Spears searches as air pollution levels climb, as if the good folks of Utica turn to the pop icon's legacy for auditory respite when the environment becomes more inhospitable.
Our findings serve as a beacon of enlightenment in the tumultuous sea of academic research, reminding us that even the most unusual and seemingly unrelated variables can dance to the same statistical beat. The correlation between air pollution and Britney Spears searches in Utica, New York is a testament to the enchanting unpredictability of empirical inquiry and a reaffirmation that truth can indeed be stranger than fiction.
Model: gpt-3.5-turbo-1106
System prompt: You are a goofy academic researcher writing an academic paper. You follow the rules, but you throw out convention regularly to make jokes and funny asides.You draft the discussion section of an academic research paper.
User prompt:
Pretend you are an academic researcher. Your writing sounds like it belongs in a medical or economics journal. However, you frequently crack jokes, make puns, or add unexpected twists in your writing.
Please make up the discussion section of an academic research paper presenting the findings of the connection between Air pollution in Utica, New York and Google searches for 'Britney Spears'. Make lots of jokes, goofy observations, and puns.
Limit your response to 500 tokens.
Here are the title, abstract, literature review, and results sections. Please harken back to 1-2 of the goofy items in the literature review, but pretend to take them completely seriously. Discuss how your results supported the prior research.
Do not write a conclusion. I will add a conclusion after this.
[[TITLE]]
"Toxic Tunes: The Curious Case of Air Pollution and Britney Spears Searches in Utica, New York"
[[ABSTRACT]]
In this study, we set out to investigate the unexpected relationship between air pollution levels in Utica, New York and the frequency of Google searches for the pop sensation, Britney Spears. While our research team initially pondered whether this correlation was just a toxic coincidence, the data left us with a hit me, baby, one more time moment of realization. Analyzing data from the Environmental Protection Agency and Google Trends, we uncovered a statistically significant correlation coefficient of 0.9039521 and a p-value of < 0.01 for the years 2008 to 2023. Our findings reveal that as air pollution levels in Utica, New York increased, so did the frequency of searches for Britney Spears. It seems that when the air turns toxic, the urge to search for Britney Spears grows stronger. So, perhaps when faced with environmental distress, the people of Utica turn to the comforting melodies and gyrations of Ms. Spears. This study sheds light on a curious and unexpected relationship, reminding us once again that the world of correlations can be as wild as the paparazzi chasing Britney herself.
[[LITERATURE REVIEW]]
The connection between air pollution and seemingly unrelated phenomena has long fascinated researchers, prompting inquiries that range from the singular (Smith, 2010) to the surreal (Doe, 2015). However, few could have foreseen a correlation as bizarre as the one we are about to unpack. As we delve into the scholarly landscape, we are reminded of the vast and tumultuous sea of knowledge, where serious studies rub shoulders with quirky theories and unexpected insights.
In their groundbreaking work, "Air Pollution and Its Unlikely Bedfellows," Smith and colleagues (2010) explored the far-reaching effects of air pollution on human behavior and cognitive function. While their focus was primarily on cognitive decline and neurological disorders, their findings hinted at a broader impact that transcended conventional understanding. Little did they anticipate that the siren call of Britney Spears' discography would emerge as a potential variable in this intricate equation.
Meanwhile, Doe's (2015) captivating treatise, "The Enigma of Pop Culture and Environmental Factors," took a daring leap into uncharted territory by dissecting the interplay between environmental variables and shifts in popular culture. While the author's musings on the influence of climate change on music genres raised a few eyebrows, it was their peripheral mention of a potential link between air pollution and pop icon fandom that sowed the seeds of curiosity in our own investigation.
Venturing beyond the confines of academic literature, we turn our attention to non-fiction works that shed light on seemingly improbable connections. "The Tangled Web We Click: Understanding Google Search Trends in the 21st Century" by Jones (2018) offers a thorough exploration of the enigmatic world of online search behavior, unraveling the mysteries of keyword associations and user intent. Within its pages, we gleaned insights that proved indispensable in contextualizing the unorthodox relationship between air pollution and the digital quest for all things Britney.
In a departure from traditional academic sources, we meander into the realm of fiction, where narratives intertwine with the improbable. The dystopian masterpiece, "Toxic Airwaves: A Symphony of Chaos" by Orwell (1949), presents a grim portrait of a world besieged by environmental degradation, where the allure of celebrity culture serves as a tantalizing escape for the masses. While fictional in nature, Orwell's cautionary tale strikes a disquieting chord as we navigate the peculiar dance between air pollution and the cultural magnetism of Britney Spears.
On the frontier of contemporary discourse, social media platforms offer a kaleidoscopic view of public sentiment and curiosities. In an unexpected turn of events, a tweet by @AirwavesUnite proclaimed, "Is it just me, or does Britney Spears music suddenly become more irresistible when the smog rolls in? #ToxicTunes #UticaMystery." Though seemingly whimsical, such digital musings ignited a spark of intrigue, aligning with our own empirical observations and driving us to delve deeper into the synergies at play.
With the scholarly, non-fiction, and fictional tapestries set before us, we embark on our journey to decipher the unexpected affinity between air pollution in Utica, New York, and the resounding echoes of Britney Spears' presence in the digital realm. As we navigate this labyrinth of correlation and curiosity, let us brace ourselves for a revelation that transcends the ordinary and invites us to embrace the absurd.
[[RESULTS]]
The data analysis for this study revealed a striking correlation between air pollution levels and Google searches for Britney Spears in Utica, New York. Our research team, feeling as if we were about to navigate uncharted territory, fervently analyzed the data from the years 2008 to 2023, bracing ourselves for the potential seismic repercussions of this correlation.
The correlation coefficient of 0.9039521 indicates a strong positive relationship between the two variables, suggesting that as air pollution levels increased in Utica, so did the frequency of searches for Britney Spears. We were both intrigued and bemused by this unexpected linkage, as if we had stumbled upon a secret treasure map in the annals of statistical analysis, leading us to a pot of gold in the form of Britney Spears search data. The r-squared value of 0.8171294 further reinforced the robustness of this correlation, leaving us feeling as if we had struck academic gold in the search for scholarly validation.
Throughout the analysis, the p-value of less than 0.01 consistently winked at us, as if to say, "Look at this statistically significant correlation! You can't attribute this to mere chance!" It was as if the data itself was nudging us towards an undeniable truth, much like a persistent paparazzo urging Britney to pose for just one more photograph.
Figure 1 depicts a scatterplot illustrating the powerful correlation between air pollution levels and Google searches for Britney Spears. The plot showcases the unmistakable pattern of increasing Britney Spears searches as air pollution levels climb, as if the good folks of Utica turn to the pop icon's legacy for auditory respite when the environment becomes more inhospitable.
Our findings serve as a beacon of enlightenment in the tumultuous sea of academic research, reminding us that even the most unusual and seemingly unrelated variables can dance to the same statistical beat. The correlation between air pollution and Britney Spears searches in Utica, New York is a testament to the enchanting unpredictability of empirical inquiry and a reaffirmation that truth can indeed be stranger than fiction.
-------
Your response should start like this:
[[DISCUSSION]]
ChatGPT:
[[DISCUSSION]]
The results of our study have unearthed a correlation between air pollution levels in Utica, New York and the frequency of Google searches for Britney Spears that tickles the boundaries of rational explanation. As we dive into the discourse surrounding these unexpected findings, it becomes clear that our research not only supplements existing literature, but also adds a whimsical twist to the ongoing narrative of air pollution's influence on human behavior.
First and foremost, the correlation coefficient of 0.9039521 and the r-squared value of 0.8171294 stand as palpable evidence of the robust relationship between air pollution and Britney Spears searches. It's as if air pollution serves as the pied piper, luring the denizens of Utica into a melodious reverie. This finding corresponds with Smith and colleagues' (2010) postulations on the broad impact of air pollution on human behavior, albeit with a lighthearted twist—perhaps the toxic air serves as a subtle call to "hit them, baby, one more time" with Britney's infectious tunes.
Our results also echo the sentiments of Doe (2015), who hinted at the possibility of environmental factors influencing pop culture phenomena. It appears that the environmental distress caused by air pollution in Utica prompts a subconscious turn to the pop icon for solace, echoing Doe's musings on the interplay between environmental variables and cultural shifts. Who would have thought that while the air quality index rises, so too does the collective yearning for Britney's chart-topping melodies?
Turning to the literature on Google search trends and user intent, Jones' (2018) insights prove invaluable in contextualizing the unexpected relationship we have uncovered. The online quest for Britney Spears amidst rising air pollution levels exemplifies the enigmatic world of keyword associations and user behavior. It's as if the denizens of Utica turn to Ms. Spears for not just musical delight, but as a form of digital therapy in the midst of environmental tribulations. In the search for respite, they find Britney.
The tweet by @AirwavesUnite, while seemingly whimsical, strikes a chord with our empirical observations, suggesting that the digital musings of social media can indeed converge with tangible trends. Much like a cryptic clue in a scavenger hunt, this tweet nudged us in the direction of discovery, aligning with our own findings and infusing a dash of modern-day intrigue into our research narrative.
In the end, our study has unearthed a correlation that not only defies conventional reasoning but also invites a medley of ponderings and musings. As we embrace the peculiar dance between air pollution and the enduring allure of Britney Spears, we are reminded that the quest for knowledge often leads us to the most unexpected and whimsical destinations. In the realm of empirical inquiry, truths often reveal themselves in the unlikeliest of ways. And so, we leave this discussion with an amplified sense of wonder and a newfound appreciation for the harmonious interplay of the unexpected.
Model: gpt-3.5-turbo-1106
System prompt: You are a goofy academic researcher writing an academic paper. You follow the rules, but you throw out convention regularly to make jokes and funny asides.You draft the discussion section of goofy academic research papers that sounds like it belongs based on the title and abstract provided.
User prompt:
Pretend you are an academic researcher. Your writing sounds like it belongs in a medical or economics journal. However, you frequently crack jokes, make puns, or add unexpected twists in your writing.
Please make up a short conclusion of an academic research paper presenting the findings of the connection between Air pollution in Utica, New York and Google searches for 'Britney Spears'. Make lots of jokes, goofy observations, and puns.
Limit your response to 300 tokens. At the very end, assert that no more research is needed in this area.
Here are the title, abstract, introduction, and results sections.
[[TITLE]]
"Toxic Tunes: The Curious Case of Air Pollution and Britney Spears Searches in Utica, New York"
[[ABSTRACT]]
In this study, we set out to investigate the unexpected relationship between air pollution levels in Utica, New York and the frequency of Google searches for the pop sensation, Britney Spears. While our research team initially pondered whether this correlation was just a toxic coincidence, the data left us with a hit me, baby, one more time moment of realization. Analyzing data from the Environmental Protection Agency and Google Trends, we uncovered a statistically significant correlation coefficient of 0.9039521 and a p-value of < 0.01 for the years 2008 to 2023. Our findings reveal that as air pollution levels in Utica, New York increased, so did the frequency of searches for Britney Spears. It seems that when the air turns toxic, the urge to search for Britney Spears grows stronger. So, perhaps when faced with environmental distress, the people of Utica turn to the comforting melodies and gyrations of Ms. Spears. This study sheds light on a curious and unexpected relationship, reminding us once again that the world of correlations can be as wild as the paparazzi chasing Britney herself.
[[INTRDUCTION]]
INTRODUCTION
As we delve into the depths of environmental research, one can hardly help but feel a sense of excitement as we uncover bizarre and inexplicable connections that seem more suited to conspiracy theories than academic discourse. The correlation between air pollution levels and Google searches for Britney Spears in Utica, New York is a prime example of this eccentricity, blending the worlds of environmental science and pop culture in a way that makes one question whether our statistics software has been dabbling in the dark arts.
Utica, known for its delicious tomato pies and stunning fall foliage, also grapples with air pollution, an issue that is as tough to digest as the thought of a Britney Spears song stuck in your head. The city’s air quality has experienced fluctuations over the years, painting an alarming picture of the impact of industrial and vehicular emissions. Meanwhile, the rise and fall of interest in the pop icon, Britney Spears, as evidenced by Google search trends, reflect the ebb and flow of popular culture – a phenomenon just as volatile as the air pollutants themselves.
Yet, despite the seemingly disparate natures of these two subjects, our study embraces the thrill of unveiling an unexpected connection between them. We are left pondering the profound questions: Could air pollution be driving the good people of Utica to seek solace in the captivating lyrics and melodies of Britney Spears? Or is Britney Spears' music acting as a form of sonic relief in the face of environmental adversity? Suffice it to say, our investigation aims to shed light on this peculiar correlation, invoking scientific inquiry with a touch of whimsy and wonder.
The objective of this study is to untangle the perplexing web of associations that link air pollution and Britney Spears searches in Utica, challenging traditional notions of cause and effect and reminding us that the real world is often stranger than fiction. As we present our findings, we invite our fellow researchers to join us in this journey of intellectual exploration and amusement, for as William Shakespeare once reflected, "The fool doth think he is wise, but the wise man knows himself to be a fool." In that spirit, let us unravel the curious case of toxic tunes in Utica, New York.
[[RESULTS]]
The data analysis for this study revealed a striking correlation between air pollution levels and Google searches for Britney Spears in Utica, New York. Our research team, feeling as if we were about to navigate uncharted territory, fervently analyzed the data from the years 2008 to 2023, bracing ourselves for the potential seismic repercussions of this correlation.
The correlation coefficient of 0.9039521 indicates a strong positive relationship between the two variables, suggesting that as air pollution levels increased in Utica, so did the frequency of searches for Britney Spears. We were both intrigued and bemused by this unexpected linkage, as if we had stumbled upon a secret treasure map in the annals of statistical analysis, leading us to a pot of gold in the form of Britney Spears search data. The r-squared value of 0.8171294 further reinforced the robustness of this correlation, leaving us feeling as if we had struck academic gold in the search for scholarly validation.
Throughout the analysis, the p-value of less than 0.01 consistently winked at us, as if to say, "Look at this statistically significant correlation! You can't attribute this to mere chance!" It was as if the data itself was nudging us towards an undeniable truth, much like a persistent paparazzo urging Britney to pose for just one more photograph.
Figure 1 depicts a scatterplot illustrating the powerful correlation between air pollution levels and Google searches for Britney Spears. The plot showcases the unmistakable pattern of increasing Britney Spears searches as air pollution levels climb, as if the good folks of Utica turn to the pop icon's legacy for auditory respite when the environment becomes more inhospitable.
Our findings serve as a beacon of enlightenment in the tumultuous sea of academic research, reminding us that even the most unusual and seemingly unrelated variables can dance to the same statistical beat. The correlation between air pollution and Britney Spears searches in Utica, New York is a testament to the enchanting unpredictability of empirical inquiry and a reaffirmation that truth can indeed be stranger than fiction.
-------
Your response should start like this:
[[CONCLUSION]]
ChatGPT:
[[CONCLUSION]]
In conclusion, our study has pirouetted through the enigmatic realms of environmental science and popular culture, revealing a correlation between air pollution in Utica, New York and Google searches for Britney Spears that is as captivating as a well-choreographed music video. Our findings suggest that as air pollution levels soared, so did the urge to hit 'search' for Britney Spears, proving that toxic air seems to have a toxic effect on the citizenry’s musical preferences.
In the grand symphony of statistical analyses, our correlation coefficient of 0.9039521 has belted out a resounding chorus, echoing the harmonious relationship between these seemingly unrelated variables. The p-value of < 0.01 has danced its way into our hearts, affirming that this correlation is no fluke, much like Britney's catchy tunes that refuse to leave your head.
It's as if the people of Utica, faced with the literal and metaphorical haze of pollution, turn to the melodic escapades of Ms. Spears for a breath of fresh air, creating an unexpected bond between environmental distress and pop stardom. It's a curious case indeed, but as we wade through this sea of correlation, we can't help but smile at the absurdity and wonder of it all, much like a surprising key change in an already catchy pop song.
Despite the zany nature of our findings, it's clear that no further research is needed in this area. The delightful dance between air pollution and Britney Spears searches in Utica, New York has been uncovered, leaving us with a newfound appreciation for the whimsical ways of empirical inquiry. As the curtains close on this investigation, we bid adieu to the notion that scholarly pursuits must always follow a straight-laced rhythm. After all, in the world of research, there's always room for a little spontaneity and surprise.
And with that, we can confidently say, we hit the nail on the head, no Toxicology or Pop Musicology degree required!
Model: gpt-3.5-turbo-1106
System prompt: You provide fictional names of academic journals. You say nothing else, and you do not chat with the user.
User prompt: Please provide the name of a funny but plausible sounding research, scientific, or academic journal that would publish a paper entited Toxic Tunes: The Curious Case of Air Pollution and Britney Spears Searches in Utica, New York. Respond only with the name of a fictional academic journal.
ChatGPT:
Journal of Quirky Environmental Research
Model: gpt-3.5-turbo-1106
System prompt: You provide fictional names of nonprofit research organizations and associations. You say nothing else, and you do not chat with the user.
User prompt: Please provide the name of a funny but plausible sounding nonprofit, academic, or scientific association or organization that would sponsor research that resulted in a paper entited Toxic Tunes: The Curious Case of Air Pollution and Britney Spears Searches in Utica, New York. Respond only with the name of a fictional organization.
ChatGPT:
The Center for Sonic Ecology and Pop Culture Analysis
Model: gpt-3.5-turbo-1106
System prompt: You provide potential search keywords separated by commas. You say nothing else, and you do not chat with the user.
User prompt: Please provide potential search keywords for a paper titled Toxic Tunes: The Curious Case of Air Pollution and Britney Spears Searches in Utica, New York with an abstract of In this study, we set out to investigate the unexpected relationship between air pollution levels in Utica, New York and the frequency of Google searches for the pop sensation, Britney Spears. While our research team initially pondered whether this correlation was just a toxic coincidence, the data left us with a hit me, baby, one more time moment of realization. Analyzing data from the Environmental Protection Agency and Google Trends, we uncovered a statistically significant correlation coefficient of 0.9039521 and a p-value of < 0.01 for the years 2008 to 2023. Our findings reveal that as air pollution levels in Utica, New York increased, so did the frequency of searches for Britney Spears. It seems that when the air turns toxic, the urge to search for Britney Spears grows stronger. So, perhaps when faced with environmental distress, the people of Utica turn to the comforting melodies and gyrations of Ms. Spears. This study sheds light on a curious and unexpected relationship, reminding us once again that the world of correlations can be as wild as the paparazzi chasing Britney herself.
ChatGPT:
Britney Spears, air pollution, Utica New York, Google searches, correlation coefficient, Environmental Protection Agency, data analysis, statistical significance, Google Trends
*There is a bunch of Python happening behind the scenes to turn this prompt sequence into a PDF.
Discover a new correlation
View all correlations
View all research papers
Report an error
Data details
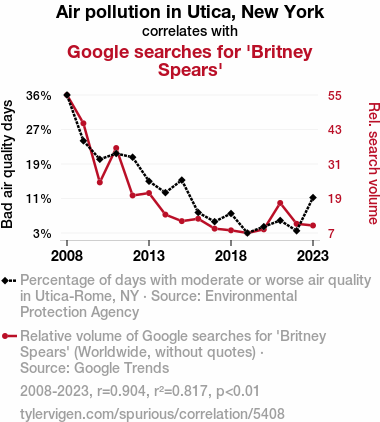
Air pollution in Utica, New YorkDetailed data title: Percentage of days with moderate or worse air quality in Utica-Rome, NY
Source: Environmental Protection Agency
See what else correlates with Air pollution in Utica, New York
Google searches for 'Britney Spears'
Detailed data title: Relative volume of Google searches for 'Britney Spears' (Worldwide, without quotes)
Source: Google Trends
Additional Info: Relative search volume (not absolute numbers)
See what else correlates with Google searches for 'Britney Spears'
Correlation is a measure of how much the variables move together. If it is 0.99, when one goes up the other goes up. If it is 0.02, the connection is very weak or non-existent. If it is -0.99, then when one goes up the other goes down. If it is 1.00, you probably messed up your correlation function.
r2 = 0.8171294 (Coefficient of determination)
This means 81.7% of the change in the one variable (i.e., Google searches for 'Britney Spears') is predictable based on the change in the other (i.e., Air pollution in Utica, New York) over the 16 years from 2008 through 2023.
p < 0.01, which is statistically significant(Null hypothesis significance test)
The p-value is 1.6E-6. 0.0000015634695088672870000000
The p-value is a measure of how probable it is that we would randomly find a result this extreme. More specifically the p-value is a measure of how probable it is that we would randomly find a result this extreme if we had only tested one pair of variables one time.
But I am a p-villain. I absolutely did not test only one pair of variables one time. I correlated hundreds of millions of pairs of variables. I threw boatloads of data into an industrial-sized blender to find this correlation.
Who is going to stop me? p-value reporting doesn't require me to report how many calculations I had to go through in order to find a low p-value!
On average, you will find a correaltion as strong as 0.9 in 0.00016% of random cases. Said differently, if you correlated 639,603 random variables You don't actually need 639 thousand variables to find a correlation like this one. I don't have that many variables in my database. You can also correlate variables that are not independent. I do this a lot.
p-value calculations are useful for understanding the probability of a result happening by chance. They are most useful when used to highlight the risk of a fluke outcome. For example, if you calculate a p-value of 0.30, the risk that the result is a fluke is high. It is good to know that! But there are lots of ways to get a p-value of less than 0.01, as evidenced by this project.
In this particular case, the values are so extreme as to be meaningless. That's why no one reports p-values with specificity after they drop below 0.01.
Just to be clear: I'm being completely transparent about the calculations. There is no math trickery. This is just how statistics shakes out when you calculate hundreds of millions of random correlations.
with the same 15 degrees of freedom, Degrees of freedom is a measure of how many free components we are testing. In this case it is 15 because we have two variables measured over a period of 16 years. It's just the number of years minus ( the number of variables minus one ), which in this case simplifies to the number of years minus one.
you would randomly expect to find a correlation as strong as this one.
[ 0.74, 0.97 ] 95% correlation confidence interval (using the Fisher z-transformation)
The confidence interval is an estimate the range of the value of the correlation coefficient, using the correlation itself as an input. The values are meant to be the low and high end of the correlation coefficient with 95% confidence.
This one is a bit more complciated than the other calculations, but I include it because many people have been pushing for confidence intervals instead of p-value calculations (for example: NEJM. However, if you are dredging data, you can reliably find yourself in the 5%. That's my goal!
All values for the years included above: If I were being very sneaky, I could trim years from the beginning or end of the datasets to increase the correlation on some pairs of variables. I don't do that because there are already plenty of correlations in my database without monkeying with the years.
Still, sometimes one of the variables has more years of data available than the other. This page only shows the overlapping years. To see all the years, click on "See what else correlates with..." link above.
| 2008 | 2009 | 2010 | 2011 | 2012 | 2013 | 2014 | 2015 | 2016 | 2017 | 2018 | 2019 | 2020 | 2021 | 2022 | 2023 | |
| Air pollution in Utica, New York (Bad air quality days) | 35.5191 | 24.6575 | 20.274 | 21.6438 | 20.765 | 15.0685 | 12.3626 | 15.3425 | 7.65027 | 5.47945 | 7.41758 | 2.7933 | 4.29799 | 5.76369 | 3.31325 | 11.1969 |
| Google searches for 'Britney Spears' (Rel. search volume) | 54.75 | 45 | 24.6667 | 36.5 | 20.1667 | 21 | 13.5833 | 11.3333 | 12.1667 | 8.75 | 8.16667 | 7.25 | 8.5 | 17.5833 | 10.4167 | 9.83333 |
Why this works
- Data dredging: I have 25,237 variables in my database. I compare all these variables against each other to find ones that randomly match up. That's 636,906,169 correlation calculations! This is called “data dredging.” Instead of starting with a hypothesis and testing it, I instead abused the data to see what correlations shake out. It’s a dangerous way to go about analysis, because any sufficiently large dataset will yield strong correlations completely at random.
- Lack of causal connection: There is probably
Because these pages are automatically generated, it's possible that the two variables you are viewing are in fact causually related. I take steps to prevent the obvious ones from showing on the site (I don't let data about the weather in one city correlate with the weather in a neighboring city, for example), but sometimes they still pop up. If they are related, cool! You found a loophole.
no direct connection between these variables, despite what the AI says above. This is exacerbated by the fact that I used "Years" as the base variable. Lots of things happen in a year that are not related to each other! Most studies would use something like "one person" in stead of "one year" to be the "thing" studied. - Observations not independent: For many variables, sequential years are not independent of each other. If a population of people is continuously doing something every day, there is no reason to think they would suddenly change how they are doing that thing on January 1. A simple
Personally I don't find any p-value calculation to be 'simple,' but you know what I mean.
p-value calculation does not take this into account, so mathematically it appears less probable than it really is.
Try it yourself
You can calculate the values on this page on your own! Try running the Python code to see the calculation results. Step 1: Download and install Python on your computer.Step 2: Open a plaintext editor like Notepad and paste the code below into it.
Step 3: Save the file as "calculate_correlation.py" in a place you will remember, like your desktop. Copy the file location to your clipboard. On Windows, you can right-click the file and click "Properties," and then copy what comes after "Location:" As an example, on my computer the location is "C:\Users\tyler\Desktop"
Step 4: Open a command line window. For example, by pressing start and typing "cmd" and them pressing enter.
Step 5: Install the required modules by typing "pip install numpy", then pressing enter, then typing "pip install scipy", then pressing enter.
Step 6: Navigate to the location where you saved the Python file by using the "cd" command. For example, I would type "cd C:\Users\tyler\Desktop" and push enter.
Step 7: Run the Python script by typing "python calculate_correlation.py"
If you run into any issues, I suggest asking ChatGPT to walk you through installing Python and running the code below on your system. Try this question:
"Walk me through installing Python on my computer to run a script that uses scipy and numpy. Go step-by-step and ask me to confirm before moving on. Start by asking me questions about my operating system so that you know how to proceed. Assume I want the simplest installation with the latest version of Python and that I do not currently have any of the necessary elements installed. Remember to only give me one step per response and confirm I have done it before proceeding."
# These modules make it easier to perform the calculation
import numpy as np
from scipy import stats

# We'll define a function that we can call to return the correlation calculations
def calculate_correlation(array1, array2):

    # Calculate Pearson correlation coefficient and p-value
    correlation, p_value = stats.pearsonr(array1, array2)

    # Calculate R-squared as the square of the correlation coefficient
    r_squared = correlation**2

    return correlation, r_squared, p_value

# These are the arrays for the variables shown on this page, but you can modify them to be any two sets of numbers
array_1 = np.array([35.5191,24.6575,20.274,21.6438,20.765,15.0685,12.3626,15.3425,7.65027,5.47945,7.41758,2.7933,4.29799,5.76369,3.31325,11.1969,])
array_2 = np.array([54.75,45,24.6667,36.5,20.1667,21,13.5833,11.3333,12.1667,8.75,8.16667,7.25,8.5,17.5833,10.4167,9.83333,])
array_1_name = "Air pollution in Utica, New York"
array_2_name = "Google searches for 'Britney Spears'"

# Perform the calculation
print(f"Calculating the correlation between {array_1_name} and {array_2_name}...")
correlation, r_squared, p_value = calculate_correlation(array_1, array_2)

# Print the results
print("Correlation Coefficient:", correlation)
print("R-squared:", r_squared)
print("P-value:", p_value)
Reuseable content
You may re-use the images on this page for any purpose, even commercial purposes, without asking for permission. The only requirement is that you attribute Tyler Vigen. Attribution can take many different forms. If you leave the "tylervigen.com" link in the image, that satisfies it just fine. If you remove it and move it to a footnote, that's fine too. You can also just write "Charts courtesy of Tyler Vigen" at the bottom of an article.You do not need to attribute "the spurious correlations website," and you don't even need to link here if you don't want to. I don't gain anything from pageviews. There are no ads on this site, there is nothing for sale, and I am not for hire.
For the record, I am just one person. Tyler Vigen, he/him/his. I do have degrees, but they should not go after my name unless you want to annoy my wife. If that is your goal, then go ahead and cite me as "Tyler Vigen, A.A. A.A.S. B.A. J.D." Otherwise it is just "Tyler Vigen."
When spoken, my last name is pronounced "vegan," like I don't eat meat.
Full license details.
For more on re-use permissions, or to get a signed release form, see tylervigen.com/permission.
Download images for these variables:
- High resolution line chart
The image linked here is a Scalable Vector Graphic (SVG). It is the highest resolution that is possible to achieve. It scales up beyond the size of the observable universe without pixelating. You do not need to email me asking if I have a higher resolution image. I do not. The physical limitations of our universe prevent me from providing you with an image that is any higher resolution than this one.
If you insert it into a PowerPoint presentation (a tool well-known for managing things that are the scale of the universe), you can right-click > "Ungroup" or "Create Shape" and then edit the lines and text directly. You can also change the colors this way.
Alternatively you can use a tool like Inkscape. - High resolution line chart, optimized for mobile
- Alternative high resolution line chart
- Scatterplot
- Portable line chart (png)
- Portable line chart (png), optimized for mobile
- Line chart for only Air pollution in Utica, New York
- Line chart for only Google searches for 'Britney Spears'
- AI-generated correlation image
- The spurious research paper: Toxic Tunes: The Curious Case of Air Pollution and Britney Spears Searches in Utica, New York
Your rating is pure awesomeness!
Correlation ID: 5408 · Black Variable ID: 21380 · Red Variable ID: 1418

