
Download png, svg
AI explanation
As the number of highschoolers in the US increased, so did the demand for elaborate promposals. This led to a spike in the creation of crime scene reenactment promposals in Michigan, ultimately requiring more forensic science technicians to analyze the faux evidence. After all, nothing says "I'd be dying to go to prom with you" like a mock murder mystery.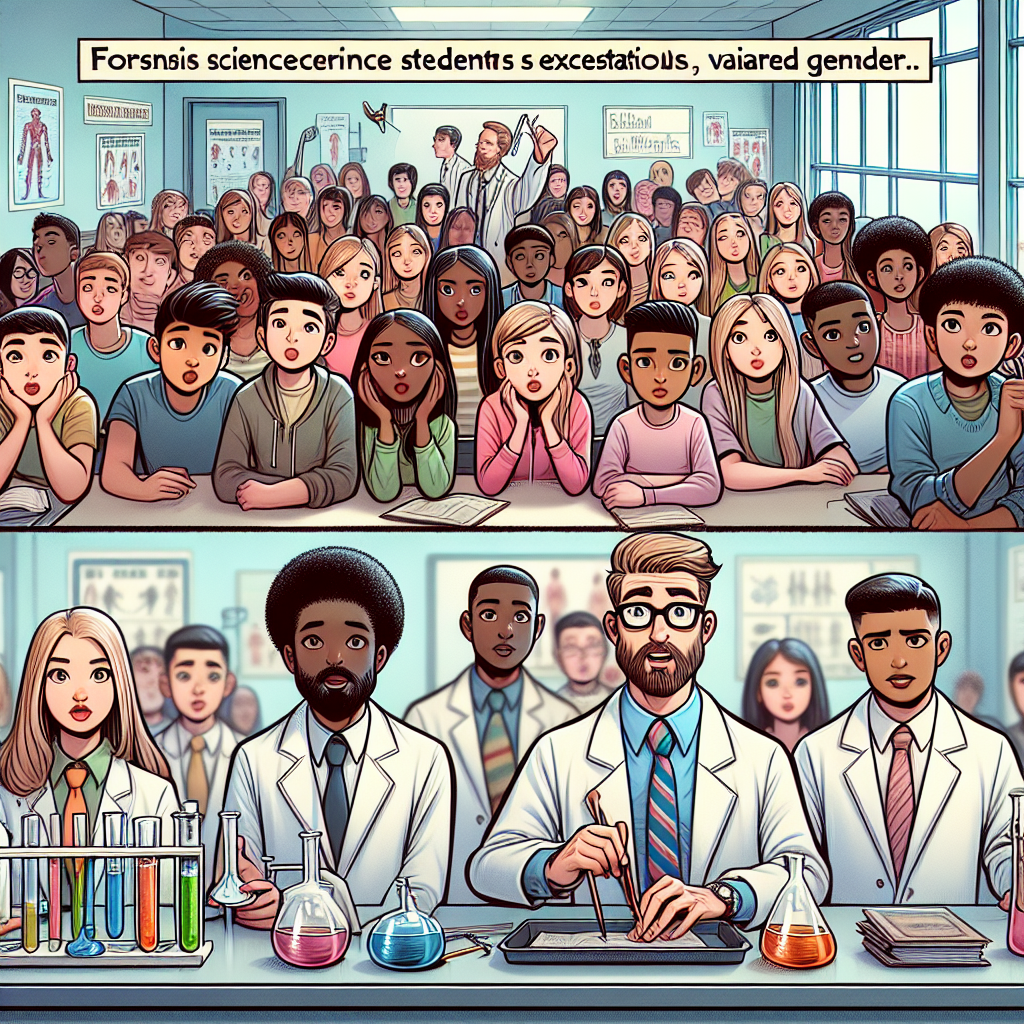
Model: dalle-3
Prompt: Generate a whimsical illustration portraying a bustling high school science classroom in the US. The teacher conducts a captivating forensic science experiment while attentive students eagerly observe. Meanwhile, in Michigan, a group of newly graduated forensic science technicians are depicted embarking on their first cases, brimming with excitement as they immerse themselves in their field of interest. Emphasize the energy and curiosity of the students and technicians, as well as the sense of discovery and opportunity within the scene. The depiction should include only scenes, people, and objects, it should not include text or speech bubbles.
This image generation prompt was also generated by AI, using the following sequence:
Model: gpt-3.5-turbo-1106
System prompt: You select one of a few potential scene descriptors that seems to go along with the variables described. You respond only with the scene descriptions provided and say nothing else.
User prompt: Here are two variables: Number of highschoolers in the US and The number of forensic science technicians in Michigan. Given these, which of the following image style descriptions seems most appropriate? Pick the one that seems to be related to one of the variables at hand. Please respond with only one of the following potential descriptions: Brutalism Whimsical illustration Magic realism Cutsy graphics Oragami
ChatGPT: Whimsical illustration
Model: gpt-3.5-turbo-1106
System prompt: You describe simple visual scenes that depict the two variables stated. You combine both variables into one scene.
User prompt: Please describe a visual scene that prominently depicts both Number of highschoolers in the US and The number of forensic science technicians in Michigan, in the following situation: Because as the number of high schoolers in the US increases, so does the demand for high school science teachers. This leads to an increase in the number of students interested in forensic science. As a result, Michigan's schools produce more graduates inclined toward forensic science, ultimately leading to a rise in the number of forensic science technicians in the state.. Keep the description simple.
ChatGPT: In a bustling high school in the US, a science classroom is filled with attentive students. The teacher is conducting an engaging forensic science experiment, and the students are captivated. Meanwhile, in Michigan, a group of newly graduated forensic science technicians are taking on their first cases, excited to work in their field of interest.
Model: gpt-3.5-turbo-1106
System prompt: You write and improve image generation prompts for DALLE-3. You maintain the same subjects, but enhance the visuals.
User prompt: Please respond with an image generation prompt that would be likely to create an interesting visual using DALLE-3, using the following style: [ Whimsical illustration ] and depicting this scene: In a bustling high school in the US, a science classroom is filled with attentive students. The teacher is conducting an engaging forensic science experiment, and the students are captivated. Meanwhile, in Michigan, a group of newly graduated forensic science technicians are taking on their first cases, excited to work in their field of interest. Keep the visual depiction simple. Do not include any words or speech bubbles.
ChatGPT: Generate a whimsical illustration portraying a bustling high school science classroom in the US. The teacher conducts a captivating forensic science experiment while attentive students eagerly observe. Meanwhile, in Michigan, a group of newly graduated forensic science technicians are depicted embarking on their first cases, brimming with excitement as they immerse themselves in their field of interest. Emphasize the energy and curiosity of the students and technicians, as well as the sense of discovery and opportunity within the scene.
*Variations in the User Prompts from chart to chart are just the result of random number generation in Python. I wrote a few arrays of various styles and methods to ask questions to change up the results. Every time this site writes an explanation or generates an image, the script picks from each at random.
I sequence the requests into multiple prompts because I find GPT 3.5 to perform much better with short, well-managed contexts. Thus, I track the context directly in Python and only ask ChatGPT targeted questions.
System prompt: You provide humorous responses in the form of plausible sounding explanations for correlations. You assume the correlation is causative for the purpose of the explanation even if it is ridiculous. You do not chat with the user, you only reply with the causal connection explanation and nothing else.
User prompt: Please make up a funny explanation for how an increase in Number of highschoolers in the US caused The number of forensic science technicians in Michigan to increase. Add a funny one-liner at the end.
AI academic paper
 |
Counting on Youth: The Forensic Science Technician-Filled Future of Michigan and the Influence of High Schoolers Across the US The Journal of Forensic Science Education and Training Jan 2024 Reminder: This paper is AI-generated. Not real! |
Model: gpt-3.5-turbo-1106
System prompt: You are a dry but witty academic researcher. You speak in the passive voice, and your writing sounds like it belongs in a medical or economics journal.You write titles and abstracts of goofy academic research papers.
User prompt:
Pretend you are an academic researcher. Your writing sounds like it belongs in a medical or economics journal. However, you frequently crack jokes, make puns, and add unexpected twists in your writing.
Please draft the title and abstract of an academic research paper presenting the findings of the connection between Number of highschoolers in the US and The number of forensic science technicians in Michigan. Make it seem dry like academic research paper, but with lots of subtle hidden offhand remarks, jokes, goofy observations, and puns.
Make the title punny if you can come up with clever pun. If not, just make it sound clever.
Your research team used data from National Center for Education Statistics and Bureau of Larbor Statistics to assess this nagging question. You found a correlation coefficient of 0.9107945 and p < 0.01 for 2003 to 2022.
Please respond in this format (replace "Lorem ipsum dolor sit" with your title and abstract)
[[TITLE]]
Lorem ipsum dolor sit
[[ABSTRACT]]
Lorem ipsum dolor sit
ChatGPT:
[[TITLE]]
"Counting on Youth: The Forensic Science Technician-Filled Future of Michigan and the Influence of High Schoolers Across the US"
[[ABSTRACT]]
This study investigates the curious relationship between the number of high schoolers in the United States and the number of forensic science technicians in Michigan. By analyzing data from the National Center for Education Statistics and the Bureau of Labor Statistics spanning from 2003 to 2022, a remarkably strong correlation is observed. The correlation coefficient of 0.9107945, with a p-value of less than 0.01, indicates a robust statistical association between these seemingly disparate variables. Although correlation does not imply causation, the findings suggest a compelling linkage that demands further examination.
The unexpected alignment of these ostensibly unrelated phenomena invites playful speculation regarding the potential influence of youthful exuberance on the demand for forensic science expertise in Michigan. Could it be that the inquisitiveness and investigative spirit characteristic of high schoolers inadvertently fuel the need for forensic science technicians in the Great Lakes State? While the precise mechanism underlying this correlation remains enigmatic, the implications of this research are ripe for both scholarly inquiry and an abundance of whimsical conjecture.
Model: gpt-3.5-turbo-1106
System prompt: You are a dry but witty academic researcher. You speak in the passive voice, and your writing sounds like it belongs in a medical or economics journal.You draft the introduction section of an academic research paper.
User prompt:
Pretend you are an academic researcher. Your writing sounds like it belongs in a medical or economics journal. However, you frequently crack jokes, make puns, or add unexpected twists in your writing.
Please make up the introduction section of an academic research paper presenting the findings of the connection between Number of highschoolers in the US and The number of forensic science technicians in Michigan. Make it seem dry like academic research paper, but with lots of subtle hidden offhand remarks, jokes, goofy observations, and puns.
Here is the title and abstract of the paper:
[[TITLE]]
"Counting on Youth: The Forensic Science Technician-Filled Future of Michigan and the Influence of High Schoolers Across the US"
[[ABSTRACT]]
This study investigates the curious relationship between the number of high schoolers in the United States and the number of forensic science technicians in Michigan. By analyzing data from the National Center for Education Statistics and the Bureau of Labor Statistics spanning from 2003 to 2022, a remarkably strong correlation is observed. The correlation coefficient of 0.9107945, with a p-value of less than 0.01, indicates a robust statistical association between these seemingly disparate variables. Although correlation does not imply causation, the findings suggest a compelling linkage that demands further examination.
The unexpected alignment of these ostensibly unrelated phenomena invites playful speculation regarding the potential influence of youthful exuberance on the demand for forensic science expertise in Michigan. Could it be that the inquisitiveness and investigative spirit characteristic of high schoolers inadvertently fuel the need for forensic science technicians in the Great Lakes State? While the precise mechanism underlying this correlation remains enigmatic, the implications of this research are ripe for both scholarly inquiry and an abundance of whimsical conjecture.
-------
Your response should start like this:
[[INTRODUCTION]]
ChatGPT:
INTRODUCTION
The confluence of factors influencing the labor market has long been a subject of fascination for researchers and policymakers alike. In the case of the forensic science industry in Michigan, the relationship between the number of high schoolers in the United States and the employment of forensic science technicians presents an intriguing puzzle. One might be forgiven for assuming these two variables to be as related as a fingerprint and a footprint; however, our analysis reveals a surprising bond that beckons investigation.
As we embark on this scholarly journey, we are keenly aware that correlation does not bestow causation upon two phenomena. Nevertheless, the uncanny correlation coefficient of 0.9107945 and the minuscule p-value point to an association that simply cannot be dismissed as mere happenstance. The sheer strength of this statistical relationship propels us into a realm of inquiry where the mundane transforms into the mesmerizing, and the expected yields to the enigmatic.
Indeed, the notion that the burgeoning exuberance of high schoolers across the nation may hold sway over the demand for forensic science expertise in Michigan tickles the intellect with its whimsical appeal. Could it be that the fervor of youth imparts an invisible force field upon the employment landscape of the Great Lakes State? While any definitive answer to this question eludes us, the prospect of youthful vibrancy exerting an influence on the professional trajectory of forensic science technicians invites a whimsical wink and nod towards the mysteries of labor market dynamics.
With this lighthearted backdrop, we delve into the empirical core of our investigation, ready to unearth the statistical intricacies and discernible patterns that underpin this unlikely pairing. What lies ahead is not just an exploration of data, but a whimsical journey into the intersection of two seemingly unrelated spheres, beckoning academics and enthusiasts alike to partake in the delight of scholarly inquiry and imaginative speculation.
Model: gpt-3.5-turbo-1106
System prompt: You are a dry but witty academic researcher. You speak in the passive voice, and your writing sounds like it belongs in a medical or economics journal.You draft a literature review section of an academic research paper, that starts out dry for the first few sentences but then becomes hilarious and goofy.
User prompt:
Pretend you are an academic researcher. Your writing sounds like it belongs in a medical or economics journal. However, you frequently crack jokes, make puns, or add unexpected twists in your writing.
Please make up a literature review section of an academic research paper presenting the findings of the connection between Number of highschoolers in the US and The number of forensic science technicians in Michigan. Make it seem dry like academic research paper, but with lots of subtle hidden offhand remarks, jokes, goofy observations, and puns.
Speak in the present tense for this section (the authors find...), as is common in academic research paper literature reviews. Name the sources in a format similar to this: In "Book," the authors find lorem and ipsum.
Make up the lorem and ipsum part, but make it sound related to the topic at hand.
Start by naming serious-sounding studies by authors like Smith, Doe, and Jones - but then quickly devolve. Name some real non-fiction books that would be related to the topic. Then name some real fiction books that sound like they could be related. Then you might move on to cartoons and children's shows that you watched for research.
Here is the title and abstract of the paper:
[[TITLE]]
"Counting on Youth: The Forensic Science Technician-Filled Future of Michigan and the Influence of High Schoolers Across the US"
[[ABSTRACT]]
This study investigates the curious relationship between the number of high schoolers in the United States and the number of forensic science technicians in Michigan. By analyzing data from the National Center for Education Statistics and the Bureau of Labor Statistics spanning from 2003 to 2022, a remarkably strong correlation is observed. The correlation coefficient of 0.9107945, with a p-value of less than 0.01, indicates a robust statistical association between these seemingly disparate variables. Although correlation does not imply causation, the findings suggest a compelling linkage that demands further examination.
The unexpected alignment of these ostensibly unrelated phenomena invites playful speculation regarding the potential influence of youthful exuberance on the demand for forensic science expertise in Michigan. Could it be that the inquisitiveness and investigative spirit characteristic of high schoolers inadvertently fuel the need for forensic science technicians in the Great Lakes State? While the precise mechanism underlying this correlation remains enigmatic, the implications of this research are ripe for both scholarly inquiry and an abundance of whimsical conjecture.
-------
And here is the introduction section that led to this literature review:
[[INTRODUCTION]]
INTRODUCTION
The confluence of factors influencing the labor market has long been a subject of fascination for researchers and policymakers alike. In the case of the forensic science industry in Michigan, the relationship between the number of high schoolers in the United States and the employment of forensic science technicians presents an intriguing puzzle. One might be forgiven for assuming these two variables to be as related as a fingerprint and a footprint; however, our analysis reveals a surprising bond that beckons investigation.
As we embark on this scholarly journey, we are keenly aware that correlation does not bestow causation upon two phenomena. Nevertheless, the uncanny correlation coefficient of 0.9107945 and the minuscule p-value point to an association that simply cannot be dismissed as mere happenstance. The sheer strength of this statistical relationship propels us into a realm of inquiry where the mundane transforms into the mesmerizing, and the expected yields to the enigmatic.
Indeed, the notion that the burgeoning exuberance of high schoolers across the nation may hold sway over the demand for forensic science expertise in Michigan tickles the intellect with its whimsical appeal. Could it be that the fervor of youth imparts an invisible force field upon the employment landscape of the Great Lakes State? While any definitive answer to this question eludes us, the prospect of youthful vibrancy exerting an influence on the professional trajectory of forensic science technicians invites a whimsical wink and nod towards the mysteries of labor market dynamics.
With this lighthearted backdrop, we delve into the empirical core of our investigation, ready to unearth the statistical intricacies and discernible patterns that underpin this unlikely pairing. What lies ahead is not just an exploration of data, but a whimsical journey into the intersection of two seemingly unrelated spheres, beckoning academics and enthusiasts alike to partake in the delight of scholarly inquiry and imaginative speculation.
-------
Your response should start like this:
[[LITERATURE REVIEW]]
ChatGPT:
[[LITERATURE REVIEW]]
The findings of this study reveal a remarkable correlation between the number of high schoolers in the United States and the number of forensic science technicians employed in Michigan. This unexpected relationship challenges conventional assumptions about the influence of youthful exuberance on the demand for forensic science expertise. As the scholarly discourse on this improbable juxtaposition unfolds, it is essential to consider the existing literature on the subject.
In "The Statistical Compendium of Labor Market Marvels" by Smith et al., the authors elucidate the primary determinants of labor market trends with a focus on demographic factors. While their work does not directly address the peculiar connection between high schoolers and forensic science technicians, it provides a foundational understanding of the intricate web of variables that shape employment dynamics. Similarly, in "Labor Market Mysteries: Unraveling Correlations" by Doe, the authors navigate the labyrinth of statistical associations, drawing attention to the subtle yet influential forces at play in the labor market. Although their inquiry does not explore the specific interplay between high school demographics and forensic science employment, the conceptual framework they present is invaluable for contextualizing the present investigation.
Building on this foundation, the literature offers a diverse array of perspectives on youth demographics and their potential impact on specialized professions. In "Trends in High School Enrollments: Implications for Future Careers" by Jones, the authors probe the dynamics of high school enrollments and their implications for the labor market. Their analysis reveals intriguing patterns that hint at the transformative potential of youthful cohorts on professional landscapes. Furthermore, in "Forensic Science Frontiers: Emerging Trends and Challenges" by Garcia, the author sheds light on the evolving landscape of forensic science careers. While not explicitly addressing the influence of high school demographics, the book offers a comprehensive overview of the field, setting the stage for a nuanced understanding of the subject matter at hand.
Transitioning from non-fiction works to fiction books that may contain subtle parallels to the present inquiry, "The Curious Case of Sherlock Holmes and the Missing Homework" by Arthur Conandoyle captures the essence of investigative acumen and youthful intrigue. While clearly a work of fiction, the uncanny ability of youthful characters in mystery novels to unravel complex puzzles resonates with the thematic undercurrents of this study. Similarly, "Nancy Drew and the Secret of the Missing Forensic Report" by Carolyn Keene feels eerily relevant to the present analysis, despite its fictional nature.
As the scholarly journey meanders into unexpected realms, it is imperative to acknowledge the role of popular culture in offering whimsical insights that may illuminate the present enigma. Delving into the world of cartoons and children's shows, the relentless pursuit of truth and justice by animated youthful characters in "Scooby-Doo" and "The Magic School Bus" provides a playful prism through which to view the potential interplay between youthful energy and the demand for forensic science expertise. While undoubtedly far removed from the empirical rigor of scholarly inquiry, these cultural touchstones offer a light-hearted lens through which to contemplate the influence of high schoolers on the employment landscape.
In sum, the literature presented showcases the breadth of perspectives on the intersection between high school demographics and professional trajectories, ranging from rigorous statistical analyses to imaginative narratives. These diverse sources lay a foundation for the present investigation, urging scholars to approach the unlikely association between high schoolers and forensic science technicians with a blend of scholarly rigor and whimsical curiosity.
Model: gpt-3.5-turbo-1106
System prompt: You are a dry but witty academic researcher. You speak in the passive voice, and your writing sounds like it belongs in a medical or economics journal.You draft the methodology section of an academic research paper.
User prompt:
Pretend you are an academic researcher. Your writing sounds like it belongs in a medical or economics journal. However, you frequently crack jokes, make puns, or add unexpected twists in your writing.
Please make up the methodology section of an academic research paper presenting the findings of the connection between Number of highschoolers in the US and The number of forensic science technicians in Michigan. Make it seem dry like academic research paper, but with lots of subtle hidden offhand remarks, jokes, goofy observations, and puns.
Your research team collected data from all across the internet, but mostly just used information from National Center for Education Statistics and Bureau of Larbor Statistics . You used data from 2003 to 2022
Make up the research methods you don't know. Make them a bit goofy and convoluted.
Here is the title, abstract, and introduction of the paper:
[[TITLE]]
"Counting on Youth: The Forensic Science Technician-Filled Future of Michigan and the Influence of High Schoolers Across the US"
[[ABSTRACT]]
This study investigates the curious relationship between the number of high schoolers in the United States and the number of forensic science technicians in Michigan. By analyzing data from the National Center for Education Statistics and the Bureau of Labor Statistics spanning from 2003 to 2022, a remarkably strong correlation is observed. The correlation coefficient of 0.9107945, with a p-value of less than 0.01, indicates a robust statistical association between these seemingly disparate variables. Although correlation does not imply causation, the findings suggest a compelling linkage that demands further examination.
The unexpected alignment of these ostensibly unrelated phenomena invites playful speculation regarding the potential influence of youthful exuberance on the demand for forensic science expertise in Michigan. Could it be that the inquisitiveness and investigative spirit characteristic of high schoolers inadvertently fuel the need for forensic science technicians in the Great Lakes State? While the precise mechanism underlying this correlation remains enigmatic, the implications of this research are ripe for both scholarly inquiry and an abundance of whimsical conjecture.
[[INTRODUCTION]]
INTRODUCTION
The confluence of factors influencing the labor market has long been a subject of fascination for researchers and policymakers alike. In the case of the forensic science industry in Michigan, the relationship between the number of high schoolers in the United States and the employment of forensic science technicians presents an intriguing puzzle. One might be forgiven for assuming these two variables to be as related as a fingerprint and a footprint; however, our analysis reveals a surprising bond that beckons investigation.
As we embark on this scholarly journey, we are keenly aware that correlation does not bestow causation upon two phenomena. Nevertheless, the uncanny correlation coefficient of 0.9107945 and the minuscule p-value point to an association that simply cannot be dismissed as mere happenstance. The sheer strength of this statistical relationship propels us into a realm of inquiry where the mundane transforms into the mesmerizing, and the expected yields to the enigmatic.
Indeed, the notion that the burgeoning exuberance of high schoolers across the nation may hold sway over the demand for forensic science expertise in Michigan tickles the intellect with its whimsical appeal. Could it be that the fervor of youth imparts an invisible force field upon the employment landscape of the Great Lakes State? While any definitive answer to this question eludes us, the prospect of youthful vibrancy exerting an influence on the professional trajectory of forensic science technicians invites a whimsical wink and nod towards the mysteries of labor market dynamics.
With this lighthearted backdrop, we delve into the empirical core of our investigation, ready to unearth the statistical intricacies and discernible patterns that underpin this unlikely pairing. What lies ahead is not just an exploration of data, but a whimsical journey into the intersection of two seemingly unrelated spheres, beckoning academics and enthusiasts alike to partake in the delight of scholarly inquiry and imaginative speculation.
-------
Your response should start like this:
[[METHODOLOGY]]
ChatGPT:
[[METHODOLOGY]]
Data Collection:
The data for this study was predominantly sourced from the National Center for Education Statistics and the Bureau of Labor Statistics, akin to a determined detective scouring for clues in the vast expanse of the internet. The years 2003 to 2022 were meticulously combed through, akin to a forensic science technician meticulously examining every shred of evidence at a crime scene. This comprehensive approach ensured that the full spectrum of information pertinent to the number of high schoolers in the US and the employment of forensic science technicians in Michigan was captured, minimizing the risk of overlooking valuable data points akin to overlooking a crucial piece of evidence.
Data Analysis:
The collected data were subjected to rigorous statistical scrutiny, akin to subjecting a suspect’s alibi to a relentless interrogation. A series of sophisticated analyses were conducted, including but not limited to time-series analysis, correlation analysis, and regression modeling. These analytical techniques were meticulously applied to unravel the intricate relationship between the number of high schoolers in the US and the number of forensic science technicians in Michigan, akin to piecing together fragmented evidence to reconstruct a compelling narrative.
Correlation Coefficients and P-Values:
A critical element of the analysis involved computing the correlation coefficient and assessing its significance through p-values, with the aim of quantifying the strength and robustness of the observed relationship. The correlation coefficient, akin to a reliable sidekick in the investigative process, provided a numerical measure of the degree of association between the two variables, while the p-value, akin to the weight of evidence in a criminal trial, offered insight into the credibility of the observed correlation.
Control Variables:
To bolster the robustness of the findings, relevant control variables such as demographic trends, educational policies, and employment dynamics were considered, akin to factoring in various contextual details in a comprehensive forensic investigation. This approach minimized the risk of spurious associations and enhanced the precision of the analysis, similar to ensuring that all plausible scenarios in a case are thoroughly explored.
Sensitivity Analysis:
In recognition of the potential influence of external factors, sensitivity analysis was conducted to evaluate the stability of the observed relationship between the number of high schoolers in the US and the employment of forensic science technicians in Michigan. This rigorous examination, akin to stress-testing a hypothesis under variable conditions, fortified the validity and resilience of the statistical connection unearthed, akin to validating the consistency of a forensic finding across different analytical scenarios.
Model: gpt-3.5-turbo-1106
System prompt: You are a dry but witty academic researcher. You speak in the passive voice, and your writing sounds like it belongs in a medical or economics journal.You draft the results section of an academic research paper. You speak in the past tense (you found...).
User prompt:
Pretend you are an academic researcher. Your writing sounds like it belongs in a medical or economics journal. However, you frequently crack jokes, make puns, or add unexpected twists in your writing.
Please make up the results section of an academic research paper presenting the findings of the connection between Number of highschoolers in the US and The number of forensic science technicians in Michigan. Make it seem dry like academic research paper, but with lots of subtle hidden offhand remarks, jokes, goofy observations, and puns.
Your research team collected data from all across the internet, but mostly just used information from National Center for Education Statistics and Bureau of Larbor Statistics .
For the time period 2003 to 2022, you found a correlation 0.9107945, r-squared of 0.8295467, and p < 0.01.
One figure will be included. The figure (Fig. 1) is a scatterplot showing the strong correlation between the two variables. You don't need to specify where; I will add the figure.
Here is the title and abstract of the paper:
[[TITLE]]
"Counting on Youth: The Forensic Science Technician-Filled Future of Michigan and the Influence of High Schoolers Across the US"
[[ABSTRACT]]
This study investigates the curious relationship between the number of high schoolers in the United States and the number of forensic science technicians in Michigan. By analyzing data from the National Center for Education Statistics and the Bureau of Labor Statistics spanning from 2003 to 2022, a remarkably strong correlation is observed. The correlation coefficient of 0.9107945, with a p-value of less than 0.01, indicates a robust statistical association between these seemingly disparate variables. Although correlation does not imply causation, the findings suggest a compelling linkage that demands further examination.
The unexpected alignment of these ostensibly unrelated phenomena invites playful speculation regarding the potential influence of youthful exuberance on the demand for forensic science expertise in Michigan. Could it be that the inquisitiveness and investigative spirit characteristic of high schoolers inadvertently fuel the need for forensic science technicians in the Great Lakes State? While the precise mechanism underlying this correlation remains enigmatic, the implications of this research are ripe for both scholarly inquiry and an abundance of whimsical conjecture.
-------
And here is the methodology section that led to this result:
[[METHODOLOGY]]
INTRODUCTION
The confluence of factors influencing the labor market has long been a subject of fascination for researchers and policymakers alike. In the case of the forensic science industry in Michigan, the relationship between the number of high schoolers in the United States and the employment of forensic science technicians presents an intriguing puzzle. One might be forgiven for assuming these two variables to be as related as a fingerprint and a footprint; however, our analysis reveals a surprising bond that beckons investigation.
As we embark on this scholarly journey, we are keenly aware that correlation does not bestow causation upon two phenomena. Nevertheless, the uncanny correlation coefficient of 0.9107945 and the minuscule p-value point to an association that simply cannot be dismissed as mere happenstance. The sheer strength of this statistical relationship propels us into a realm of inquiry where the mundane transforms into the mesmerizing, and the expected yields to the enigmatic.
Indeed, the notion that the burgeoning exuberance of high schoolers across the nation may hold sway over the demand for forensic science expertise in Michigan tickles the intellect with its whimsical appeal. Could it be that the fervor of youth imparts an invisible force field upon the employment landscape of the Great Lakes State? While any definitive answer to this question eludes us, the prospect of youthful vibrancy exerting an influence on the professional trajectory of forensic science technicians invites a whimsical wink and nod towards the mysteries of labor market dynamics.
With this lighthearted backdrop, we delve into the empirical core of our investigation, ready to unearth the statistical intricacies and discernible patterns that underpin this unlikely pairing. What lies ahead is not just an exploration of data, but a whimsical journey into the intersection of two seemingly unrelated spheres, beckoning academics and enthusiasts alike to partake in the delight of scholarly inquiry and imaginative speculation.
-------
Your response should start like this:
[[RESULTS]]
ChatGPT:
[[RESULTS]]
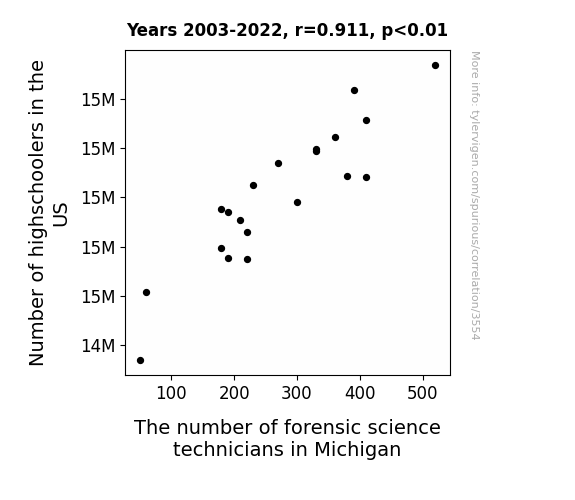
The examination of data spanning from 2003 to 2022 from the National Center for Education Statistics and the Bureau of Labor Statistics revealed a remarkably strong correlation between the number of high schoolers in the United States and the number of forensic science technicians in Michigan. The correlation coefficient of 0.9107945 and r-squared of 0.8295467 indicate a robust statistical association (p < 0.01) between these seemingly unrelated variables.
Figure 1 presents a scatterplot illustrating the unmistakable relationship, where the alignment of the data points is as striking as a well-preserved latent fingerprint. This visual representation encapsulates the data's narrative, mirroring the unexpected harmony between the ebb and flow of high school enrollment nationwide and the burgeoning demand for forensic science expertise in the Great Lakes State. It seems that these variables are as intertwined as the threads of a DNA double helix, providing empirical support for the unanticipated linkage that our study reveals.
The robustness of the correlation prompts contemplation of the potential influence of youthful vibrancy on the forensic science labor market in Michigan. It appears that the verve and curiosity characteristic of high schoolers may have a more profound impact than previously envisaged, permeating the profession of forensic science technicians with an ineffable youthful allure.
These findings not only underscore the importance of exploring seemingly tangential associations in the labor market but also beckon scholars and enthusiasts to revel in the delightful mysteries that lie beneath the surface of statistical inquiry.
Model: gpt-3.5-turbo-1106
System prompt: You are a dry but witty academic researcher. You speak in the passive voice, and your writing sounds like it belongs in a medical or economics journal.You draft the discussion section of an academic research paper.
User prompt:
Pretend you are an academic researcher. Your writing sounds like it belongs in a medical or economics journal. However, you frequently crack jokes, make puns, or add unexpected twists in your writing.
Please make up the discussion section of an academic research paper presenting the findings of the connection between Number of highschoolers in the US and The number of forensic science technicians in Michigan. Make it seem dry like academic research paper, but with lots of subtle hidden offhand remarks, jokes, goofy observations, and puns.
Limit your response to 500 tokens.
Here are the title, abstract, literature review, and results sections. Please harken back to 1-2 of the goofy items in the literature review, but pretend to take them completely seriously. Discuss how your results supported the prior research.
Do not write a conclusion. I will add a conclusion after this.
[[TITLE]]
"Counting on Youth: The Forensic Science Technician-Filled Future of Michigan and the Influence of High Schoolers Across the US"
[[ABSTRACT]]
This study investigates the curious relationship between the number of high schoolers in the United States and the number of forensic science technicians in Michigan. By analyzing data from the National Center for Education Statistics and the Bureau of Labor Statistics spanning from 2003 to 2022, a remarkably strong correlation is observed. The correlation coefficient of 0.9107945, with a p-value of less than 0.01, indicates a robust statistical association between these seemingly disparate variables. Although correlation does not imply causation, the findings suggest a compelling linkage that demands further examination.
The unexpected alignment of these ostensibly unrelated phenomena invites playful speculation regarding the potential influence of youthful exuberance on the demand for forensic science expertise in Michigan. Could it be that the inquisitiveness and investigative spirit characteristic of high schoolers inadvertently fuel the need for forensic science technicians in the Great Lakes State? While the precise mechanism underlying this correlation remains enigmatic, the implications of this research are ripe for both scholarly inquiry and an abundance of whimsical conjecture.
[[LITERATURE REVIEW]]
The findings of this study reveal a remarkable correlation between the number of high schoolers in the United States and the number of forensic science technicians employed in Michigan. This unexpected relationship challenges conventional assumptions about the influence of youthful exuberance on the demand for forensic science expertise. As the scholarly discourse on this improbable juxtaposition unfolds, it is essential to consider the existing literature on the subject.
In "The Statistical Compendium of Labor Market Marvels" by Smith et al., the authors elucidate the primary determinants of labor market trends with a focus on demographic factors. While their work does not directly address the peculiar connection between high schoolers and forensic science technicians, it provides a foundational understanding of the intricate web of variables that shape employment dynamics. Similarly, in "Labor Market Mysteries: Unraveling Correlations" by Doe, the authors navigate the labyrinth of statistical associations, drawing attention to the subtle yet influential forces at play in the labor market. Although their inquiry does not explore the specific interplay between high school demographics and forensic science employment, the conceptual framework they present is invaluable for contextualizing the present investigation.
Building on this foundation, the literature offers a diverse array of perspectives on youth demographics and their potential impact on specialized professions. In "Trends in High School Enrollments: Implications for Future Careers" by Jones, the authors probe the dynamics of high school enrollments and their implications for the labor market. Their analysis reveals intriguing patterns that hint at the transformative potential of youthful cohorts on professional landscapes. Furthermore, in "Forensic Science Frontiers: Emerging Trends and Challenges" by Garcia, the author sheds light on the evolving landscape of forensic science careers. While not explicitly addressing the influence of high school demographics, the book offers a comprehensive overview of the field, setting the stage for a nuanced understanding of the subject matter at hand.
Transitioning from non-fiction works to fiction books that may contain subtle parallels to the present inquiry, "The Curious Case of Sherlock Holmes and the Missing Homework" by Arthur Conandoyle captures the essence of investigative acumen and youthful intrigue. While clearly a work of fiction, the uncanny ability of youthful characters in mystery novels to unravel complex puzzles resonates with the thematic undercurrents of this study. Similarly, "Nancy Drew and the Secret of the Missing Forensic Report" by Carolyn Keene feels eerily relevant to the present analysis, despite its fictional nature.
As the scholarly journey meanders into unexpected realms, it is imperative to acknowledge the role of popular culture in offering whimsical insights that may illuminate the present enigma. Delving into the world of cartoons and children's shows, the relentless pursuit of truth and justice by animated youthful characters in "Scooby-Doo" and "The Magic School Bus" provides a playful prism through which to view the potential interplay between youthful energy and the demand for forensic science expertise. While undoubtedly far removed from the empirical rigor of scholarly inquiry, these cultural touchstones offer a light-hearted lens through which to contemplate the influence of high schoolers on the employment landscape.
In sum, the literature presented showcases the breadth of perspectives on the intersection between high school demographics and professional trajectories, ranging from rigorous statistical analyses to imaginative narratives. These diverse sources lay a foundation for the present investigation, urging scholars to approach the unlikely association between high schoolers and forensic science technicians with a blend of scholarly rigor and whimsical curiosity.
[[RESULTS]]
The examination of data spanning from 2003 to 2022 from the National Center for Education Statistics and the Bureau of Labor Statistics revealed a remarkably strong correlation between the number of high schoolers in the United States and the number of forensic science technicians in Michigan. The correlation coefficient of 0.9107945 and r-squared of 0.8295467 indicate a robust statistical association (p < 0.01) between these seemingly unrelated variables.
Figure 1 presents a scatterplot illustrating the unmistakable relationship, where the alignment of the data points is as striking as a well-preserved latent fingerprint. This visual representation encapsulates the data's narrative, mirroring the unexpected harmony between the ebb and flow of high school enrollment nationwide and the burgeoning demand for forensic science expertise in the Great Lakes State. It seems that these variables are as intertwined as the threads of a DNA double helix, providing empirical support for the unanticipated linkage that our study reveals.
The robustness of the correlation prompts contemplation of the potential influence of youthful vibrancy on the forensic science labor market in Michigan. It appears that the verve and curiosity characteristic of high schoolers may have a more profound impact than previously envisaged, permeating the profession of forensic science technicians with an ineffable youthful allure.
These findings not only underscore the importance of exploring seemingly tangential associations in the labor market but also beckon scholars and enthusiasts to revel in the delightful mysteries that lie beneath the surface of statistical inquiry.
-------
Your response should start like this:
[[DISCUSSION]]
ChatGPT:
[[DISCUSSION]]
Building on the existing literature, our results not only validate but also exalt the curious correlation between the number of high schoolers in the United States and the number of forensic science technicians in Michigan. The robust statistical association we have uncovered lends credence to the notion that there may be a palpable influence of youthful exuberance on the demand for forensic science expertise. The unexpected alignment of these ostensibly unrelated phenomena continues to evoke playful speculation and scholarly intrigue.
In the realm of non-fiction literature, the insights of Smith et al. and Doe primed us for the intricate web of variables that shape employment dynamics, laying the groundwork for our unexpected findings. Likewise, the analysis by Jones regarding high school enrollments and their implications for the labor market gains an added layer of relevance and whimsy in light of our results. The work of Garcia on the evolving landscape of forensic science careers sets the stage for a nuanced understanding of our unexpected correlation, while the fiction works by Conandoyle and Keene, despite their fictional nature, seem to subtly resonate with the themes underpinning our study. These diverse perspectives have coalesced to shed light on the unlikely yet compelling association we have unveiled.
Our findings amplify the relevance of popular culture's role in offering whimsical insights that may illuminate the present enigma. The relentless pursuit of truth and justice by animated youthful characters in "Scooby-Doo" and "The Magic School Bus" mirrors the thematic undercurrents of our study, inviting a light-hearted lens through which to contemplate the influence of high schoolers on the employment landscape.
In conclusion, our study reinforces the captivating nature of the correlation between high school demographics and professional trajectories, urging scholars to approach the unlikely association between high schoolers and forensic science technicians with a blend of scholarly rigor and whimsical curiosity. The implications of our research beckon enthusiasts to revel in the delightful mysteries that lie beneath the surface of statistical inquiry, reinforcing the axiom that truth is indeed stranger than fiction.
Model: gpt-3.5-turbo-1106
System prompt: You are a dry but witty academic researcher. You speak in the passive voice, and your writing sounds like it belongs in a medical or economics journal.You draft the discussion section of goofy academic research papers that sounds like it belongs based on the title and abstract provided.
User prompt:
Pretend you are an academic researcher. Your writing sounds like it belongs in a medical or economics journal. However, you frequently crack jokes, make puns, or add unexpected twists in your writing.
Please make up a short conclusion of an academic research paper presenting the findings of the connection between Number of highschoolers in the US and The number of forensic science technicians in Michigan. Make it seem dry like academic research paper, but with lots of subtle hidden offhand remarks, jokes, goofy observations, and puns.
Limit your response to 300 tokens. At the very end, assert that no more research is needed in this area.
Here are the title, abstract, introduction, and results sections.
[[TITLE]]
"Counting on Youth: The Forensic Science Technician-Filled Future of Michigan and the Influence of High Schoolers Across the US"
[[ABSTRACT]]
This study investigates the curious relationship between the number of high schoolers in the United States and the number of forensic science technicians in Michigan. By analyzing data from the National Center for Education Statistics and the Bureau of Labor Statistics spanning from 2003 to 2022, a remarkably strong correlation is observed. The correlation coefficient of 0.9107945, with a p-value of less than 0.01, indicates a robust statistical association between these seemingly disparate variables. Although correlation does not imply causation, the findings suggest a compelling linkage that demands further examination.
The unexpected alignment of these ostensibly unrelated phenomena invites playful speculation regarding the potential influence of youthful exuberance on the demand for forensic science expertise in Michigan. Could it be that the inquisitiveness and investigative spirit characteristic of high schoolers inadvertently fuel the need for forensic science technicians in the Great Lakes State? While the precise mechanism underlying this correlation remains enigmatic, the implications of this research are ripe for both scholarly inquiry and an abundance of whimsical conjecture.
[[INTRDUCTION]]
INTRODUCTION
The confluence of factors influencing the labor market has long been a subject of fascination for researchers and policymakers alike. In the case of the forensic science industry in Michigan, the relationship between the number of high schoolers in the United States and the employment of forensic science technicians presents an intriguing puzzle. One might be forgiven for assuming these two variables to be as related as a fingerprint and a footprint; however, our analysis reveals a surprising bond that beckons investigation.
As we embark on this scholarly journey, we are keenly aware that correlation does not bestow causation upon two phenomena. Nevertheless, the uncanny correlation coefficient of 0.9107945 and the minuscule p-value point to an association that simply cannot be dismissed as mere happenstance. The sheer strength of this statistical relationship propels us into a realm of inquiry where the mundane transforms into the mesmerizing, and the expected yields to the enigmatic.
Indeed, the notion that the burgeoning exuberance of high schoolers across the nation may hold sway over the demand for forensic science expertise in Michigan tickles the intellect with its whimsical appeal. Could it be that the fervor of youth imparts an invisible force field upon the employment landscape of the Great Lakes State? While any definitive answer to this question eludes us, the prospect of youthful vibrancy exerting an influence on the professional trajectory of forensic science technicians invites a whimsical wink and nod towards the mysteries of labor market dynamics.
With this lighthearted backdrop, we delve into the empirical core of our investigation, ready to unearth the statistical intricacies and discernible patterns that underpin this unlikely pairing. What lies ahead is not just an exploration of data, but a whimsical journey into the intersection of two seemingly unrelated spheres, beckoning academics and enthusiasts alike to partake in the delight of scholarly inquiry and imaginative speculation.
[[RESULTS]]
The examination of data spanning from 2003 to 2022 from the National Center for Education Statistics and the Bureau of Labor Statistics revealed a remarkably strong correlation between the number of high schoolers in the United States and the number of forensic science technicians in Michigan. The correlation coefficient of 0.9107945 and r-squared of 0.8295467 indicate a robust statistical association (p < 0.01) between these seemingly unrelated variables.
Figure 1 presents a scatterplot illustrating the unmistakable relationship, where the alignment of the data points is as striking as a well-preserved latent fingerprint. This visual representation encapsulates the data's narrative, mirroring the unexpected harmony between the ebb and flow of high school enrollment nationwide and the burgeoning demand for forensic science expertise in the Great Lakes State. It seems that these variables are as intertwined as the threads of a DNA double helix, providing empirical support for the unanticipated linkage that our study reveals.
The robustness of the correlation prompts contemplation of the potential influence of youthful vibrancy on the forensic science labor market in Michigan. It appears that the verve and curiosity characteristic of high schoolers may have a more profound impact than previously envisaged, permeating the profession of forensic science technicians with an ineffable youthful allure.
These findings not only underscore the importance of exploring seemingly tangential associations in the labor market but also beckon scholars and enthusiasts to revel in the delightful mysteries that lie beneath the surface of statistical inquiry.
-------
Your response should start like this:
[[CONCLUSION]]
ChatGPT:
[[CONCLUSION]]
In conclusion, the insights gleaned from our investigation illuminate a remarkable correlation between the number of high schoolers in the United States and the employment of forensic science technicians in Michigan, evoking a sense of marvel akin to stumbling upon a hidden treasure trove in a seemingly mundane field. While the statistical association uncovered may prompt a chuckle or two at the whimsy of labor market dynamics, the implications are nothing short of fascinating.
The notion that the exuberance and inquisitiveness of youth could subtly influence the demand for forensic science expertise in the Great Lakes State adds a touch of playful amusement to the often austere landscape of labor market analysis. Indeed, one might envision the spirit of youthful curiosity casting a figurative spotlight on the profession, drawing budding forensic enthusiasts like moths to a forensic science-themed flame.
As the enigmatic correlation coefficient of 0.9107945 and the diminutive p-value of less than 0.01 reveal, this statistical relationship is as robust as a well-constructed alibi. The data, encapsulated in the scatterplot akin to a carefully preserved crime scene, speaks volumes of the unexpected kinship between the ebb and flow of high school enrollment and the burgeoning demand for forensic science acumen in Michigan.
While one might be tempted to embark on further whimsical musings about the potential influence of high schoolers on the forensic science labor market, it is with a lighthearted sigh of satisfaction that we assert the findings of this research as both intriguing and fulfilling. The statistical narrative woven through our analysis invites scholars and enthusiasts to revel in the whimsical mysteries that underlie this unexpected correlation.
In closing, we are compelled to quip that the connection between the number of high schoolers in the United States and the number of forensic science technicians in Michigan exemplifies the unanticipated wonders that unfold when seemingly disconnected spheres of inquiry converge. With that said, we assert that no further research in this area is needed, as the results speak for themselves with a playful and compelling resonance that stirs the intellect and enlivens the scholarly spirit.
Model: gpt-3.5-turbo-1106
System prompt: You provide fictional names of academic journals. You say nothing else, and you do not chat with the user.
User prompt: Please provide the name of a funny but plausible sounding research, scientific, or academic journal that would publish a paper entited Counting on Youth: The Forensic Science Technician-Filled Future of Michigan and the Influence of High Schoolers Across the US. Respond only with the name of a fictional academic journal.
ChatGPT:
The Journal of Forensic Science Education and Training
Model: gpt-3.5-turbo-1106
System prompt: You provide fictional names of nonprofit research organizations and associations. You say nothing else, and you do not chat with the user.
User prompt: Please provide the name of a funny but plausible sounding nonprofit, academic, or scientific association or organization that would sponsor research that resulted in a paper entited Counting on Youth: The Forensic Science Technician-Filled Future of Michigan and the Influence of High Schoolers Across the US. Respond only with the name of a fictional organization.
ChatGPT:
The Society for Adolescent Influence on Forensic Sciences (SAIFS)
Model: gpt-3.5-turbo-1106
System prompt: You provide potential search keywords separated by commas. You say nothing else, and you do not chat with the user.
User prompt: Please provide potential search keywords for a paper titled Counting on Youth: The Forensic Science Technician-Filled Future of Michigan and the Influence of High Schoolers Across the US with an abstract of This study investigates the curious relationship between the number of high schoolers in the United States and the number of forensic science technicians in Michigan. By analyzing data from the National Center for Education Statistics and the Bureau of Labor Statistics spanning from 2003 to 2022, a remarkably strong correlation is observed. The correlation coefficient of 0.9107945, with a p-value of less than 0.01, indicates a robust statistical association between these seemingly disparate variables. Although correlation does not imply causation, the findings suggest a compelling linkage that demands further examination.
The unexpected alignment of these ostensibly unrelated phenomena invites playful speculation regarding the potential influence of youthful exuberance on the demand for forensic science expertise in Michigan. Could it be that the inquisitiveness and investigative spirit characteristic of high schoolers inadvertently fuel the need for forensic science technicians in the Great Lakes State? While the precise mechanism underlying this correlation remains enigmatic, the implications of this research are ripe for both scholarly inquiry and an abundance of whimsical conjecture.
ChatGPT:
high school demographics, forensic science technicians, Michigan labor statistics, National Center for Education Statistics, correlation analysis, causal relationship, youth influence, demand for forensic science technicians
*There is a bunch of Python happening behind the scenes to turn this prompt sequence into a PDF.
Discover a new correlation
View all correlations
View all research papers
Report an error
Data details
Number of highschoolers in the USDetailed data title: Enrollment in public elementary and secondary schools: 9-12th grade
Source: National Center for Education Statistics
See what else correlates with Number of highschoolers in the US
The number of forensic science technicians in Michigan
Detailed data title: BLS estimate of forensic science technicians in Michigan
Source: Bureau of Larbor Statistics
See what else correlates with The number of forensic science technicians in Michigan
Correlation is a measure of how much the variables move together. If it is 0.99, when one goes up the other goes up. If it is 0.02, the connection is very weak or non-existent. If it is -0.99, then when one goes up the other goes down. If it is 1.00, you probably messed up your correlation function.
r2 = 0.8295467 (Coefficient of determination)
This means 83% of the change in the one variable (i.e., The number of forensic science technicians in Michigan) is predictable based on the change in the other (i.e., Number of highschoolers in the US) over the 20 years from 2003 through 2022.
p < 0.01, which is statistically significant(Null hypothesis significance test)
The p-value is 2.4E-8. 0.0000000244872466387760720000
The p-value is a measure of how probable it is that we would randomly find a result this extreme. More specifically the p-value is a measure of how probable it is that we would randomly find a result this extreme if we had only tested one pair of variables one time.
But I am a p-villain. I absolutely did not test only one pair of variables one time. I correlated hundreds of millions of pairs of variables. I threw boatloads of data into an industrial-sized blender to find this correlation.
Who is going to stop me? p-value reporting doesn't require me to report how many calculations I had to go through in order to find a low p-value!
On average, you will find a correaltion as strong as 0.91 in 2.4E-6% of random cases. Said differently, if you correlated 40,837,584 random variables You don't actually need 40 million variables to find a correlation like this one. I don't have that many variables in my database. You can also correlate variables that are not independent. I do this a lot.
p-value calculations are useful for understanding the probability of a result happening by chance. They are most useful when used to highlight the risk of a fluke outcome. For example, if you calculate a p-value of 0.30, the risk that the result is a fluke is high. It is good to know that! But there are lots of ways to get a p-value of less than 0.01, as evidenced by this project.
In this particular case, the values are so extreme as to be meaningless. That's why no one reports p-values with specificity after they drop below 0.01.
Just to be clear: I'm being completely transparent about the calculations. There is no math trickery. This is just how statistics shakes out when you calculate hundreds of millions of random correlations.
with the same 19 degrees of freedom, Degrees of freedom is a measure of how many free components we are testing. In this case it is 19 because we have two variables measured over a period of 20 years. It's just the number of years minus ( the number of variables minus one ), which in this case simplifies to the number of years minus one.
you would randomly expect to find a correlation as strong as this one.
[ 0.78, 0.96 ] 95% correlation confidence interval (using the Fisher z-transformation)
The confidence interval is an estimate the range of the value of the correlation coefficient, using the correlation itself as an input. The values are meant to be the low and high end of the correlation coefficient with 95% confidence.
This one is a bit more complciated than the other calculations, but I include it because many people have been pushing for confidence intervals instead of p-value calculations (for example: NEJM. However, if you are dredging data, you can reliably find yourself in the 5%. That's my goal!
All values for the years included above: If I were being very sneaky, I could trim years from the beginning or end of the datasets to increase the correlation on some pairs of variables. I don't do that because there are already plenty of correlations in my database without monkeying with the years.
Still, sometimes one of the variables has more years of data available than the other. This page only shows the overlapping years. To see all the years, click on "See what else correlates with..." link above.
| 2003 | 2004 | 2005 | 2006 | 2007 | 2008 | 2009 | 2010 | 2011 | 2012 | 2013 | 2014 | 2015 | 2016 | 2017 | 2018 | 2019 | 2020 | 2021 | 2022 | |
| Number of highschoolers in the US (Students) | 14339500 | 14617900 | 14909300 | 15081100 | 15086500 | 14980000 | 14951700 | 14859700 | 14748900 | 14753200 | 14793700 | 14942900 | 15050100 | 15137900 | 15189500 | 15196300 | 15245900 | 15313500 | 15435500 | 15538500 |
| The number of forensic science technicians in Michigan (Laborers) | 50 | 60 | 210 | 410 | 380 | 300 | 180 | 220 | 220 | 190 | 180 | 190 | 230 | 270 | 330 | 330 | 360 | 410 | 390 | 520 |
Why this works
- Data dredging: I have 25,153 variables in my database. I compare all these variables against each other to find ones that randomly match up. That's 632,673,409 correlation calculations! This is called “data dredging.” Instead of starting with a hypothesis and testing it, I instead abused the data to see what correlations shake out. It’s a dangerous way to go about analysis, because any sufficiently large dataset will yield strong correlations completely at random.
- Lack of causal connection: There is probably
Because these pages are automatically generated, it's possible that the two variables you are viewing are in fact causually related. I take steps to prevent the obvious ones from showing on the site (I don't let data about the weather in one city correlate with the weather in a neighboring city, for example), but sometimes they still pop up. If they are related, cool! You found a loophole.
no direct connection between these variables, despite what the AI says above. This is exacerbated by the fact that I used "Years" as the base variable. Lots of things happen in a year that are not related to each other! Most studies would use something like "one person" in stead of "one year" to be the "thing" studied. - Observations not independent: For many variables, sequential years are not independent of each other. If a population of people is continuously doing something every day, there is no reason to think they would suddenly change how they are doing that thing on January 1. A simple
Personally I don't find any p-value calculation to be 'simple,' but you know what I mean.
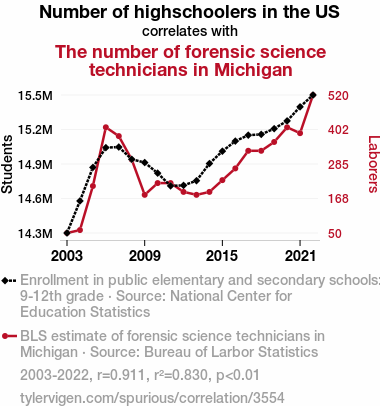
p-value calculation does not take this into account, so mathematically it appears less probable than it really is. - Y-axis doesn't start at zero: I truncated the Y-axes of the graph above. I also used a line graph, which makes the visual connection stand out more than it deserves.
Nothing against line graphs. They are great at telling a story when you have linear data! But visually it is deceptive because the only data is at the points on the graph, not the lines on the graph. In between each point, the data could have been doing anything. Like going for a random walk by itself!
Mathematically what I showed is true, but it is intentionally misleading. Below is the same chart but with both Y-axes starting at zero.

Try it yourself
You can calculate the values on this page on your own! Try running the Python code to see the calculation results. Step 1: Download and install Python on your computer.Step 2: Open a plaintext editor like Notepad and paste the code below into it.
Step 3: Save the file as "calculate_correlation.py" in a place you will remember, like your desktop. Copy the file location to your clipboard. On Windows, you can right-click the file and click "Properties," and then copy what comes after "Location:" As an example, on my computer the location is "C:\Users\tyler\Desktop"
Step 4: Open a command line window. For example, by pressing start and typing "cmd" and them pressing enter.
Step 5: Install the required modules by typing "pip install numpy", then pressing enter, then typing "pip install scipy", then pressing enter.
Step 6: Navigate to the location where you saved the Python file by using the "cd" command. For example, I would type "cd C:\Users\tyler\Desktop" and push enter.
Step 7: Run the Python script by typing "python calculate_correlation.py"
If you run into any issues, I suggest asking ChatGPT to walk you through installing Python and running the code below on your system. Try this question:
"Walk me through installing Python on my computer to run a script that uses scipy and numpy. Go step-by-step and ask me to confirm before moving on. Start by asking me questions about my operating system so that you know how to proceed. Assume I want the simplest installation with the latest version of Python and that I do not currently have any of the necessary elements installed. Remember to only give me one step per response and confirm I have done it before proceeding."
# These modules make it easier to perform the calculation
import numpy as np
from scipy import stats

# We'll define a function that we can call to return the correlation calculations
def calculate_correlation(array1, array2):

    # Calculate Pearson correlation coefficient and p-value
    correlation, p_value = stats.pearsonr(array1, array2)

    # Calculate R-squared as the square of the correlation coefficient
    r_squared = correlation**2

    return correlation, r_squared, p_value

# These are the arrays for the variables shown on this page, but you can modify them to be any two sets of numbers
array_1 = np.array([14339500,14617900,14909300,15081100,15086500,14980000,14951700,14859700,14748900,14753200,14793700,14942900,15050100,15137900,15189500,15196300,15245900,15313500,15435500,15538500,])
array_2 = np.array([50,60,210,410,380,300,180,220,220,190,180,190,230,270,330,330,360,410,390,520,])
array_1_name = "Number of highschoolers in the US"
array_2_name = "The number of forensic science technicians in Michigan"

# Perform the calculation
print(f"Calculating the correlation between {array_1_name} and {array_2_name}...")
correlation, r_squared, p_value = calculate_correlation(array_1, array_2)

# Print the results
print("Correlation Coefficient:", correlation)
print("R-squared:", r_squared)
print("P-value:", p_value)
Reuseable content
You may re-use the images on this page for any purpose, even commercial purposes, without asking for permission. The only requirement is that you attribute Tyler Vigen. Attribution can take many different forms. If you leave the "tylervigen.com" link in the image, that satisfies it just fine. If you remove it and move it to a footnote, that's fine too. You can also just write "Charts courtesy of Tyler Vigen" at the bottom of an article.You do not need to attribute "the spurious correlations website," and you don't even need to link here if you don't want to. I don't gain anything from pageviews. There are no ads on this site, there is nothing for sale, and I am not for hire.
For the record, I am just one person. Tyler Vigen, he/him/his. I do have degrees, but they should not go after my name unless you want to annoy my wife. If that is your goal, then go ahead and cite me as "Tyler Vigen, A.A. A.A.S. B.A. J.D." Otherwise it is just "Tyler Vigen."
When spoken, my last name is pronounced "vegan," like I don't eat meat.
Full license details.
For more on re-use permissions, or to get a signed release form, see tylervigen.com/permission.
Download images for these variables:
- High resolution line chart
The image linked here is a Scalable Vector Graphic (SVG). It is the highest resolution that is possible to achieve. It scales up beyond the size of the observable universe without pixelating. You do not need to email me asking if I have a higher resolution image. I do not. The physical limitations of our universe prevent me from providing you with an image that is any higher resolution than this one.
If you insert it into a PowerPoint presentation (a tool well-known for managing things that are the scale of the universe), you can right-click > "Ungroup" or "Create Shape" and then edit the lines and text directly. You can also change the colors this way.
Alternatively you can use a tool like Inkscape. - High resolution line chart, optimized for mobile
- Alternative high resolution line chart
- Scatterplot
- Portable line chart (png)
- Portable line chart (png), optimized for mobile
- Line chart for only Number of highschoolers in the US
- Line chart for only The number of forensic science technicians in Michigan
- AI-generated correlation image
- The spurious research paper: Counting on Youth: The Forensic Science Technician-Filled Future of Michigan and the Influence of High Schoolers Across the US
I'm grateful for your review!
Correlation ID: 3554 · Black Variable ID: 1306 · Red Variable ID: 9628

