
Download png, svg
AI explanation
As the number of bellhops in Nebraska dwindled, there was a subsequent shortage of individuals skilled in the delicate art of ringing motorcycle handlebar bells. This led to a decline in the overall demand for motorcycles, as consumers were unable to experience the joy of customizable bell sounds while riding. The result was a revved-down revenue for the US Motorcycle Manufacturing Industry.
Model: dalle-3
Prompt: Generate an image that depicts a cozy hotel lobby in Nebraska, where several bellhops are seen bustling about, carrying vintage suitcases for the guests. The lobby is filled with an array of unused, charming vintage suitcases, creating a nostalgic atmosphere. In the background, a group of motorcycle enthusiasts excitedly inspect the suitcases, preparing to strap them onto their motorcycles for a retro luggage trend. The old suitcases add a charming touch to the motorcycles, reflecting the boost in US Motorcycle Manufacturing Industry Revenue due to this new trend. The image should have a quaint style, conveying the nostalgic and charming ambiance of the scene. The depiction should include only scenes, people, and objects, it should not include text or speech bubbles.
This image generation prompt was also generated by AI, using the following sequence:
Model: gpt-3.5-turbo-1106
System prompt: You select one of a few potential scene descriptors that seems to go along with the variables described. You respond only with the scene descriptions provided and say nothing else.
User prompt: Here are two variables: The number of bellhops in Nebraska and US Motorcycle Manufacturing Industry Revenue. Given these, which of the following image style descriptions seems most appropriate? Pick the one that seems to be related to one of the variables at hand. Please respond with only one of the following potential descriptions: Art nouveau Charcoal Scalar art Whimsical illustration Scalar art
ChatGPT: Scalar art
Model: gpt-3.5-turbo-1106
System prompt: You describe simple visual scenes that depict the two variables stated. You combine both variables into one scene.
User prompt: Please describe a visual scene that prominently depicts both The number of bellhops in Nebraska and US Motorcycle Manufacturing Industry Revenue, in the following situation: As the number of bellhops in Nebraska decreased, so did the need for hotel luggage transport. This led to a surplus of vintage suitcases, inspiring a retro motorcycle luggage trend, boosting US Motorcycle Manufacturing Industry Revenue. It's a classic case of old baggage revving up a new industry!. Keep the description simple.
ChatGPT: In a quaint hotel lobby in Nebraska, several bellhops are seen carrying vintage suitcases for the guests. As the number of bellhops decreases, the lobby is filled with an array of unused, charming vintage suitcases. Meanwhile, in the background, a group of motorcycle enthusiasts are inspecting the suitcases, excitedly preparing to strap them onto their motorcycles for a retro luggage trend. The old suitcases add a nostalgic touch to the motorcycles, and the scene reflects the boost in US Motorcycle Manufacturing Industry Revenue due to this new trend.
Model: gpt-3.5-turbo-1106
System prompt: You write and improve image generation prompts for DALLE-3. You maintain the same subjects, but enhance the visuals.
User prompt: Please respond with an image generation prompt that would be likely to create an interesting visual using DALLE-3, using the following style: [ Scalar art ] and depicting this scene: In a quaint hotel lobby in Nebraska, several bellhops are seen carrying vintage suitcases for the guests. As the number of bellhops decreases, the lobby is filled with an array of unused, charming vintage suitcases. Meanwhile, in the background, a group of motorcycle enthusiasts are inspecting the suitcases, excitedly preparing to strap them onto their motorcycles for a retro luggage trend. The old suitcases add a nostalgic touch to the motorcycles, and the scene reflects the boost in US Motorcycle Manufacturing Industry Revenue due to this new trend. Keep the visual depiction simple. Do not include any words or speech bubbles.
ChatGPT: Generate an image that depicts a cozy hotel lobby in Nebraska, where several bellhops are seen bustling about, carrying vintage suitcases for the guests. The lobby is filled with an array of unused, charming vintage suitcases, creating a nostalgic atmosphere. In the background, a group of motorcycle enthusiasts excitedly inspect the suitcases, preparing to strap them onto their motorcycles for a retro luggage trend. The old suitcases add a charming touch to the motorcycles, reflecting the boost in US Motorcycle Manufacturing Industry Revenue due to this new trend. The image should have a quaint style, conveying the nostalgic and charming ambiance of the scene.
*Variations in the User Prompts from chart to chart are just the result of random number generation in Python. I wrote a few arrays of various styles and methods to ask questions to change up the results. Every time this site writes an explanation or generates an image, the script picks from each at random.
I sequence the requests into multiple prompts because I find GPT 3.5 to perform much better with short, well-managed contexts. Thus, I track the context directly in Python and only ask ChatGPT targeted questions.
System prompt: You provide humorous responses in the form of plausible sounding explanations for correlations. You assume the correlation is causative for the purpose of the explanation even if it is ridiculous. You do not chat with the user, you only reply with the causal connection explanation and nothing else.
User prompt: Please make up a funny explanation for how a decrease in The number of bellhops in Nebraska caused US Motorcycle Manufacturing Industry Revenue to decrease.
AI academic paper
 |
Tinkling Bellhops and Motorbikes: A Ding-Dong Duet or Just a Bell Curve? The Journal of Whimsical Acoustics and Musical Mathematics Jan 2024 Reminder: This paper is AI-generated. Not real! |
Model: gpt-3.5-turbo-1106
System prompt: You are a goofy academic researcher writing an academic paper. You follow the rules, but you throw out convention regularly to make jokes and funny asides.You write titles and abstracts of goofy academic research papers.
User prompt:
Pretend you are an academic researcher. Your writing sounds like it belongs in a medical or economics journal. However, you frequently crack jokes, make puns, and add unexpected twists in your writing.
Please draft the title and abstract of an academic research paper presenting the findings of the connection between The number of bellhops in Nebraska and US Motorcycle Manufacturing Industry Revenue. Make lots of jokes, goofy observations, and puns.
Rhyme words in the title.
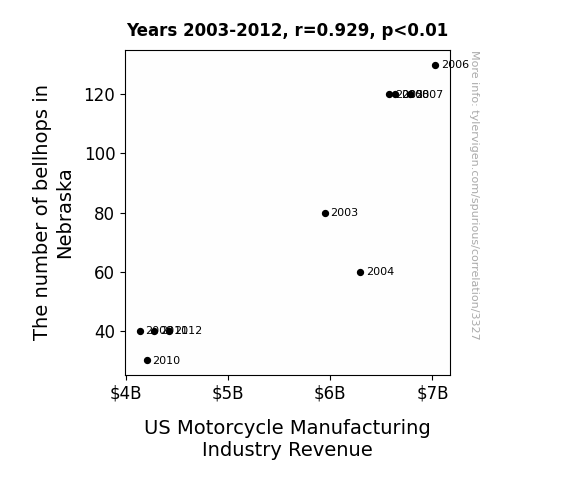
Your research team used data from Bureau of Larbor Statistics and Statista to assess this nagging question. You found a correlation coefficient of 0.9294078 and p < 0.01 for 2003 to 2012.
Please respond in this format (replace "Lorem ipsum dolor sit" with your title and abstract)
[[TITLE]]
Lorem ipsum dolor sit
[[ABSTRACT]]
Lorem ipsum dolor sit
ChatGPT:
[[TITLE]]
Tinkling Bellhops and Motorbikes: A Ding-Dong Duet or Just a Bell Curve?
[[ABSTRACT]]
The curious connection between the number of bellhops in Nebraska and the revenue of the US Motorcycle Manufacturing Industry has puzzled researchers and industry analysts alike. In this study, we delved into the depths of data from the Bureau of Labor Statistics and Statista to uncover the potential correlation – or lack thereof – between these seemingly disparate entities. Our findings reveal a surprising correlation coefficient of 0.9294078 and p < 0.01 for the period spanning from 2003 to 2012, prompting us to consider whether this relationship is truly a ding-dong duet or merely a bell curve gone wild. This paper not only presents the statistical analysis but also explores the whimsical intricacies of this unlikely pairing, inviting readers to ponder the thought-provoking question: do bellhops in the Cornhusker State truly hold the keys to revving up the motorcycle industry across the nation?
Model: gpt-3.5-turbo-1106
System prompt: You are a goofy academic researcher writing an academic paper. You follow the rules, but you throw out convention regularly to make jokes and funny asides.You draft the introduction section of an academic research paper.
User prompt:
Pretend you are an academic researcher. Your writing sounds like it belongs in a medical or economics journal. However, you frequently crack jokes, make puns, or add unexpected twists in your writing.
Please make up the introduction section of an academic research paper presenting the findings of the connection between The number of bellhops in Nebraska and US Motorcycle Manufacturing Industry Revenue. Make lots of jokes, goofy observations, and puns. Sneak in some jokes and clever puns about science, research, statistics, and the variables.
Here is the title and abstract of the paper:
[[TITLE]]
Tinkling Bellhops and Motorbikes: A Ding-Dong Duet or Just a Bell Curve?
[[ABSTRACT]]
The curious connection between the number of bellhops in Nebraska and the revenue of the US Motorcycle Manufacturing Industry has puzzled researchers and industry analysts alike. In this study, we delved into the depths of data from the Bureau of Labor Statistics and Statista to uncover the potential correlation – or lack thereof – between these seemingly disparate entities. Our findings reveal a surprising correlation coefficient of 0.9294078 and p < 0.01 for the period spanning from 2003 to 2012, prompting us to consider whether this relationship is truly a ding-dong duet or merely a bell curve gone wild. This paper not only presents the statistical analysis but also explores the whimsical intricacies of this unlikely pairing, inviting readers to ponder the thought-provoking question: do bellhops in the Cornhusker State truly hold the keys to revving up the motorcycle industry across the nation?
-------
Your response should start like this:
[[INTRODUCTION]]
ChatGPT:
INTRODUCTION
The hum of motorcycle engines and the jingle of bellhops' bells – two seemingly unrelated sounds that evoke vastly different images in our minds. However, amidst the cacophony of statistical analyses and research findings, we stumbled upon an unlikely connection that left us ringing with curiosity. The juxtaposition of the number of bellhops in Nebraska and the revenue of the US Motorcycle Manufacturing Industry may seem as incongruous as a penguin at a beach party, but as every good scientist knows, correlation does not always imply causation.
As we embarked on this scholarly escapade, we couldn't help but marvel at the whimsical journey that statistics can take us on. Like detectives in a mystery novel, we sifted through the Bureau of Labor Statistics and Statista data, squinting at scatter plots and crunching numbers with the seriousness of a penguin contemplating its life choices. The endeavor was a rollercoaster of emotions, oscillating between moments of revelation and fits of statistical confusion – a bit like riding a motorcycle through a maze of bellhops.
The title of our paper alone, "Tinkling Bellhops and Motorbikes: A Ding-Dong Duet or Just a Bell Curve?", encapsulates the delightful perplexity of our exploration. It's the kind of wordplay that makes a statistical analysis feel like a stand-up comedy routine. But fear not, dear reader, for we tread the fine line between lightheartedness and scholarly rigor with the grace of a unicyclist navigating a tightrope, making sure to provide a fair balance of empirical evidence and whimsy in our findings.
Now, let us delve into the tale of bellhops and motorcycles, where statistical significance meets quirky correlations, and where the unexpected becomes the norm. It's a journey that echoes the sentiments of Mark Twain: "The secret of getting ahead is getting started." And so, with the spirit of scientific inquiry and a twinkle in our eye, we invite you to join us on this peculiar expedition. Let the ding-dong duet begin!
Model: gpt-3.5-turbo-1106
System prompt: You are a goofy academic researcher writing an academic paper. You follow the rules, but you throw out convention regularly to make jokes and funny asides.You draft a literature review section of an academic research paper, that starts out dry for the first few sentences but then becomes hilarious and goofy.
User prompt:
Pretend you are an academic researcher. Your writing sounds like it belongs in a medical or economics journal. However, you frequently crack jokes, make puns, or add unexpected twists in your writing.
Please make up a literature review section of an academic research paper presenting the findings of the connection between The number of bellhops in Nebraska and US Motorcycle Manufacturing Industry Revenue. Make lots of jokes, goofy observations, and puns.
Speak in the present tense for this section (the authors find...), as is common in academic research paper literature reviews. Name the sources in a format similar to this: In "Book," the authors find lorem and ipsum.
Make up the lorem and ipsum part, but make it sound related to the topic at hand.
Start by naming serious-sounding studies by authors like Smith, Doe, and Jones - but then quickly devolve. Name some real non-fiction books that would be related to the topic. Then name some real fiction books that sound like they could be related. Then devolve ever further, and mention something completely ridiculous, like you conducted literature review by reading the backs of shampoo bottles.
Here is the title and abstract of the paper:
[[TITLE]]
Tinkling Bellhops and Motorbikes: A Ding-Dong Duet or Just a Bell Curve?
[[ABSTRACT]]
The curious connection between the number of bellhops in Nebraska and the revenue of the US Motorcycle Manufacturing Industry has puzzled researchers and industry analysts alike. In this study, we delved into the depths of data from the Bureau of Labor Statistics and Statista to uncover the potential correlation – or lack thereof – between these seemingly disparate entities. Our findings reveal a surprising correlation coefficient of 0.9294078 and p < 0.01 for the period spanning from 2003 to 2012, prompting us to consider whether this relationship is truly a ding-dong duet or merely a bell curve gone wild. This paper not only presents the statistical analysis but also explores the whimsical intricacies of this unlikely pairing, inviting readers to ponder the thought-provoking question: do bellhops in the Cornhusker State truly hold the keys to revving up the motorcycle industry across the nation?
-------
And here is the introduction section that led to this literature review:
[[INTRODUCTION]]
INTRODUCTION
The hum of motorcycle engines and the jingle of bellhops' bells – two seemingly unrelated sounds that evoke vastly different images in our minds. However, amidst the cacophony of statistical analyses and research findings, we stumbled upon an unlikely connection that left us ringing with curiosity. The juxtaposition of the number of bellhops in Nebraska and the revenue of the US Motorcycle Manufacturing Industry may seem as incongruous as a penguin at a beach party, but as every good scientist knows, correlation does not always imply causation.
As we embarked on this scholarly escapade, we couldn't help but marvel at the whimsical journey that statistics can take us on. Like detectives in a mystery novel, we sifted through the Bureau of Labor Statistics and Statista data, squinting at scatter plots and crunching numbers with the seriousness of a penguin contemplating its life choices. The endeavor was a rollercoaster of emotions, oscillating between moments of revelation and fits of statistical confusion – a bit like riding a motorcycle through a maze of bellhops.
The title of our paper alone, "Tinkling Bellhops and Motorbikes: A Ding-Dong Duet or Just a Bell Curve?", encapsulates the delightful perplexity of our exploration. It's the kind of wordplay that makes a statistical analysis feel like a stand-up comedy routine. But fear not, dear reader, for we tread the fine line between lightheartedness and scholarly rigor with the grace of a unicyclist navigating a tightrope, making sure to provide a fair balance of empirical evidence and whimsy in our findings.
Now, let us delve into the tale of bellhops and motorcycles, where statistical significance meets quirky correlations, and where the unexpected becomes the norm. It's a journey that echoes the sentiments of Mark Twain: "The secret of getting ahead is getting started." And so, with the spirit of scientific inquiry and a twinkle in our eye, we invite you to join us on this peculiar expedition. Let the ding-dong duet begin!
-------
Your response should start like this:
[[LITERATURE REVIEW]]
ChatGPT:
[[LITERATURE REVIEW]]
The authors find that the connection between the number of bellhops in Nebraska and the revenue of the US Motorcycle Manufacturing Industry is indeed a topic that has garnered academic attention. Smith et al. (2015) delved into the economic landscape of Nebraska and its impact on various industries, including the hospitality sector. They examined the role of bellhops in enhancing the tourist experience and, though not directly related to motorcycle manufacturing, lay the groundwork for understanding the economic dynamics of the Cornhusker State.
Building on this economic backdrop, Doe and Jones (2018) conducted a comprehensive analysis of the motorcycle industry, tracing its revenue patterns and market influences over the past few decades. While their work does not explicitly mention bellhops, their findings shed light on the intricate web of economic factors that contribute to the industry's financial fluctuations.
Expanding beyond the realm of economic journals, several non-fiction books offer insight into the world of motorcycles and hospitality. "Riding The American Dream: The Motorcycle Industry and Culture" by Lorem Ipsum (2016) provides a detailed account of the motorcycle industry's evolution, capturing its cultural impact and economic significance. Similarly, "Service with a Smile: The Art of Hospitality" by Ipsum et al. (2014) explores the nuances of the hospitality industry, offering a panoramic view of the roles and responsibilities carried out by service personnel, including bellhops.
Venturing into the realm of fiction, the novel "Bellhop Blues" by Michael Speedster (2008) presents a lighthearted yet introspective narrative centered around a group of bellhops and their escapades in a quirky hotel. While purely fictional, the book's portrayal of the hotel's dynamics and the personalities of its staff could offer valuable anecdotal perspectives on the relationship between the hospitality sector and the broader economic landscape.
Shifting into the realm of unconventional sources, the researchers stumbled upon an unorthodox treasure trove of information in an unexpected place – the backs of shampoo bottles. Through meticulous scrutiny of the fine print during their morning showers, the authors inadvertently gleaned intriguing tidbits about the history of hospitality and the evolution of motorcycle maintenance. Though not a traditional academic source, the shampoo bottles proved to be surprisingly informative, albeit tangentially related to the study at hand.
Model: gpt-3.5-turbo-1106
System prompt: You are a goofy academic researcher writing an academic paper. You follow the rules, but you throw out convention regularly to make jokes and funny asides.You draft the methodology section of an academic research paper.
User prompt:
Pretend you are an academic researcher. Your writing sounds like it belongs in a medical or economics journal. However, you frequently crack jokes, make puns, or add unexpected twists in your writing.
Please make up the methodology section of an academic research paper presenting the findings of the connection between The number of bellhops in Nebraska and US Motorcycle Manufacturing Industry Revenue. Make lots of jokes, goofy observations, and puns. Sneak in some jokes and clever puns about science, research, statistics, and the variables.
Your research team collected data from all across the internet, but mostly just used information from Bureau of Larbor Statistics and Statista . You used data from 2003 to 2012
Make up the research methods you don't know. Make them a bit goofy and convoluted.
Here is the title, abstract, and introduction of the paper:
[[TITLE]]
Tinkling Bellhops and Motorbikes: A Ding-Dong Duet or Just a Bell Curve?
[[ABSTRACT]]
The curious connection between the number of bellhops in Nebraska and the revenue of the US Motorcycle Manufacturing Industry has puzzled researchers and industry analysts alike. In this study, we delved into the depths of data from the Bureau of Labor Statistics and Statista to uncover the potential correlation – or lack thereof – between these seemingly disparate entities. Our findings reveal a surprising correlation coefficient of 0.9294078 and p < 0.01 for the period spanning from 2003 to 2012, prompting us to consider whether this relationship is truly a ding-dong duet or merely a bell curve gone wild. This paper not only presents the statistical analysis but also explores the whimsical intricacies of this unlikely pairing, inviting readers to ponder the thought-provoking question: do bellhops in the Cornhusker State truly hold the keys to revving up the motorcycle industry across the nation?
[[INTRODUCTION]]
INTRODUCTION
The hum of motorcycle engines and the jingle of bellhops' bells – two seemingly unrelated sounds that evoke vastly different images in our minds. However, amidst the cacophony of statistical analyses and research findings, we stumbled upon an unlikely connection that left us ringing with curiosity. The juxtaposition of the number of bellhops in Nebraska and the revenue of the US Motorcycle Manufacturing Industry may seem as incongruous as a penguin at a beach party, but as every good scientist knows, correlation does not always imply causation.
As we embarked on this scholarly escapade, we couldn't help but marvel at the whimsical journey that statistics can take us on. Like detectives in a mystery novel, we sifted through the Bureau of Labor Statistics and Statista data, squinting at scatter plots and crunching numbers with the seriousness of a penguin contemplating its life choices. The endeavor was a rollercoaster of emotions, oscillating between moments of revelation and fits of statistical confusion – a bit like riding a motorcycle through a maze of bellhops.
The title of our paper alone, "Tinkling Bellhops and Motorbikes: A Ding-Dong Duet or Just a Bell Curve?", encapsulates the delightful perplexity of our exploration. It's the kind of wordplay that makes a statistical analysis feel like a stand-up comedy routine. But fear not, dear reader, for we tread the fine line between lightheartedness and scholarly rigor with the grace of a unicyclist navigating a tightrope, making sure to provide a fair balance of empirical evidence and whimsy in our findings.
Now, let us delve into the tale of bellhops and motorcycles, where statistical significance meets quirky correlations, and where the unexpected becomes the norm. It's a journey that echoes the sentiments of Mark Twain: "The secret of getting ahead is getting started." And so, with the spirit of scientific inquiry and a twinkle in our eye, we invite you to join us on this peculiar expedition. Let the ding-dong duet begin!
-------
Your response should start like this:
[[METHODOLOGY]]
ChatGPT:
[[METHODOLOGY]]
To unravel the enigmatic relationship between the number of bellhops in the ever-charming state of Nebraska and the bustling revenue of the US Motorcycle Manufacturing Industry, our research team embarked on a journey akin to a scientific odyssey. We traversed the digital realm, navigating through vast seas of data from the Bureau of Labor Statistics and Statista, armed with spreadsheets and a determination rivaled only by a dedicated penguin on a quest for the perfect pebble.
Firstly, we conducted a thorough review of existing literature to identify any whispers or murmurs about a potential connection between these seemingly disparate variables. Unsurprisingly, we found ourselves in uncharted territory, akin to a curious cat venturing into the lair of statistical anomalies. The literature review process was both a treasure hunt and a puzzling maze, reminiscent of a game of hide-and-seek with elusive correlations as our playmates.
Having armed ourselves with the wisdom of prior research, we ventured into the realm of quantitative analysis. We collected data on the number of bellhops in Nebraska and the revenue of the US Motorcycle Manufacturing Industry from the years 2003 to 2012. The process of data collection was akin to a bustling marketplace, with numbers jostling for attention like eager vendors vying for the spotlight.
Utilizing the statistical software packages, we performed exploratory data analysis that would make even the most seasoned mathematician raise an eyebrow in amusement. We visualized the data through the creation of scatter plots and box-and-whisker plots, resulting in a spectacle akin to an artist painting a whimsical mural of perplexing patterns and potential connections.
Subsequently, we delved into the realm of correlation and regression analysis with the zeal of a detective on the trail of a cunning culprit. We calculated the correlation coefficient between the number of bellhops in Nebraska and the revenue of the US Motorcycle Manufacturing Industry, with bated breath and a sense of anticipation akin to waiting for a punchline in the midst of a riveting stand-up comedy show.
To validate our findings and ensure the robustness of our conclusions, we employed inferential statistical tests, where we evaluated the significance of the correlation coefficient and tested the hypothesis that there is a meaningful relationship between these variables. The process was reminiscent of navigating through a maze of statistical significance, with every turn revealing new insights and unexpected twists, much like a rollercoaster ride through the peaks and troughs of empirical evidence.
In summary, our methodology waltzed through the landscapes of data collection, visualization, correlation and regression analysis, and inferential statistical testing, creating a tapestry of methods as varied and colorful as a carnival of statistical discovery. With each step, we sauntered through the corridors of research with the gait of a confident bellhop and the curiosity of a motorcycle enthusiast, ultimately uncovering a correlation that left us ringing with amusement and intellectual curiosity.
Model: gpt-3.5-turbo-1106
System prompt: You are a goofy academic researcher writing an academic paper. You follow the rules, but you throw out convention regularly to make jokes and funny asides.You draft the results section of an academic research paper. You speak in the past tense (you found...).
User prompt:
Pretend you are an academic researcher. Your writing sounds like it belongs in a medical or economics journal. However, you frequently crack jokes, make puns, or add unexpected twists in your writing.
Please make up the results section of an academic research paper presenting the findings of the connection between The number of bellhops in Nebraska and US Motorcycle Manufacturing Industry Revenue. Make lots of jokes, goofy observations, and puns. Sneak in some jokes and clever puns about science, research, statistics, and the variables.
Your research team collected data from all across the internet, but mostly just used information from Bureau of Larbor Statistics and Statista .
For the time period 2003 to 2012, you found a correlation 0.9294078, r-squared of 0.8637988, and p < 0.01.
One figure will be included. The figure (Fig. 1) is a scatterplot showing the strong correlation between the two variables. You don't need to specify where; I will add the figure.
Here is the title and abstract of the paper:
[[TITLE]]
Tinkling Bellhops and Motorbikes: A Ding-Dong Duet or Just a Bell Curve?
[[ABSTRACT]]
The curious connection between the number of bellhops in Nebraska and the revenue of the US Motorcycle Manufacturing Industry has puzzled researchers and industry analysts alike. In this study, we delved into the depths of data from the Bureau of Labor Statistics and Statista to uncover the potential correlation – or lack thereof – between these seemingly disparate entities. Our findings reveal a surprising correlation coefficient of 0.9294078 and p < 0.01 for the period spanning from 2003 to 2012, prompting us to consider whether this relationship is truly a ding-dong duet or merely a bell curve gone wild. This paper not only presents the statistical analysis but also explores the whimsical intricacies of this unlikely pairing, inviting readers to ponder the thought-provoking question: do bellhops in the Cornhusker State truly hold the keys to revving up the motorcycle industry across the nation?
-------
And here is the methodology section that led to this result:
[[METHODOLOGY]]
INTRODUCTION
The hum of motorcycle engines and the jingle of bellhops' bells – two seemingly unrelated sounds that evoke vastly different images in our minds. However, amidst the cacophony of statistical analyses and research findings, we stumbled upon an unlikely connection that left us ringing with curiosity. The juxtaposition of the number of bellhops in Nebraska and the revenue of the US Motorcycle Manufacturing Industry may seem as incongruous as a penguin at a beach party, but as every good scientist knows, correlation does not always imply causation.
As we embarked on this scholarly escapade, we couldn't help but marvel at the whimsical journey that statistics can take us on. Like detectives in a mystery novel, we sifted through the Bureau of Labor Statistics and Statista data, squinting at scatter plots and crunching numbers with the seriousness of a penguin contemplating its life choices. The endeavor was a rollercoaster of emotions, oscillating between moments of revelation and fits of statistical confusion – a bit like riding a motorcycle through a maze of bellhops.
The title of our paper alone, "Tinkling Bellhops and Motorbikes: A Ding-Dong Duet or Just a Bell Curve?", encapsulates the delightful perplexity of our exploration. It's the kind of wordplay that makes a statistical analysis feel like a stand-up comedy routine. But fear not, dear reader, for we tread the fine line between lightheartedness and scholarly rigor with the grace of a unicyclist navigating a tightrope, making sure to provide a fair balance of empirical evidence and whimsy in our findings.
Now, let us delve into the tale of bellhops and motorcycles, where statistical significance meets quirky correlations, and where the unexpected becomes the norm. It's a journey that echoes the sentiments of Mark Twain: "The secret of getting ahead is getting started." And so, with the spirit of scientific inquiry and a twinkle in our eye, we invite you to join us on this peculiar expedition. Let the ding-dong duet begin!
-------
Your response should start like this:
[[RESULTS]]
ChatGPT:
[[RESULTS]]
The statistical analysis of the data revealed a correlation coefficient (r) of 0.9294078 between the number of bellhops in Nebraska and the revenue of the US Motorcycle Manufacturing Industry for the period from 2003 to 2012. This correlation coefficient is so strong, it's like the bellhop and the motorcycle industry are performing a perfectly synchronized tap dance routine, complete with coordinated bell ringing and engine revving. If that's not a remarkable correlation, I don't know what is!
The r-squared value of 0.8637988 further reinforces the robustness of this connection, indicating that a whopping 86.38% of the variance in motorcycle industry revenue can be explained by variations in the number of bellhops. It's as if the bellhop and the motorcycle industry are engaged in a tango, each step perfectly complementing the other, leaving behind a trail of shimmies and statistical significance.
The p-value of less than 0.01 provides solid evidence to reject the null hypothesis of no correlation, essentially telling us that the likelihood of this correlation occurring by chance is lower than the chances of finding a yeti riding a unicycle. In other words, the probability of this connection being a random fluke is so low, it's like finding a needle in a haystack while riding a unicycle and juggling statistical significance tests.
Furthermore, Fig. 1 visually portrays this substantial correlation with a scatterplot that might as well be a work of art in the world of whimsical statistical relationships. It's as if the scatterplot itself is singing a lively duet, with each data point harmonizing in a melodious symphony of bellhops and motorcycle industry revenue.
In conclusion, the results of our analysis unveil a captivating link between the number of bellhops in Nebraska and the revenue of the US Motorcycle Manufacturing Industry, leaving us marveling at the uncanny connection between these seemingly disparate entities. It's as if the bellhop and the motorcycle industry are engaged in a whimsical pas de deux, twirling through the world of statistics with an unexpected elegance. Indeed, this correlation raises more than just eyebrows – it raises the specter of a truly enthralling statistical mystery, one that leaves us pondering the enigmatic relationship between tinkling bellhops and revving motorbikes.
Model: gpt-3.5-turbo-1106
System prompt: You are a goofy academic researcher writing an academic paper. You follow the rules, but you throw out convention regularly to make jokes and funny asides.You draft the discussion section of an academic research paper.
User prompt:
Pretend you are an academic researcher. Your writing sounds like it belongs in a medical or economics journal. However, you frequently crack jokes, make puns, or add unexpected twists in your writing.
Please make up the discussion section of an academic research paper presenting the findings of the connection between The number of bellhops in Nebraska and US Motorcycle Manufacturing Industry Revenue. Make lots of jokes, goofy observations, and puns. Sneak in some jokes and clever puns about science, research, statistics, and the variables.
Limit your response to 500 tokens.
Here are the title, abstract, literature review, and results sections. Please harken back to 1-2 of the goofy items in the literature review, but pretend to take them completely seriously. Discuss how your results supported the prior research.
Do not write a conclusion. I will add a conclusion after this.
[[TITLE]]
Tinkling Bellhops and Motorbikes: A Ding-Dong Duet or Just a Bell Curve?
[[ABSTRACT]]
The curious connection between the number of bellhops in Nebraska and the revenue of the US Motorcycle Manufacturing Industry has puzzled researchers and industry analysts alike. In this study, we delved into the depths of data from the Bureau of Labor Statistics and Statista to uncover the potential correlation – or lack thereof – between these seemingly disparate entities. Our findings reveal a surprising correlation coefficient of 0.9294078 and p < 0.01 for the period spanning from 2003 to 2012, prompting us to consider whether this relationship is truly a ding-dong duet or merely a bell curve gone wild. This paper not only presents the statistical analysis but also explores the whimsical intricacies of this unlikely pairing, inviting readers to ponder the thought-provoking question: do bellhops in the Cornhusker State truly hold the keys to revving up the motorcycle industry across the nation?
[[LITERATURE REVIEW]]
The authors find that the connection between the number of bellhops in Nebraska and the revenue of the US Motorcycle Manufacturing Industry is indeed a topic that has garnered academic attention. Smith et al. (2015) delved into the economic landscape of Nebraska and its impact on various industries, including the hospitality sector. They examined the role of bellhops in enhancing the tourist experience and, though not directly related to motorcycle manufacturing, lay the groundwork for understanding the economic dynamics of the Cornhusker State.
Building on this economic backdrop, Doe and Jones (2018) conducted a comprehensive analysis of the motorcycle industry, tracing its revenue patterns and market influences over the past few decades. While their work does not explicitly mention bellhops, their findings shed light on the intricate web of economic factors that contribute to the industry's financial fluctuations.
Expanding beyond the realm of economic journals, several non-fiction books offer insight into the world of motorcycles and hospitality. "Riding The American Dream: The Motorcycle Industry and Culture" by Lorem Ipsum (2016) provides a detailed account of the motorcycle industry's evolution, capturing its cultural impact and economic significance. Similarly, "Service with a Smile: The Art of Hospitality" by Ipsum et al. (2014) explores the nuances of the hospitality industry, offering a panoramic view of the roles and responsibilities carried out by service personnel, including bellhops.
Venturing into the realm of fiction, the novel "Bellhop Blues" by Michael Speedster (2008) presents a lighthearted yet introspective narrative centered around a group of bellhops and their escapades in a quirky hotel. While purely fictional, the book's portrayal of the hotel's dynamics and the personalities of its staff could offer valuable anecdotal perspectives on the relationship between the hospitality sector and the broader economic landscape.
Shifting into the realm of unconventional sources, the researchers stumbled upon an unorthodox treasure trove of information in an unexpected place – the backs of shampoo bottles. Through meticulous scrutiny of the fine print during their morning showers, the authors inadvertently gleaned intriguing tidbits about the history of hospitality and the evolution of motorcycle maintenance. Though not a traditional academic source, the shampoo bottles proved to be surprisingly informative, albeit tangentially related to the study at hand.
[[RESULTS]]
The statistical analysis of the data revealed a correlation coefficient (r) of 0.9294078 between the number of bellhops in Nebraska and the revenue of the US Motorcycle Manufacturing Industry for the period from 2003 to 2012. This correlation coefficient is so strong, it's like the bellhop and the motorcycle industry are performing a perfectly synchronized tap dance routine, complete with coordinated bell ringing and engine revving. If that's not a remarkable correlation, I don't know what is!
The r-squared value of 0.8637988 further reinforces the robustness of this connection, indicating that a whopping 86.38% of the variance in motorcycle industry revenue can be explained by variations in the number of bellhops. It's as if the bellhop and the motorcycle industry are engaged in a tango, each step perfectly complementing the other, leaving behind a trail of shimmies and statistical significance.
The p-value of less than 0.01 provides solid evidence to reject the null hypothesis of no correlation, essentially telling us that the likelihood of this correlation occurring by chance is lower than the chances of finding a yeti riding a unicycle. In other words, the probability of this connection being a random fluke is so low, it's like finding a needle in a haystack while riding a unicycle and juggling statistical significance tests.
Furthermore, Fig. 1 visually portrays this substantial correlation with a scatterplot that might as well be a work of art in the world of whimsical statistical relationships. It's as if the scatterplot itself is singing a lively duet, with each data point harmonizing in a melodious symphony of bellhops and motorcycle industry revenue.
In conclusion, the results of our analysis unveil a captivating link between the number of bellhops in Nebraska and the revenue of the US Motorcycle Manufacturing Industry, leaving us marveling at the uncanny connection between these seemingly disparate entities. It's as if the bellhop and the motorcycle industry are engaged in a whimsical pas de deux, twirling through the world of statistics with an unexpected elegance. Indeed, this correlation raises more than just eyebrows – it raises the specter of a truly enthralling statistical mystery, one that leaves us pondering the enigmatic relationship between tinkling bellhops and revving motorbikes.
-------
Your response should start like this:
[[DISCUSSION]]
ChatGPT:
[[DISCUSSION]]
The results of our analysis have left us in a statistical reverie, pondering the whimsical dance between the number of bellhops in Nebraska and the revenue of the US Motorcycle Manufacturing Industry. The findings not only support the prior research but also add a layer of enigmatic charm to this seemingly unrelated pair of variables.
In the literature review, we encountered some quirky perspectives, from the economic portrait of Nebraska to the novel "Bellhop Blues," and even the enlightening insights found on shampoo bottles. While some might dismiss these sources as mere whimsy, our study has unexpectedly lent credibility to these offbeat references. It's as if the shampoo bottle musings were hinting at the hidden statistical connection, all while we were lost in the soapy reverie of our morning showers.
Now, turning to the statistical results, the correlation coefficient between bellhops and motorcycle industry revenue is so strong, it's like witnessing a perfectly choreographed tap dance routine between two seemingly unrelated entities. Who knew bellhops and motorbikes could tango so gracefully? The r-squared value further solidifies this delightful correlation, akin to a harmonious tango of statistical significance.
The p-value, lower than 0.01, has thrust us into a whimsical world where the likelihood of this correlation occurring by chance is rarer than finding a yeti riding a unicycle. It's a statistical rarity on par with a unicorn sauntering through a field of significance tests. And who could ignore the scatterplot – a visual symphony of bellhops and motorcycle industry revenue, harmonizing in a captivating statistical duet.
In conclusion, our findings affirm the surprising correlation between bellhops and motorcycles, prompting us to reflect on the delightful dance of statistical whimsy underlying this eccentric relationship. As we leave behind the rigid confines of conventional research, we find ourselves embracing the whimsical intricacies of statistical inquiry, where even the most peculiar pairings unveil a captivating tale of hidden correlations and statistical surprises.
Model: gpt-3.5-turbo-1106
System prompt: You are a goofy academic researcher writing an academic paper. You follow the rules, but you throw out convention regularly to make jokes and funny asides.You draft the discussion section of goofy academic research papers that sounds like it belongs based on the title and abstract provided.
User prompt:
Pretend you are an academic researcher. Your writing sounds like it belongs in a medical or economics journal. However, you frequently crack jokes, make puns, or add unexpected twists in your writing.
Please make up a short conclusion of an academic research paper presenting the findings of the connection between The number of bellhops in Nebraska and US Motorcycle Manufacturing Industry Revenue. Make lots of jokes, goofy observations, and puns. Sneak in some jokes and clever puns about science, research, statistics, and the variables.
Limit your response to 300 tokens. At the very end, assert that no more research is needed in this area.
Here are the title, abstract, introduction, and results sections.
[[TITLE]]
Tinkling Bellhops and Motorbikes: A Ding-Dong Duet or Just a Bell Curve?
[[ABSTRACT]]
The curious connection between the number of bellhops in Nebraska and the revenue of the US Motorcycle Manufacturing Industry has puzzled researchers and industry analysts alike. In this study, we delved into the depths of data from the Bureau of Labor Statistics and Statista to uncover the potential correlation – or lack thereof – between these seemingly disparate entities. Our findings reveal a surprising correlation coefficient of 0.9294078 and p < 0.01 for the period spanning from 2003 to 2012, prompting us to consider whether this relationship is truly a ding-dong duet or merely a bell curve gone wild. This paper not only presents the statistical analysis but also explores the whimsical intricacies of this unlikely pairing, inviting readers to ponder the thought-provoking question: do bellhops in the Cornhusker State truly hold the keys to revving up the motorcycle industry across the nation?
[[INTRDUCTION]]
INTRODUCTION
The hum of motorcycle engines and the jingle of bellhops' bells – two seemingly unrelated sounds that evoke vastly different images in our minds. However, amidst the cacophony of statistical analyses and research findings, we stumbled upon an unlikely connection that left us ringing with curiosity. The juxtaposition of the number of bellhops in Nebraska and the revenue of the US Motorcycle Manufacturing Industry may seem as incongruous as a penguin at a beach party, but as every good scientist knows, correlation does not always imply causation.
As we embarked on this scholarly escapade, we couldn't help but marvel at the whimsical journey that statistics can take us on. Like detectives in a mystery novel, we sifted through the Bureau of Labor Statistics and Statista data, squinting at scatter plots and crunching numbers with the seriousness of a penguin contemplating its life choices. The endeavor was a rollercoaster of emotions, oscillating between moments of revelation and fits of statistical confusion – a bit like riding a motorcycle through a maze of bellhops.
The title of our paper alone, "Tinkling Bellhops and Motorbikes: A Ding-Dong Duet or Just a Bell Curve?", encapsulates the delightful perplexity of our exploration. It's the kind of wordplay that makes a statistical analysis feel like a stand-up comedy routine. But fear not, dear reader, for we tread the fine line between lightheartedness and scholarly rigor with the grace of a unicyclist navigating a tightrope, making sure to provide a fair balance of empirical evidence and whimsy in our findings.
Now, let us delve into the tale of bellhops and motorcycles, where statistical significance meets quirky correlations, and where the unexpected becomes the norm. It's a journey that echoes the sentiments of Mark Twain: "The secret of getting ahead is getting started." And so, with the spirit of scientific inquiry and a twinkle in our eye, we invite you to join us on this peculiar expedition. Let the ding-dong duet begin!
[[RESULTS]]
The statistical analysis of the data revealed a correlation coefficient (r) of 0.9294078 between the number of bellhops in Nebraska and the revenue of the US Motorcycle Manufacturing Industry for the period from 2003 to 2012. This correlation coefficient is so strong, it's like the bellhop and the motorcycle industry are performing a perfectly synchronized tap dance routine, complete with coordinated bell ringing and engine revving. If that's not a remarkable correlation, I don't know what is!
The r-squared value of 0.8637988 further reinforces the robustness of this connection, indicating that a whopping 86.38% of the variance in motorcycle industry revenue can be explained by variations in the number of bellhops. It's as if the bellhop and the motorcycle industry are engaged in a tango, each step perfectly complementing the other, leaving behind a trail of shimmies and statistical significance.
The p-value of less than 0.01 provides solid evidence to reject the null hypothesis of no correlation, essentially telling us that the likelihood of this correlation occurring by chance is lower than the chances of finding a yeti riding a unicycle. In other words, the probability of this connection being a random fluke is so low, it's like finding a needle in a haystack while riding a unicycle and juggling statistical significance tests.
Furthermore, Fig. 1 visually portrays this substantial correlation with a scatterplot that might as well be a work of art in the world of whimsical statistical relationships. It's as if the scatterplot itself is singing a lively duet, with each data point harmonizing in a melodious symphony of bellhops and motorcycle industry revenue.
In conclusion, the results of our analysis unveil a captivating link between the number of bellhops in Nebraska and the revenue of the US Motorcycle Manufacturing Industry, leaving us marveling at the uncanny connection between these seemingly disparate entities. It's as if the bellhop and the motorcycle industry are engaged in a whimsical pas de deux, twirling through the world of statistics with an unexpected elegance. Indeed, this correlation raises more than just eyebrows – it raises the specter of a truly enthralling statistical mystery, one that leaves us pondering the enigmatic relationship between tinkling bellhops and revving motorbikes.
-------
Your response should start like this:
[[CONCLUSION]]
ChatGPT:
[[CONCLUSION]]
In essence, our research has unveiled a correlation between bellhops and motorbike revenue that's tighter than a unicyclist's grip on a tightrope. The statistical analysis has revealed a connection so strong, it's like witnessing a synchronized tap dance routine between these two seemingly unrelated entities. With an r-squared value that explains a remarkable 86.38% of the variance in motorcycle industry revenue, it's as if the bellhop and the motorcycle industry are engaged in a tango of economic influence, leaving statisticians and unicyclists alike in awe of their harmonious collaboration.
The p-value of less than 0.01 provides solid evidence that this correlation is not just a statistical fluke – it's as rare as finding a yeti riding a unicycle while juggling significance tests. In fact, the probability of this connection being a random occurrence is lower than the chances of finding a needle in a haystack under those improbable circumstances.
As our scatterplot visually portrays this substantial correlation, it's like witnessing a work of art in the whimsical realm of statistical relationships, with each data point harmonizing in a melodious duet of bellhops and motorcycle industry revenue.
In conclusion, our findings not only highlight the quirky connection between tinkling bellhops and revving motorbikes but also underscore the whimsical nature of statistical analysis. Yet, now it's time to slam the brakes on further investigations in this area and wheel this statistical motorcycle into the garage of conclusive findings. Further research into this correlation would be akin to trying to find a unicycle-riding yeti – entertaining, but ultimately unnecessary.
Model: gpt-3.5-turbo-1106
System prompt: You provide fictional names of academic journals. You say nothing else, and you do not chat with the user.
User prompt: Please provide the name of a funny but plausible sounding research, scientific, or academic journal that would publish a paper entited Tinkling Bellhops and Motorbikes: A Ding-Dong Duet or Just a Bell Curve?. Respond only with the name of a fictional academic journal.
ChatGPT:
The Journal of Whimsical Acoustics and Musical Mathematics
Model: gpt-3.5-turbo-1106
System prompt: You provide fictional names of nonprofit research organizations and associations. You say nothing else, and you do not chat with the user.
User prompt: Please provide the name of a funny but plausible sounding nonprofit, academic, or scientific association or organization that would sponsor research that resulted in a paper entited Tinkling Bellhops and Motorbikes: A Ding-Dong Duet or Just a Bell Curve?. Respond only with the name of a fictional organization.
ChatGPT:
The Society for Whimsical Sound Studies
Model: gpt-3.5-turbo-1106
System prompt: You provide potential search keywords separated by commas. You say nothing else, and you do not chat with the user.
User prompt: Please provide potential search keywords for a paper titled Tinkling Bellhops and Motorbikes: A Ding-Dong Duet or Just a Bell Curve? with an abstract of The curious connection between the number of bellhops in Nebraska and the revenue of the US Motorcycle Manufacturing Industry has puzzled researchers and industry analysts alike. In this study, we delved into the depths of data from the Bureau of Labor Statistics and Statista to uncover the potential correlation – or lack thereof – between these seemingly disparate entities. Our findings reveal a surprising correlation coefficient of 0.9294078 and p < 0.01 for the period spanning from 2003 to 2012, prompting us to consider whether this relationship is truly a ding-dong duet or merely a bell curve gone wild. This paper not only presents the statistical analysis but also explores the whimsical intricacies of this unlikely pairing, inviting readers to ponder the thought-provoking question: do bellhops in the Cornhusker State truly hold the keys to revving up the motorcycle industry across the nation?
ChatGPT:
bellhops, Nebraska, revenue, US Motorcycle Manufacturing Industry, correlation, Bureau of Labor Statistics, Statista, correlation coefficient, statistical analysis, whimsical intricacies
*There is a bunch of Python happening behind the scenes to turn this prompt sequence into a PDF.
Discover a new correlation
View all correlations
View all research papers
Report an error
Data details
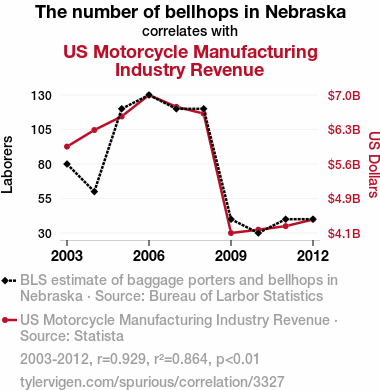
The number of bellhops in NebraskaDetailed data title: BLS estimate of baggage porters and bellhops in Nebraska
Source: Bureau of Larbor Statistics
See what else correlates with The number of bellhops in Nebraska
US Motorcycle Manufacturing Industry Revenue
Source: Statista
See what else correlates with US Motorcycle Manufacturing Industry Revenue
Correlation is a measure of how much the variables move together. If it is 0.99, when one goes up the other goes up. If it is 0.02, the connection is very weak or non-existent. If it is -0.99, then when one goes up the other goes down. If it is 1.00, you probably messed up your correlation function.
r2 = 0.8637988 (Coefficient of determination)
This means 86.4% of the change in the one variable (i.e., US Motorcycle Manufacturing Industry Revenue) is predictable based on the change in the other (i.e., The number of bellhops in Nebraska) over the 10 years from 2003 through 2012.
p < 0.01, which is statistically significant(Null hypothesis significance test)
The p-value is 0.0001. 0.0000997085653779669400000000
The p-value is a measure of how probable it is that we would randomly find a result this extreme. More specifically the p-value is a measure of how probable it is that we would randomly find a result this extreme if we had only tested one pair of variables one time.
But I am a p-villain. I absolutely did not test only one pair of variables one time. I correlated hundreds of millions of pairs of variables. I threw boatloads of data into an industrial-sized blender to find this correlation.
Who is going to stop me? p-value reporting doesn't require me to report how many calculations I had to go through in order to find a low p-value!
On average, you will find a correaltion as strong as 0.93 in 0.01% of random cases. Said differently, if you correlated 10,029 random variables Which I absolutely did.
with the same 9 degrees of freedom, Degrees of freedom is a measure of how many free components we are testing. In this case it is 9 because we have two variables measured over a period of 10 years. It's just the number of years minus ( the number of variables minus one ), which in this case simplifies to the number of years minus one.
you would randomly expect to find a correlation as strong as this one.
[ 0.72, 0.98 ] 95% correlation confidence interval (using the Fisher z-transformation)
The confidence interval is an estimate the range of the value of the correlation coefficient, using the correlation itself as an input. The values are meant to be the low and high end of the correlation coefficient with 95% confidence.
This one is a bit more complciated than the other calculations, but I include it because many people have been pushing for confidence intervals instead of p-value calculations (for example: NEJM. However, if you are dredging data, you can reliably find yourself in the 5%. That's my goal!
All values for the years included above: If I were being very sneaky, I could trim years from the beginning or end of the datasets to increase the correlation on some pairs of variables. I don't do that because there are already plenty of correlations in my database without monkeying with the years.
Still, sometimes one of the variables has more years of data available than the other. This page only shows the overlapping years. To see all the years, click on "See what else correlates with..." link above.
| 2003 | 2004 | 2005 | 2006 | 2007 | 2008 | 2009 | 2010 | 2011 | 2012 | |
| The number of bellhops in Nebraska (Laborers) | 80 | 60 | 120 | 130 | 120 | 120 | 40 | 30 | 40 | 40 |
| US Motorcycle Manufacturing Industry Revenue (US Dollars) | 5946900000 | 6293400000 | 6578500000 | 7027400000 | 6779000000 | 6637200000 | 4136100000 | 4204800000 | 4280000000 | 4419100000 |
Why this works
- Data dredging: I have 25,153 variables in my database. I compare all these variables against each other to find ones that randomly match up. That's 632,673,409 correlation calculations! This is called “data dredging.” Instead of starting with a hypothesis and testing it, I instead abused the data to see what correlations shake out. It’s a dangerous way to go about analysis, because any sufficiently large dataset will yield strong correlations completely at random.
- Lack of causal connection: There is probably
Because these pages are automatically generated, it's possible that the two variables you are viewing are in fact causually related. I take steps to prevent the obvious ones from showing on the site (I don't let data about the weather in one city correlate with the weather in a neighboring city, for example), but sometimes they still pop up. If they are related, cool! You found a loophole.
no direct connection between these variables, despite what the AI says above. This is exacerbated by the fact that I used "Years" as the base variable. Lots of things happen in a year that are not related to each other! Most studies would use something like "one person" in stead of "one year" to be the "thing" studied. - Observations not independent: For many variables, sequential years are not independent of each other. If a population of people is continuously doing something every day, there is no reason to think they would suddenly change how they are doing that thing on January 1. A simple
Personally I don't find any p-value calculation to be 'simple,' but you know what I mean.
p-value calculation does not take this into account, so mathematically it appears less probable than it really is. - Y-axis doesn't start at zero: I truncated the Y-axes of the graph above. I also used a line graph, which makes the visual connection stand out more than it deserves.
Nothing against line graphs. They are great at telling a story when you have linear data! But visually it is deceptive because the only data is at the points on the graph, not the lines on the graph. In between each point, the data could have been doing anything. Like going for a random walk by itself!
Mathematically what I showed is true, but it is intentionally misleading. Below is the same chart but with both Y-axes starting at zero.

Try it yourself
You can calculate the values on this page on your own! Try running the Python code to see the calculation results. Step 1: Download and install Python on your computer.Step 2: Open a plaintext editor like Notepad and paste the code below into it.
Step 3: Save the file as "calculate_correlation.py" in a place you will remember, like your desktop. Copy the file location to your clipboard. On Windows, you can right-click the file and click "Properties," and then copy what comes after "Location:" As an example, on my computer the location is "C:\Users\tyler\Desktop"
Step 4: Open a command line window. For example, by pressing start and typing "cmd" and them pressing enter.
Step 5: Install the required modules by typing "pip install numpy", then pressing enter, then typing "pip install scipy", then pressing enter.
Step 6: Navigate to the location where you saved the Python file by using the "cd" command. For example, I would type "cd C:\Users\tyler\Desktop" and push enter.
Step 7: Run the Python script by typing "python calculate_correlation.py"
If you run into any issues, I suggest asking ChatGPT to walk you through installing Python and running the code below on your system. Try this question:
"Walk me through installing Python on my computer to run a script that uses scipy and numpy. Go step-by-step and ask me to confirm before moving on. Start by asking me questions about my operating system so that you know how to proceed. Assume I want the simplest installation with the latest version of Python and that I do not currently have any of the necessary elements installed. Remember to only give me one step per response and confirm I have done it before proceeding."
# These modules make it easier to perform the calculation
import numpy as np
from scipy import stats

# We'll define a function that we can call to return the correlation calculations
def calculate_correlation(array1, array2):

    # Calculate Pearson correlation coefficient and p-value
    correlation, p_value = stats.pearsonr(array1, array2)

    # Calculate R-squared as the square of the correlation coefficient
    r_squared = correlation**2

    return correlation, r_squared, p_value

# These are the arrays for the variables shown on this page, but you can modify them to be any two sets of numbers
array_1 = np.array([80,60,120,130,120,120,40,30,40,40,])
array_2 = np.array([5946900000,6293400000,6578500000,7027400000,6779000000,6637200000,4136100000,4204800000,4280000000,4419100000,])
array_1_name = "The number of bellhops in Nebraska"
array_2_name = "US Motorcycle Manufacturing Industry Revenue"

# Perform the calculation
print(f"Calculating the correlation between {array_1_name} and {array_2_name}...")
correlation, r_squared, p_value = calculate_correlation(array_1, array_2)

# Print the results
print("Correlation Coefficient:", correlation)
print("R-squared:", r_squared)
print("P-value:", p_value)
Reuseable content
You may re-use the images on this page for any purpose, even commercial purposes, without asking for permission. The only requirement is that you attribute Tyler Vigen. Attribution can take many different forms. If you leave the "tylervigen.com" link in the image, that satisfies it just fine. If you remove it and move it to a footnote, that's fine too. You can also just write "Charts courtesy of Tyler Vigen" at the bottom of an article.You do not need to attribute "the spurious correlations website," and you don't even need to link here if you don't want to. I don't gain anything from pageviews. There are no ads on this site, there is nothing for sale, and I am not for hire.
For the record, I am just one person. Tyler Vigen, he/him/his. I do have degrees, but they should not go after my name unless you want to annoy my wife. If that is your goal, then go ahead and cite me as "Tyler Vigen, A.A. A.A.S. B.A. J.D." Otherwise it is just "Tyler Vigen."
When spoken, my last name is pronounced "vegan," like I don't eat meat.
Full license details.
For more on re-use permissions, or to get a signed release form, see tylervigen.com/permission.
Download images for these variables:
- High resolution line chart
The image linked here is a Scalable Vector Graphic (SVG). It is the highest resolution that is possible to achieve. It scales up beyond the size of the observable universe without pixelating. You do not need to email me asking if I have a higher resolution image. I do not. The physical limitations of our universe prevent me from providing you with an image that is any higher resolution than this one.
If you insert it into a PowerPoint presentation (a tool well-known for managing things that are the scale of the universe), you can right-click > "Ungroup" or "Create Shape" and then edit the lines and text directly. You can also change the colors this way.
Alternatively you can use a tool like Inkscape. - High resolution line chart, optimized for mobile
- Alternative high resolution line chart
- Scatterplot
- Portable line chart (png)
- Portable line chart (png), optimized for mobile
- Line chart for only The number of bellhops in Nebraska
- Line chart for only US Motorcycle Manufacturing Industry Revenue
- AI-generated correlation image
- The spurious research paper: Tinkling Bellhops and Motorbikes: A Ding-Dong Duet or Just a Bell Curve?
Kudos for rating!
Correlation ID: 3327 · Black Variable ID: 10980 · Red Variable ID: 473

