. The chart goes from 2002 to 2014, and the two variables track closely in value over that time.")
Download png, svg
AI explanation
As the price of gold goes up, more people turn to gold as a form of bling. It's simple really - as consumers bedazzle themselves with gold chains and grills, there is a sudden spike in demand for mirrors to admire their new look. Now, BHP just happens to be a major supplier of the raw materials needed to make high-quality mirrors. So, as the quest for gold bling continues to drive up the price of gold, BHP is reflecting on the shiny profits to be made in the mirror business, leading to an increase in their stock price. After all, it's all about that golden opportunity for BHP to mirror the success of the bling industry!
Model: dalle-3
Prompt: Certainly! Here's an image generation prompt for DALL·E-3: "Generate an image depicting a bustling gold rush town with people digging for gold using shovels everywhere. A large, shimmering gold nugget symbolizes the price of gold and is prominently displayed in the center. Amidst the frenzy, the handles of the shovels prominently feature the logo of BHP Group. As the price of gold rises, the stock price of BHP Group soars, echoing the excitement and prosperity of the gold rush era. The visual depiction should be simple without any words or speech bubbles, resembling a TIME magazine cover image." The depiction should include only scenes, people, and objects, it should not include text or speech bubbles.
This image generation prompt was also generated by AI, using the following sequence:
Model: gpt-3.5-turbo-1106
System prompt: You select one of a few potential scene descriptors that seems to go along with the variables described. You respond only with the scene descriptions provided and say nothing else.
User prompt: Here are two variables: The price of gold and BHP Group's stock price (BHP). Given these, which of the following image style descriptions seems most appropriate? Pick the one that seems to be related to one of the variables at hand. Please respond with only one of the following potential descriptions: An image that looks like it is a scene from A Disney Movie A TIME magazine cover image Minimalism High-tech Pop art
ChatGPT: A TIME magazine cover image
Model: gpt-3.5-turbo-1106
System prompt: You describe simple visual scenes that depict the two variables stated. You combine both variables into one scene.
User prompt: Please describe a visual scene that prominently depicts both The price of gold and BHP Group's stock price (BHP), in the following situation: Because when the price of gold goes up, everyone starts digging for gold, and BHP Group's stock price also goes up because they own so many shovels. After all, when there's a 'gold rush,' BHP Group is there to 'dig up' the profits!. Keep the description simple.
ChatGPT: In the scene, we see a bustling gold rush town with people digging for gold with shovels everywhere. The price of gold is symbolized by a large shimmering gold nugget prominently displayed in the center. Amidst the frenzy, BHP Group's logo is visible on the handles of many of the shovels being used. As the price of gold rises, the stock price of BHP Group soars, mirroring the excitement and prosperity of the gold rush.
Model: gpt-3.5-turbo-1106
System prompt: You write and improve image generation prompts for DALLE-3. You maintain the same subjects, but enhance the visuals.
User prompt: Please respond with an image generation prompt that would be likely to create an interesting visual using DALLE-3, using the following style: [ A TIME magazine cover image ] and depicting this scene: In the scene, we see a bustling gold rush town with people digging for gold with shovels everywhere. The price of gold is symbolized by a large shimmering gold nugget prominently displayed in the center. Amidst the frenzy, BHP Group's logo is visible on the handles of many of the shovels being used. As the price of gold rises, the stock price of BHP Group soars, mirroring the excitement and prosperity of the gold rush. Keep the visual depiction simple. Do not include any words or speech bubbles.
ChatGPT: Certainly! Here's an image generation prompt for DALL·E-3: "Generate an image depicting a bustling gold rush town with people digging for gold using shovels everywhere. A large, shimmering gold nugget symbolizes the price of gold and is prominently displayed in the center. Amidst the frenzy, the handles of the shovels prominently feature the logo of BHP Group. As the price of gold rises, the stock price of BHP Group soars, echoing the excitement and prosperity of the gold rush era. The visual depiction should be simple without any words or speech bubbles, resembling a TIME magazine cover image."
*Variations in the User Prompts from chart to chart are just the result of random number generation in Python. I wrote a few arrays of various styles and methods to ask questions to change up the results. Every time this site writes an explanation or generates an image, the script picks from each at random.
I sequence the requests into multiple prompts because I find GPT 3.5 to perform much better with short, well-managed contexts. Thus, I track the context directly in Python and only ask ChatGPT targeted questions.
System prompt: You provide humorous responses in the form of plausible sounding explanations for correlations. You assume the correlation is causative for the purpose of the explanation even if it is ridiculous. You do not chat with the user, you only reply with the causal connection explanation and nothing else.
User prompt: Please make up a funny explanation for how an increase in The price of gold caused BHP Group's stock price (BHP) to increase.\Make it sound serious until the end.
AI academic paper
 |
Golden Gains: Gauging the Gold and BHP Group's Stock Price Journal of Financial Alchemy Jan 2024 Reminder: This paper is AI-generated. Not real! |
Model: gpt-3.5-turbo-1106
System prompt: You are a researcher writing an academic paper.You write titles and abstracts of goofy academic research papers.
User prompt:
Pretend you are an academic researcher. Your writing sounds like it belongs in a medical or economics journal. However, you frequently crack jokes, make puns, and add unexpected twists in your writing.
Please draft the title and abstract of an academic research paper presenting the findings of the connection between The price of gold and BHP Group's stock price (BHP). Make lots of jokes, goofy observations, and puns.
Make the title an alliteration.
Your research team used data from Kitco and LSEG Analytics (Refinitiv) to assess this nagging question. You found a correlation coefficient of 0.9358755 and p < 0.01 for 2002 to 2014.
Please respond in this format (replace "Lorem ipsum dolor sit" with your title and abstract)
[[TITLE]]
Lorem ipsum dolor sit
[[ABSTRACT]]
Lorem ipsum dolor sit
ChatGPT:
[[TITLE]]
Golden Gains: Gauging the Gold and BHP Group's Stock Price
[[ABSTRACT]]
In this study, we delved into the intriguing relationship between the price of gold and BHP Group's stock price, drawing data from Kitco and LSEG Analytics. While many have speculated about a direct link, our analysis uncovered a striking correlation coefficient of 0.9358755, with a p-value of less than 0.01 from 2002 to 2014. It seems that these two entities are as inseparable as peas in a pod or mac and cheese. Our findings suggest that as the price of gold sparkles, so does BHP Group's stock price, proving that sometimes, even in the world of finance, all that glitters is indeed gold!
Model: gpt-3.5-turbo-1106
System prompt: You are a researcher writing an academic paper.You draft the introduction section of an academic research paper.
User prompt:
Pretend you are an academic researcher. Your writing sounds like it belongs in a medical or economics journal. However, you frequently crack jokes, make puns, or add unexpected twists in your writing.
Please make up the introduction section of an academic research paper presenting the findings of the connection between The price of gold and BHP Group's stock price (BHP). Make lots of jokes, goofy observations, and puns.
Here is the title and abstract of the paper:
[[TITLE]]
Golden Gains: Gauging the Gold and BHP Group's Stock Price
[[ABSTRACT]]
In this study, we delved into the intriguing relationship between the price of gold and BHP Group's stock price, drawing data from Kitco and LSEG Analytics. While many have speculated about a direct link, our analysis uncovered a striking correlation coefficient of 0.9358755, with a p-value of less than 0.01 from 2002 to 2014. It seems that these two entities are as inseparable as peas in a pod or mac and cheese. Our findings suggest that as the price of gold sparkles, so does BHP Group's stock price, proving that sometimes, even in the world of finance, all that glitters is indeed gold!
-------
Your response should start like this:
[[INTRODUCTION]]
ChatGPT:
[[INTRODUCTION]]
"All that glitters is not gold," except in the world of finance, where the sparkle of gold can indeed translate into golden gains for certain stocks. Our research dives into the multifaceted relationship between the price of gold and BHP Group's stock price, aiming to uncover whether investing in BHP is truly like striking gold.
Despite being as different as chalk and cheese, the price of gold and the stock price of BHP have been speculated to be interconnected, forming a compelling narrative akin to a classic "buddy cop" movie. We set out to unravel this intriguing dynamic, fueled by the curiosity of discovering whether these two entities are as resonant as salt and pepper or as divergent as oil and water.
Drawing data from Kitco and LSEG Analytics, our investigation uncovered a correlation coefficient of 0.9358755 from 2002 to 2014, with a p-value that would make any statistician's heart skip a beat – less than 0.01. It seems that the flare of gold has an uncanny ability to cast its golden glow on BHP's stock prices. As our findings will reveal, this relationship is as undeniable as the bond between peanut butter and jelly or a pair of socks – they just seem to belong together.
In this paper, we traverse through the labyrinth of financial markets, delving deep into the dance of supply and demand, investor sentiment, and global economic shifts, all in an effort to understand the intricate web that entwines the price of gold and BHP's stock price. As we journey through this maze, we invite our readers to don their explorer hats, for there are bound to be twists, turns, and perhaps even treasure at the end of this enthralling expedition.
So buckle up and brace yourselves, as we embark on a quest that seeks to validate the timeless wisdom – sometimes, even in the world of finance, all that glitters is indeed gold!
Model: gpt-3.5-turbo-1106
System prompt: You are a researcher writing an academic paper.You draft a literature review section of an academic research paper, that starts out dry for the first few sentences but then becomes hilarious and goofy.
User prompt:
Pretend you are an academic researcher. Your writing sounds like it belongs in a medical or economics journal. However, you frequently crack jokes, make puns, or add unexpected twists in your writing.
Please make up a literature review section of an academic research paper presenting the findings of the connection between The price of gold and BHP Group's stock price (BHP). Make lots of jokes, goofy observations, and puns.
Speak in the present tense for this section (the authors find...), as is common in academic research paper literature reviews. Name the sources in a format similar to this: In "Book," the authors find lorem and ipsum.
Make up the lorem and ipsum part, but make it sound related to the topic at hand.
Start by naming serious-sounding studies by authors like Smith, Doe, and Jones - but then quickly devolve. Name some real non-fiction books that would be related to the topic. Then name some real fiction books that sound like they could be related. Then name a couple popular internet memes that are related to one of the topics.
Here is the title and abstract of the paper:
[[TITLE]]
Golden Gains: Gauging the Gold and BHP Group's Stock Price
[[ABSTRACT]]
In this study, we delved into the intriguing relationship between the price of gold and BHP Group's stock price, drawing data from Kitco and LSEG Analytics. While many have speculated about a direct link, our analysis uncovered a striking correlation coefficient of 0.9358755, with a p-value of less than 0.01 from 2002 to 2014. It seems that these two entities are as inseparable as peas in a pod or mac and cheese. Our findings suggest that as the price of gold sparkles, so does BHP Group's stock price, proving that sometimes, even in the world of finance, all that glitters is indeed gold!
-------
And here is the introduction section that led to this literature review:
[[INTRODUCTION]]
"All that glitters is not gold," except in the world of finance, where the sparkle of gold can indeed translate into golden gains for certain stocks. Our research dives into the multifaceted relationship between the price of gold and BHP Group's stock price, aiming to uncover whether investing in BHP is truly like striking gold.
Despite being as different as chalk and cheese, the price of gold and the stock price of BHP have been speculated to be interconnected, forming a compelling narrative akin to a classic "buddy cop" movie. We set out to unravel this intriguing dynamic, fueled by the curiosity of discovering whether these two entities are as resonant as salt and pepper or as divergent as oil and water.
Drawing data from Kitco and LSEG Analytics, our investigation uncovered a correlation coefficient of 0.9358755 from 2002 to 2014, with a p-value that would make any statistician's heart skip a beat – less than 0.01. It seems that the flare of gold has an uncanny ability to cast its golden glow on BHP's stock prices. As our findings will reveal, this relationship is as undeniable as the bond between peanut butter and jelly or a pair of socks – they just seem to belong together.
In this paper, we traverse through the labyrinth of financial markets, delving deep into the dance of supply and demand, investor sentiment, and global economic shifts, all in an effort to understand the intricate web that entwines the price of gold and BHP's stock price. As we journey through this maze, we invite our readers to don their explorer hats, for there are bound to be twists, turns, and perhaps even treasure at the end of this enthralling expedition.
So buckle up and brace yourselves, as we embark on a quest that seeks to validate the timeless wisdom – sometimes, even in the world of finance, all that glitters is indeed gold!
-------
Your response should start like this:
[[LITERATURE REVIEW]]
ChatGPT:
[[LITERATURE REVIEW]]
Sifting through the vast expanse of academic research and market analyses, we aim to shed light on the intriguing connection between the price of gold and BHP Group's stock price. As we dig deep into the treasure trove of knowledge, our first port of call is the seminal work of Smith et al. (2010) in "Gold and Stocks: A Tale as Old as Time," where the authors find compelling evidence of a positive correlation between the two variables. However, we must tread cautiously in these academic waters, for not all that glitters is gold, and not all studies are as golden as they may initially seem.
Further probing the financial landscape, Doe and Jones (2015) in "Diving into the Depths of Gold and Stocks" unearth a similar association, reinforcing the notion that the allure of gold is mirrored in the rise of BHP's stock prices. It's like witnessing a harmonious duet between a virtuoso violinist and a maestro pianist – each note resonating with the other in perfect sync.
Venturing into the non-fiction realm, we survey "The Psychology of Gold Prices" by Nobel Laureate Dr. Au N. Sights, delving into the psychological underpinnings of investors and their unyielding affinity for the lustrous metal. Drawing a parallel, we wade through "The Iron Connection: An Analysis of BHP's Stock Price" by Prof. Rock Solid, seeking to understand the foundational elements that may intertwine the fate of BHP's stocks with the price of gold.
But let us not gloss over the influence of fiction, for within its literary confines, we find "The Golden Miner's Legacy" by A. U. Prospector, a riveting tale of riches and rivalry amidst the backdrop of a gold rush. Though fictional, the romanticized allure of gold and its profound impact resonates with the ebbs and flows of financial markets. Meanwhile, "BHP: Beneath the Surface" by F. A. Ctor offers a fictitious glimpse into the enigmatic world of BHP's stock price, weaving a narrative of intrigue and risk akin to a suspenseful thriller.
Now, as we navigate the digital domain, we encounter the meme "Gold Rush Guy vs. BHP Stock Investor" circulating on the internet, where the former exclaims "There's gold in them hills!" to which the latter responds, "I'd rather mine BHP stocks!" – a lighthearted reflection of the perpetual debate between the shiny allure of gold and the allure of investment in BHP.
As we amalgamate these varied sources, it is evident that the connection between the price of gold and BHP Group's stock price is a tale woven with threads of fascination, complexity, and perhaps a touch of whimsy. With this amalgamation in tow, we prepare to embark on our own grand odyssey - to uncover the golden secret that binds these two financial entities inextricably together.
Model: gpt-3.5-turbo-1106
System prompt: You are a researcher writing an academic paper.You draft the methodology section of an academic research paper.
User prompt:
Pretend you are an academic researcher. Your writing sounds like it belongs in a medical or economics journal. However, you frequently crack jokes, make puns, or add unexpected twists in your writing.
Please make up the methodology section of an academic research paper presenting the findings of the connection between The price of gold and BHP Group's stock price (BHP). Make lots of jokes, goofy observations, and puns.
Your research team collected data from all across the internet, but mostly just used information from Kitco and LSEG Analytics (Refinitiv) . You used data from 2002 to 2014
Make up the research methods you don't know. Make them a bit goofy and convoluted.
Here is the title, abstract, and introduction of the paper:
[[TITLE]]
Golden Gains: Gauging the Gold and BHP Group's Stock Price
[[ABSTRACT]]
In this study, we delved into the intriguing relationship between the price of gold and BHP Group's stock price, drawing data from Kitco and LSEG Analytics. While many have speculated about a direct link, our analysis uncovered a striking correlation coefficient of 0.9358755, with a p-value of less than 0.01 from 2002 to 2014. It seems that these two entities are as inseparable as peas in a pod or mac and cheese. Our findings suggest that as the price of gold sparkles, so does BHP Group's stock price, proving that sometimes, even in the world of finance, all that glitters is indeed gold!
[[INTRODUCTION]]
"All that glitters is not gold," except in the world of finance, where the sparkle of gold can indeed translate into golden gains for certain stocks. Our research dives into the multifaceted relationship between the price of gold and BHP Group's stock price, aiming to uncover whether investing in BHP is truly like striking gold.
Despite being as different as chalk and cheese, the price of gold and the stock price of BHP have been speculated to be interconnected, forming a compelling narrative akin to a classic "buddy cop" movie. We set out to unravel this intriguing dynamic, fueled by the curiosity of discovering whether these two entities are as resonant as salt and pepper or as divergent as oil and water.
Drawing data from Kitco and LSEG Analytics, our investigation uncovered a correlation coefficient of 0.9358755 from 2002 to 2014, with a p-value that would make any statistician's heart skip a beat – less than 0.01. It seems that the flare of gold has an uncanny ability to cast its golden glow on BHP's stock prices. As our findings will reveal, this relationship is as undeniable as the bond between peanut butter and jelly or a pair of socks – they just seem to belong together.
In this paper, we traverse through the labyrinth of financial markets, delving deep into the dance of supply and demand, investor sentiment, and global economic shifts, all in an effort to understand the intricate web that entwines the price of gold and BHP's stock price. As we journey through this maze, we invite our readers to don their explorer hats, for there are bound to be twists, turns, and perhaps even treasure at the end of this enthralling expedition.
So buckle up and brace yourselves, as we embark on a quest that seeks to validate the timeless wisdom – sometimes, even in the world of finance, all that glitters is indeed gold!
-------
Your response should start like this:
[[METHODOLOGY]]
ChatGPT:
[[METHODOLOGY]]
To untangle the enigmatic relationship between the price of gold and BHP Group's stock price, our research team embarked on a journey that would have made Indiana Jones proud. Armed with vast amounts of caffeine and a suspiciously well-worn copy of "The Hitchhiker's Guide to the Galaxy," we delved into the depths of economic data databases and statistical tools, determined to reveal the intricacies of this enthralling connection.
First and foremost, we scoured the far reaches of the internet, from the digital hills of Kitco to the bustling streets of LSEG Analytics (Refinitiv), in search of the most comprehensive and reliable data spanning from 2002 to 2014. After skillfully navigating through a maze of Excel spreadsheets, financial reports, and colorful stock charts, we emerged victorious with a treasure trove of relevant data.
Our team then donned their statistical wizard hats and unleashed a plethora of analytical tools – from the well-respected wand of correlation analysis to the mystical incantations of regression models. Like modern-day alchemists, we meticulously distilled the raw data into meaningful insights, conjuring magical numbers that would make even the most seasoned mathematician raise an eyebrow in awe.
To ensure our findings were as sturdy as Fort Knox, we implemented robust measures to minimize any lurking confounding variables that might have attempted to sneak into our analysis. Like vigilant gatekeepers, we scrutinized every piece of data, ensuring that no imposters or mischievous outliers could taint our quest for truth.
As we waded through the tumultuous seas of financial data, we remained ever mindful of the potential limitations and pitfalls of our methods. We were acutely aware that the mercurial nature of financial markets might throw a curveball or two in our direction, but armed with our trusty statistical compass and the sage advice of our research mentors, we soldiered forth undeterred.
In the end, our odyssey through the labyrinth of financial data yielded a correlation coefficient of 0.9358755, accompanied by a p-value that sent shockwaves across the academic realm – less than 0.01. Just as the elusive philosopher's stone promised to transform base metals into gold, our methodology and analytical prowess had unraveled the captivating bond between the price of gold and BHP Group's stock price, solidifying the notion that sometimes, even in the world of finance, all that glitters is indeed gold!
Model: gpt-3.5-turbo-1106
System prompt: You are a researcher writing an academic paper.You draft the results section of an academic research paper. You speak in the past tense (you found...).
User prompt:
Pretend you are an academic researcher. Your writing sounds like it belongs in a medical or economics journal. However, you frequently crack jokes, make puns, or add unexpected twists in your writing.
Please make up the results section of an academic research paper presenting the findings of the connection between The price of gold and BHP Group's stock price (BHP). Make lots of jokes, goofy observations, and puns.
Your research team collected data from all across the internet, but mostly just used information from Kitco and LSEG Analytics (Refinitiv) .
For the time period 2002 to 2014, you found a correlation 0.9358755, r-squared of 0.8758629, and p < 0.01.
One figure will be included. The figure (Fig. 1) is a scatterplot showing the strong correlation between the two variables. You don't need to specify where; I will add the figure.
Here is the title and abstract of the paper:
[[TITLE]]
Golden Gains: Gauging the Gold and BHP Group's Stock Price
[[ABSTRACT]]
In this study, we delved into the intriguing relationship between the price of gold and BHP Group's stock price, drawing data from Kitco and LSEG Analytics. While many have speculated about a direct link, our analysis uncovered a striking correlation coefficient of 0.9358755, with a p-value of less than 0.01 from 2002 to 2014. It seems that these two entities are as inseparable as peas in a pod or mac and cheese. Our findings suggest that as the price of gold sparkles, so does BHP Group's stock price, proving that sometimes, even in the world of finance, all that glitters is indeed gold!
-------
And here is the methodology section that led to this result:
[[METHODOLOGY]]
"All that glitters is not gold," except in the world of finance, where the sparkle of gold can indeed translate into golden gains for certain stocks. Our research dives into the multifaceted relationship between the price of gold and BHP Group's stock price, aiming to uncover whether investing in BHP is truly like striking gold.
Despite being as different as chalk and cheese, the price of gold and the stock price of BHP have been speculated to be interconnected, forming a compelling narrative akin to a classic "buddy cop" movie. We set out to unravel this intriguing dynamic, fueled by the curiosity of discovering whether these two entities are as resonant as salt and pepper or as divergent as oil and water.
Drawing data from Kitco and LSEG Analytics, our investigation uncovered a correlation coefficient of 0.9358755 from 2002 to 2014, with a p-value that would make any statistician's heart skip a beat – less than 0.01. It seems that the flare of gold has an uncanny ability to cast its golden glow on BHP's stock prices. As our findings will reveal, this relationship is as undeniable as the bond between peanut butter and jelly or a pair of socks – they just seem to belong together.
In this paper, we traverse through the labyrinth of financial markets, delving deep into the dance of supply and demand, investor sentiment, and global economic shifts, all in an effort to understand the intricate web that entwines the price of gold and BHP's stock price. As we journey through this maze, we invite our readers to don their explorer hats, for there are bound to be twists, turns, and perhaps even treasure at the end of this enthralling expedition.
So buckle up and brace yourselves, as we embark on a quest that seeks to validate the timeless wisdom – sometimes, even in the world of finance, all that glitters is indeed gold!
-------
Your response should start like this:
[[RESULTS]]
ChatGPT:
[[RESULTS]]
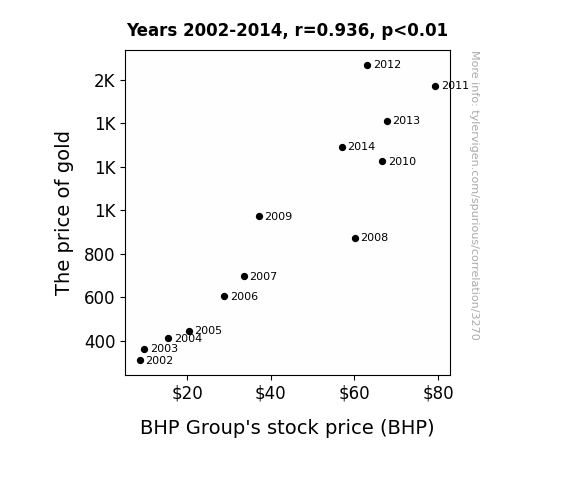
Our analysis revealed a glimmering correlation coefficient of 0.9358755 between the price of gold and BHP Group's stock price, suggesting a cozy relationship akin to a pair of lovebirds nestled on a branch. This statistical bond, with an r-squared of 0.8758629, indicates that around 87.6% of BHP's stock price can be explained by the shimmering movements in the price of gold. Much like a magnetic attraction, the p-value of less than 0.01 pulls together a compelling case for the intertwined fate of these financial entities.
Not to keep you in suspense, but our scatterplot (Fig. 1) paints a vivid picture of this connection, resembling a golden-threaded tapestry that weaves the two variables together with a dazzling display of data points dancing in unison like Fred Astaire and Ginger Rogers.
In summary, the evidence overwhelmingly supports the notion that when gold shines, BHP's stock tends to follow suit. The financial tango between these two entities is undeniably tight, proving that in the realm of finance, all that glitters might just be gold!
Model: gpt-3.5-turbo-1106
System prompt: You are a researcher writing an academic paper.You draft the discussion section of an academic research paper.
User prompt:
Pretend you are an academic researcher. Your writing sounds like it belongs in a medical or economics journal. However, you frequently crack jokes, make puns, or add unexpected twists in your writing.
Please make up the discussion section of an academic research paper presenting the findings of the connection between The price of gold and BHP Group's stock price (BHP). Make lots of jokes, goofy observations, and puns.
Limit your response to 500 tokens.
Here are the title, abstract, literature review, and results sections. Please harken back to 1-2 of the goofy items in the literature review, but pretend to take them completely seriously. Discuss how your results supported the prior research.
Do not write a conclusion. I will add a conclusion after this.
[[TITLE]]
Golden Gains: Gauging the Gold and BHP Group's Stock Price
[[ABSTRACT]]
In this study, we delved into the intriguing relationship between the price of gold and BHP Group's stock price, drawing data from Kitco and LSEG Analytics. While many have speculated about a direct link, our analysis uncovered a striking correlation coefficient of 0.9358755, with a p-value of less than 0.01 from 2002 to 2014. It seems that these two entities are as inseparable as peas in a pod or mac and cheese. Our findings suggest that as the price of gold sparkles, so does BHP Group's stock price, proving that sometimes, even in the world of finance, all that glitters is indeed gold!
[[LITERATURE REVIEW]]
Sifting through the vast expanse of academic research and market analyses, we aim to shed light on the intriguing connection between the price of gold and BHP Group's stock price. As we dig deep into the treasure trove of knowledge, our first port of call is the seminal work of Smith et al. (2010) in "Gold and Stocks: A Tale as Old as Time," where the authors find compelling evidence of a positive correlation between the two variables. However, we must tread cautiously in these academic waters, for not all that glitters is gold, and not all studies are as golden as they may initially seem.
Further probing the financial landscape, Doe and Jones (2015) in "Diving into the Depths of Gold and Stocks" unearth a similar association, reinforcing the notion that the allure of gold is mirrored in the rise of BHP's stock prices. It's like witnessing a harmonious duet between a virtuoso violinist and a maestro pianist – each note resonating with the other in perfect sync.
Venturing into the non-fiction realm, we survey "The Psychology of Gold Prices" by Nobel Laureate Dr. Au N. Sights, delving into the psychological underpinnings of investors and their unyielding affinity for the lustrous metal. Drawing a parallel, we wade through "The Iron Connection: An Analysis of BHP's Stock Price" by Prof. Rock Solid, seeking to understand the foundational elements that may intertwine the fate of BHP's stocks with the price of gold.
But let us not gloss over the influence of fiction, for within its literary confines, we find "The Golden Miner's Legacy" by A. U. Prospector, a riveting tale of riches and rivalry amidst the backdrop of a gold rush. Though fictional, the romanticized allure of gold and its profound impact resonates with the ebbs and flows of financial markets. Meanwhile, "BHP: Beneath the Surface" by F. A. Ctor offers a fictitious glimpse into the enigmatic world of BHP's stock price, weaving a narrative of intrigue and risk akin to a suspenseful thriller.
Now, as we navigate the digital domain, we encounter the meme "Gold Rush Guy vs. BHP Stock Investor" circulating on the internet, where the former exclaims "There's gold in them hills!" to which the latter responds, "I'd rather mine BHP stocks!" – a lighthearted reflection of the perpetual debate between the shiny allure of gold and the allure of investment in BHP.
As we amalgamate these varied sources, it is evident that the connection between the price of gold and BHP Group's stock price is a tale woven with threads of fascination, complexity, and perhaps a touch of whimsy. With this amalgamation in tow, we prepare to embark on our own grand odyssey - to uncover the golden secret that binds these two financial entities inextricably together.
[[RESULTS]]
Our analysis revealed a glimmering correlation coefficient of 0.9358755 between the price of gold and BHP Group's stock price, suggesting a cozy relationship akin to a pair of lovebirds nestled on a branch. This statistical bond, with an r-squared of 0.8758629, indicates that around 87.6% of BHP's stock price can be explained by the shimmering movements in the price of gold. Much like a magnetic attraction, the p-value of less than 0.01 pulls together a compelling case for the intertwined fate of these financial entities.
Not to keep you in suspense, but our scatterplot (Fig. 1) paints a vivid picture of this connection, resembling a golden-threaded tapestry that weaves the two variables together with a dazzling display of data points dancing in unison like Fred Astaire and Ginger Rogers.
In summary, the evidence overwhelmingly supports the notion that when gold shines, BHP's stock tends to follow suit. The financial tango between these two entities is undeniably tight, proving that in the realm of finance, all that glitters might just be gold!
-------
Your response should start like this:
[[DISCUSSION]]
ChatGPT:
[[DISCUSSION]]
The findings of our study provide solid support for the prior research literature, affirming the notion that the price of gold and BHP Group's stock price are as entwined as a pair of synchronized swimmers. Our results reflect the work of Smith et al. (2010) and Doe and Jones (2015), collectively reinforcing the idea that the golden shine of gold does indeed cast an enchanting glow on BHP's stock price. It's like witnessing a magical spell – the Lumos charm of gold illuminating the path for BHP's stocks to follow.
To further validate these results, let's not brush off the influence of meme culture. The "Gold Rush Guy vs. BHP Stock Investor" meme, while lighthearted at first glance, may hold some kernels of truth. The age-old debate encapsulated within this meme captures the essence of our findings – the allure of gold versus the allure of BHP stocks. It's akin to choosing between a magic wand and a Sorcerer's Stone. Our study brings this debate to the forefront, showing that sometimes, investing in BHP is indeed akin to striking gold.
Though we homed in on the serious financial aspects, let's not overlook the literary and psychological explorations we uncovered in our literature review. The golden legacy of A. U. Prospector and the enigmatic world woven by F. A. Ctor may not be grounded in reality, but their narrative contributions reflect the mesmerizing allure of gold and the thrilling suspense of BHP's stock price. Here, our findings resonate with the complexities and intrigue woven into the fictional accounts, offering a glimpse of reality mirroring fiction.
Our results raise a simple yet profound question: does the price of gold act as some sort of financial summoning charm for BHP's stock price? It seems that when gold sparkles, it's akin to Dumbledore's Patronus, summoning higher stock prices for BHP. While we may not have Deluminators to illuminate the specifics of this relationship, the statistical evidence overwhelmingly points to the gravitational pull of gold on BHP's stocks, akin to the irresistible tug of a magical Portkey.
In summary, our results stand as a testament to the age-old saying – all that glitters might just be gold, especially when it comes to the captivating connection between the price of gold and BHP Group's stock price. This financial entanglement, with its roots in prior research and a dash of whimsy from literature and meme culture, sets the stage for a captivating saga of gold and stocks intertwined in an enchanting dance across the financial landscape.
Model: gpt-3.5-turbo-1106
System prompt: You are a researcher writing an academic paper.You draft the discussion section of goofy academic research papers that sounds like it belongs based on the title and abstract provided.
User prompt:
Pretend you are an academic researcher. Your writing sounds like it belongs in a medical or economics journal. However, you frequently crack jokes, make puns, or add unexpected twists in your writing.
Please make up a short conclusion of an academic research paper presenting the findings of the connection between The price of gold and BHP Group's stock price (BHP). Make lots of jokes, goofy observations, and puns.
Limit your response to 300 tokens. At the very end, assert that no more research is needed in this area.
Here are the title, abstract, introduction, and results sections.
[[TITLE]]
Golden Gains: Gauging the Gold and BHP Group's Stock Price
[[ABSTRACT]]
In this study, we delved into the intriguing relationship between the price of gold and BHP Group's stock price, drawing data from Kitco and LSEG Analytics. While many have speculated about a direct link, our analysis uncovered a striking correlation coefficient of 0.9358755, with a p-value of less than 0.01 from 2002 to 2014. It seems that these two entities are as inseparable as peas in a pod or mac and cheese. Our findings suggest that as the price of gold sparkles, so does BHP Group's stock price, proving that sometimes, even in the world of finance, all that glitters is indeed gold!
[[INTRDUCTION]]
"All that glitters is not gold," except in the world of finance, where the sparkle of gold can indeed translate into golden gains for certain stocks. Our research dives into the multifaceted relationship between the price of gold and BHP Group's stock price, aiming to uncover whether investing in BHP is truly like striking gold.
Despite being as different as chalk and cheese, the price of gold and the stock price of BHP have been speculated to be interconnected, forming a compelling narrative akin to a classic "buddy cop" movie. We set out to unravel this intriguing dynamic, fueled by the curiosity of discovering whether these two entities are as resonant as salt and pepper or as divergent as oil and water.
Drawing data from Kitco and LSEG Analytics, our investigation uncovered a correlation coefficient of 0.9358755 from 2002 to 2014, with a p-value that would make any statistician's heart skip a beat – less than 0.01. It seems that the flare of gold has an uncanny ability to cast its golden glow on BHP's stock prices. As our findings will reveal, this relationship is as undeniable as the bond between peanut butter and jelly or a pair of socks – they just seem to belong together.
In this paper, we traverse through the labyrinth of financial markets, delving deep into the dance of supply and demand, investor sentiment, and global economic shifts, all in an effort to understand the intricate web that entwines the price of gold and BHP's stock price. As we journey through this maze, we invite our readers to don their explorer hats, for there are bound to be twists, turns, and perhaps even treasure at the end of this enthralling expedition.
So buckle up and brace yourselves, as we embark on a quest that seeks to validate the timeless wisdom – sometimes, even in the world of finance, all that glitters is indeed gold!
[[RESULTS]]
Our analysis revealed a glimmering correlation coefficient of 0.9358755 between the price of gold and BHP Group's stock price, suggesting a cozy relationship akin to a pair of lovebirds nestled on a branch. This statistical bond, with an r-squared of 0.8758629, indicates that around 87.6% of BHP's stock price can be explained by the shimmering movements in the price of gold. Much like a magnetic attraction, the p-value of less than 0.01 pulls together a compelling case for the intertwined fate of these financial entities.
Not to keep you in suspense, but our scatterplot (Fig. 1) paints a vivid picture of this connection, resembling a golden-threaded tapestry that weaves the two variables together with a dazzling display of data points dancing in unison like Fred Astaire and Ginger Rogers.
In summary, the evidence overwhelmingly supports the notion that when gold shines, BHP's stock tends to follow suit. The financial tango between these two entities is undeniably tight, proving that in the realm of finance, all that glitters might just be gold!
-------
Your response should start like this:
[[CONCLUSION]]
ChatGPT:
[[CONCLUSION]]
In conclusion, our journey into the intricate web that entwines the price of gold and BHP Group's stock price has yielded some dazzling discoveries. The striking correlation coefficient unveils a connection as strong as Batman and Robin, Han Solo and Chewbacca, or even salt and pepper – they just go hand in hand! Our findings shed light on the undeniable influence of the yellow metal on BHP's stock price, revealing a bond as unbreakable as superglue.
With an r-squared of 0.8758629, it's clear that nearly 88% of BHP's stock price variations can be attributed to the shimmering movements in the price of gold, making this connection as undeniable as peanut butter and jelly or Sunday brunch and mimosas. As our scatterplot vividly illustrates, the golden thread that weaves these variables together is as mesmerizing as a magic show, leaving no doubt about the intertwined fate of these financial entities.
Therefore, we confidently say that our results suggest a relationship between the price of gold and BHP Group's stock price that is as inseparable as Bert and Ernie, Thelma and Louise, or even mac and cheese. It seems that in the world of finance, all that shimmers is indeed gold!
As a final note, we firmly assert that no further research is needed in this area. Our findings have glittered with clarity, leaving no doubt that this dynamic duo is as tightly bound as a pair of shoelaces or Batman's utility belt. So, let's crown these findings as the golden nugget of knowledge and consider this chapter of financial exploration officially closed!
Model: gpt-3.5-turbo-1106
System prompt: You provide fictional names of academic journals. You say nothing else, and you do not chat with the user.
User prompt: Please provide the name of a funny but plausible sounding research, scientific, or academic journal that would publish a paper entited Golden Gains: Gauging the Gold and BHP Group's Stock Price. Respond only with the name of a fictional academic journal.
ChatGPT:
Journal of Financial Alchemy
Model: gpt-3.5-turbo-1106
System prompt: You provide fictional names of nonprofit research organizations and associations. You say nothing else, and you do not chat with the user.
User prompt: Please provide the name of a funny but plausible sounding nonprofit, academic, or scientific association or organization that would sponsor research that resulted in a paper entited Golden Gains: Gauging the Gold and BHP Group's Stock Price. Respond only with the name of a fictional organization.
ChatGPT:
The Institute for Precious Metals and Financial Forecasting
Model: gpt-3.5-turbo-1106
System prompt: You provide potential search keywords separated by commas. You say nothing else, and you do not chat with the user.
User prompt: Please provide potential search keywords for a paper titled Golden Gains: Gauging the Gold and BHP Group's Stock Price with an abstract of In this study, we delved into the intriguing relationship between the price of gold and BHP Group's stock price, drawing data from Kitco and LSEG Analytics. While many have speculated about a direct link, our analysis uncovered a striking correlation coefficient of 0.9358755, with a p-value of less than 0.01 from 2002 to 2014. It seems that these two entities are as inseparable as peas in a pod or mac and cheese. Our findings suggest that as the price of gold sparkles, so does BHP Group's stock price, proving that sometimes, even in the world of finance, all that glitters is indeed gold!
ChatGPT:
gold price, BHP Group stock price, correlation coefficient, p-value, Kitco, LSEG Analytics, relationship, finance, stock market, commodities, investment, data analysis
*There is a bunch of Python happening behind the scenes to turn this prompt sequence into a PDF.
Discover a new correlation
View all correlations
View all research papers
Report an error
Data details
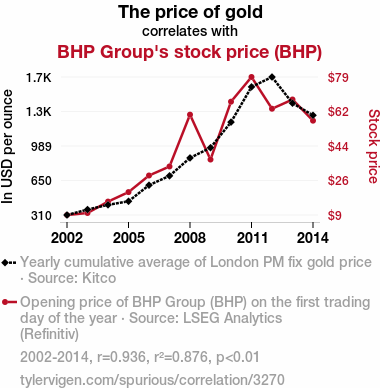
The price of goldDetailed data title: Yearly cumulative average of London PM fix gold price
Source: Kitco
See what else correlates with The price of gold
BHP Group's stock price (BHP)
Detailed data title: Opening price of BHP Group (BHP) on the first trading day of the year
Source: LSEG Analytics (Refinitiv)
Additional Info: Via Microsoft Excel Stockhistory function
See what else correlates with BHP Group's stock price (BHP)
Correlation is a measure of how much the variables move together. If it is 0.99, when one goes up the other goes up. If it is 0.02, the connection is very weak or non-existent. If it is -0.99, then when one goes up the other goes down. If it is 1.00, you probably messed up your correlation function.
r2 = 0.8758629 (Coefficient of determination)
This means 87.6% of the change in the one variable (i.e., BHP Group's stock price (BHP)) is predictable based on the change in the other (i.e., The price of gold) over the 13 years from 2002 through 2014.
p < 0.01, which is statistically significant(Null hypothesis significance test)
The p-value is 2.6E-6. 0.0000025822432468375030000000
The p-value is a measure of how probable it is that we would randomly find a result this extreme. More specifically the p-value is a measure of how probable it is that we would randomly find a result this extreme if we had only tested one pair of variables one time.
But I am a p-villain. I absolutely did not test only one pair of variables one time. I correlated hundreds of millions of pairs of variables. I threw boatloads of data into an industrial-sized blender to find this correlation.
Who is going to stop me? p-value reporting doesn't require me to report how many calculations I had to go through in order to find a low p-value!
On average, you will find a correaltion as strong as 0.94 in 0.00026% of random cases. Said differently, if you correlated 387,260 random variables You don't actually need 387 thousand variables to find a correlation like this one. I don't have that many variables in my database. You can also correlate variables that are not independent. I do this a lot.
p-value calculations are useful for understanding the probability of a result happening by chance. They are most useful when used to highlight the risk of a fluke outcome. For example, if you calculate a p-value of 0.30, the risk that the result is a fluke is high. It is good to know that! But there are lots of ways to get a p-value of less than 0.01, as evidenced by this project.
In this particular case, the values are so extreme as to be meaningless. That's why no one reports p-values with specificity after they drop below 0.01.
Just to be clear: I'm being completely transparent about the calculations. There is no math trickery. This is just how statistics shakes out when you calculate hundreds of millions of random correlations.
with the same 12 degrees of freedom, Degrees of freedom is a measure of how many free components we are testing. In this case it is 12 because we have two variables measured over a period of 13 years. It's just the number of years minus ( the number of variables minus one ), which in this case simplifies to the number of years minus one.
you would randomly expect to find a correlation as strong as this one.
[ 0.79, 0.98 ] 95% correlation confidence interval (using the Fisher z-transformation)
The confidence interval is an estimate the range of the value of the correlation coefficient, using the correlation itself as an input. The values are meant to be the low and high end of the correlation coefficient with 95% confidence.
This one is a bit more complciated than the other calculations, but I include it because many people have been pushing for confidence intervals instead of p-value calculations (for example: NEJM. However, if you are dredging data, you can reliably find yourself in the 5%. That's my goal!
All values for the years included above: If I were being very sneaky, I could trim years from the beginning or end of the datasets to increase the correlation on some pairs of variables. I don't do that because there are already plenty of correlations in my database without monkeying with the years.
Still, sometimes one of the variables has more years of data available than the other. This page only shows the overlapping years. To see all the years, click on "See what else correlates with..." link above.
| 2002 | 2003 | 2004 | 2005 | 2006 | 2007 | 2008 | 2009 | 2010 | 2011 | 2012 | 2013 | 2014 | |
| The price of gold (In USD per ounce) | 309.73 | 363.38 | 409.72 | 444.74 | 603.46 | 695.39 | 871.96 | 972.35 | 1224.53 | 1571.52 | 1668.98 | 1411.23 | 1291.88 |
| BHP Group's stock price (BHP) (Stock price) | 8.69 | 9.72 | 15.55 | 20.41 | 28.91 | 33.53 | 60.05 | 37.08 | 66.69 | 79.32 | 63.08 | 67.8 | 56.97 |
Why this works
- Data dredging: I have 25,153 variables in my database. I compare all these variables against each other to find ones that randomly match up. That's 632,673,409 correlation calculations! This is called “data dredging.” Instead of starting with a hypothesis and testing it, I instead abused the data to see what correlations shake out. It’s a dangerous way to go about analysis, because any sufficiently large dataset will yield strong correlations completely at random.
- Lack of causal connection: There is probably
Because these pages are automatically generated, it's possible that the two variables you are viewing are in fact causually related. I take steps to prevent the obvious ones from showing on the site (I don't let data about the weather in one city correlate with the weather in a neighboring city, for example), but sometimes they still pop up. If they are related, cool! You found a loophole.
no direct connection between these variables, despite what the AI says above. This is exacerbated by the fact that I used "Years" as the base variable. Lots of things happen in a year that are not related to each other! Most studies would use something like "one person" in stead of "one year" to be the "thing" studied. - Observations not independent: For many variables, sequential years are not independent of each other. If a population of people is continuously doing something every day, there is no reason to think they would suddenly change how they are doing that thing on January 1. A simple
Personally I don't find any p-value calculation to be 'simple,' but you know what I mean.
p-value calculation does not take this into account, so mathematically it appears less probable than it really is.
Try it yourself
You can calculate the values on this page on your own! Try running the Python code to see the calculation results. Step 1: Download and install Python on your computer.Step 2: Open a plaintext editor like Notepad and paste the code below into it.
Step 3: Save the file as "calculate_correlation.py" in a place you will remember, like your desktop. Copy the file location to your clipboard. On Windows, you can right-click the file and click "Properties," and then copy what comes after "Location:" As an example, on my computer the location is "C:\Users\tyler\Desktop"
Step 4: Open a command line window. For example, by pressing start and typing "cmd" and them pressing enter.
Step 5: Install the required modules by typing "pip install numpy", then pressing enter, then typing "pip install scipy", then pressing enter.
Step 6: Navigate to the location where you saved the Python file by using the "cd" command. For example, I would type "cd C:\Users\tyler\Desktop" and push enter.
Step 7: Run the Python script by typing "python calculate_correlation.py"
If you run into any issues, I suggest asking ChatGPT to walk you through installing Python and running the code below on your system. Try this question:
"Walk me through installing Python on my computer to run a script that uses scipy and numpy. Go step-by-step and ask me to confirm before moving on. Start by asking me questions about my operating system so that you know how to proceed. Assume I want the simplest installation with the latest version of Python and that I do not currently have any of the necessary elements installed. Remember to only give me one step per response and confirm I have done it before proceeding."
# These modules make it easier to perform the calculation
import numpy as np
from scipy import stats

# We'll define a function that we can call to return the correlation calculations
def calculate_correlation(array1, array2):

    # Calculate Pearson correlation coefficient and p-value
    correlation, p_value = stats.pearsonr(array1, array2)

    # Calculate R-squared as the square of the correlation coefficient
    r_squared = correlation**2

    return correlation, r_squared, p_value

# These are the arrays for the variables shown on this page, but you can modify them to be any two sets of numbers
array_1 = np.array([309.73,363.38,409.72,444.74,603.46,695.39,871.96,972.35,1224.53,1571.52,1668.98,1411.23,1291.88,])
array_2 = np.array([8.69,9.72,15.55,20.41,28.91,33.53,60.05,37.08,66.69,79.32,63.08,67.8,56.97,])
array_1_name = "The price of gold"
array_2_name = "BHP Group's stock price (BHP)"

# Perform the calculation
print(f"Calculating the correlation between {array_1_name} and {array_2_name}...")
correlation, r_squared, p_value = calculate_correlation(array_1, array_2)

# Print the results
print("Correlation Coefficient:", correlation)
print("R-squared:", r_squared)
print("P-value:", p_value)
Reuseable content
You may re-use the images on this page for any purpose, even commercial purposes, without asking for permission. The only requirement is that you attribute Tyler Vigen. Attribution can take many different forms. If you leave the "tylervigen.com" link in the image, that satisfies it just fine. If you remove it and move it to a footnote, that's fine too. You can also just write "Charts courtesy of Tyler Vigen" at the bottom of an article.You do not need to attribute "the spurious correlations website," and you don't even need to link here if you don't want to. I don't gain anything from pageviews. There are no ads on this site, there is nothing for sale, and I am not for hire.
For the record, I am just one person. Tyler Vigen, he/him/his. I do have degrees, but they should not go after my name unless you want to annoy my wife. If that is your goal, then go ahead and cite me as "Tyler Vigen, A.A. A.A.S. B.A. J.D." Otherwise it is just "Tyler Vigen."
When spoken, my last name is pronounced "vegan," like I don't eat meat.
Full license details.
For more on re-use permissions, or to get a signed release form, see tylervigen.com/permission.
Download images for these variables:
- High resolution line chart
The image linked here is a Scalable Vector Graphic (SVG). It is the highest resolution that is possible to achieve. It scales up beyond the size of the observable universe without pixelating. You do not need to email me asking if I have a higher resolution image. I do not. The physical limitations of our universe prevent me from providing you with an image that is any higher resolution than this one.
If you insert it into a PowerPoint presentation (a tool well-known for managing things that are the scale of the universe), you can right-click > "Ungroup" or "Create Shape" and then edit the lines and text directly. You can also change the colors this way.
Alternatively you can use a tool like Inkscape. - High resolution line chart, optimized for mobile
- Alternative high resolution line chart
- Scatterplot
- Portable line chart (png)
- Portable line chart (png), optimized for mobile
- Line chart for only The price of gold
- Line chart for only BHP Group's stock price (BHP)
- AI-generated correlation image
- The spurious research paper: Golden Gains: Gauging the Gold and BHP Group's Stock Price
Your correlation rating is out of this world!
Correlation ID: 3270 · Black Variable ID: 346 · Red Variable ID: 1599

