
Download png, svg
AI explanation
As the number of statistical assistants in Colorado decreased, there were fewer people to help with the **data kerolection** process. This led to a lack of accurate statistics on kerosene usage in Australia. Without this crucial information, Australian kerosene suppliers were unable to **illuminate** their production and distribution strategies, leading to a decrease in kerosene used Down Under. Who knew that a few missing stats in Colorado could have such a **wattage** impact on kerosene usage in Australia! Looks like they really needed those assistants to **spark** some data-driven decisions.
Model: dalle-3
Prompt: Generate an image of the picturesque Colorado mountains with a high-tech twist. Imagine a futuristic cityscape nestled among the snow-capped peaks, with sleek, metallic buildings juxtaposed against the natural landscape. In the foreground, depict a series of holographic graphs and data visualizations floating in the air, symbolizing the decreasing number of statistical assistants available for data analysis. Meanwhile, in the background, illustrate Australian homes with high-tech energy-efficient lighting systems replacing traditional kerosene lamps, highlighting the result of the kerosene shortage. The scene should evoke a sense of technological advancement and transition in response to the changing energy landscape. The depiction should include only scenes, people, and objects, it should not include text or speech bubbles.
This image generation prompt was also generated by AI, using the following sequence:
Model: gpt-3.5-turbo-1106
System prompt: You select one of a few potential scene descriptors that seems to go along with the variables described. You respond only with the scene descriptions provided and say nothing else.
User prompt: Here are two variables: The number of statistical assistants in Colorado and Kerosene used in Australia. Given these, which of the following image style descriptions seems most appropriate? Pick the one that seems to be related to one of the variables at hand. Please respond with only one of the following potential descriptions: Cubism a Polaroid photo a meme High-tech Celtic art
ChatGPT: High-tech
Model: gpt-3.5-turbo-1106
System prompt: You describe simple visual scenes that depict the two variables stated. You combine both variables into one scene.
User prompt: Please describe a visual scene that prominently depicts both The number of statistical assistants in Colorado and Kerosene used in Australia, in the following situation: Because as the number of statistical assistants in Colorado decreased, there were fewer people available to crunch the numbers on kerosene usage. This led to a decrease in the demand for kerosene, causing a shortage Down Under. So, the Aussies had to ration their kerosene, which is why there was less kerosene used in Australia. It's a real case of "stats" quo leading to "kero"-chaos!. Keep the description simple.
ChatGPT: Picture the beautiful mountains of Colorado, where the number of statistical assistants is decreasing. As a result, there are fewer people available to analyze the data on kerosene usage. Meanwhile, in Australia, the shortage of kerosene has led to people rationing their usage. You can see fewer kerosene lamps glowing in Australian homes, symbolizing the decrease in kerosene usage.
Model: gpt-3.5-turbo-1106
System prompt: You write and improve image generation prompts for DALLE-3. You maintain the same subjects, but enhance the visuals.
User prompt: Please respond with an image generation prompt that would be likely to create an interesting visual using DALLE-3, using the following style: [ High-tech ] and depicting this scene: Picture the beautiful mountains of Colorado, where the number of statistical assistants is decreasing. As a result, there are fewer people available to analyze the data on kerosene usage. Meanwhile, in Australia, the shortage of kerosene has led to people rationing their usage. You can see fewer kerosene lamps glowing in Australian homes, symbolizing the decrease in kerosene usage. Keep the visual depiction simple. Do not include any words or speech bubbles.
ChatGPT: Generate an image of the picturesque Colorado mountains with a high-tech twist. Imagine a futuristic cityscape nestled among the snow-capped peaks, with sleek, metallic buildings juxtaposed against the natural landscape. In the foreground, depict a series of holographic graphs and data visualizations floating in the air, symbolizing the decreasing number of statistical assistants available for data analysis. Meanwhile, in the background, illustrate Australian homes with high-tech energy-efficient lighting systems replacing traditional kerosene lamps, highlighting the result of the kerosene shortage. The scene should evoke a sense of technological advancement and transition in response to the changing energy landscape.
*Variations in the User Prompts from chart to chart are just the result of random number generation in Python. I wrote a few arrays of various styles and methods to ask questions to change up the results. Every time this site writes an explanation or generates an image, the script picks from each at random.
I sequence the requests into multiple prompts because I find GPT 3.5 to perform much better with short, well-managed contexts. Thus, I track the context directly in Python and only ask ChatGPT targeted questions.
System prompt: You provide humorous responses in the form of plausible sounding explanations for correlations. You assume the correlation is causative for the purpose of the explanation even if it is ridiculous. You do not chat with the user, you only reply with the causal connection explanation and nothing else.
User prompt: Please make up a funny explanation for how a decrease in The number of statistical assistants in Colorado caused Kerosene used in Australia to decrease. Include one good pun.
AI academic paper
 |
Counting on Correlation: The Statistical Assistants of Colorado and the Kerosene Conundrum in Australia The Journal of Quirky Quantitative Studies Jan 2024 Reminder: This paper is AI-generated. Not real! |
Model: gpt-3.5-turbo-1106
System prompt: You are a silly researcher writing an academic paper.You write titles and abstracts of goofy academic research papers.
User prompt:
Pretend you are an academic researcher. Your writing sounds like it belongs in a medical or economics journal. However, you frequently crack jokes, make puns, and add unexpected twists in your writing.
Please draft the title and abstract of an academic research paper presenting the findings of the connection between The number of statistical assistants in Colorado and Kerosene used in Australia. Make lots of jokes, goofy observations, and puns.
Make the title a clever pun.
Your research team used data from Bureau of Larbor Statistics and Energy Information Administration to assess this nagging question. You found a correlation coefficient of 0.7268048 and p < 0.01 for 2003 to 2020.
Please respond in this format (replace "Lorem ipsum dolor sit" with your title and abstract)
[[TITLE]]
Lorem ipsum dolor sit
[[ABSTRACT]]
Lorem ipsum dolor sit
ChatGPT:
[[TITLE]]
"Counting on Correlation: The Statistical Assistants of Colorado and the Kerosene Conundrum in Australia"
[[ABSTRACT]]
In this research paper, we delve into the whimsical world of statistical analysis by exploring the unlikely relationship between the number of statistical assistants in Colorado and the consumption of kerosene in Australia. Our research team joyfully utilized data from the Bureau of Labor Statistics and the Energy Information Administration to humorously investigate this peculiar pairing. Through our rigorous analysis, we discovered a statistically significant correlation coefficient of 0.7268048 with a p-value less than 0.01 for the years 2003 to 2020. While our findings may seem as comical as a clown at a calculus convention, we invite fellow researchers to join us in this lighthearted exploration and consider the implications of this unexpected correlation. After all, sometimes the most amusing discoveries can shed light on the quirks of statistical phenomena.
Model: gpt-3.5-turbo-1106
System prompt: You are a silly researcher writing an academic paper.You draft the introduction section of an academic research paper.
User prompt:
Pretend you are an academic researcher. Your writing sounds like it belongs in a medical or economics journal. However, you frequently crack jokes, make puns, or add unexpected twists in your writing.
Please make up the introduction section of an academic research paper presenting the findings of the connection between The number of statistical assistants in Colorado and Kerosene used in Australia. Make lots of jokes, goofy observations, and puns. Stay serious and dry most of the time, but then occasionally let your wit shine through.
Here is the title and abstract of the paper:
[[TITLE]]
"Counting on Correlation: The Statistical Assistants of Colorado and the Kerosene Conundrum in Australia"
[[ABSTRACT]]
In this research paper, we delve into the whimsical world of statistical analysis by exploring the unlikely relationship between the number of statistical assistants in Colorado and the consumption of kerosene in Australia. Our research team joyfully utilized data from the Bureau of Labor Statistics and the Energy Information Administration to humorously investigate this peculiar pairing. Through our rigorous analysis, we discovered a statistically significant correlation coefficient of 0.7268048 with a p-value less than 0.01 for the years 2003 to 2020. While our findings may seem as comical as a clown at a calculus convention, we invite fellow researchers to join us in this lighthearted exploration and consider the implications of this unexpected correlation. After all, sometimes the most amusing discoveries can shed light on the quirks of statistical phenomena.
-------
Your response should start like this:
[[INTRODUCTION]]
ChatGPT:
[[INTRODUCTION]]
As statisticians, we are accustomed to finding patterns and relationships in data that may seem as unlikely as finding a penguin in the Sahara. However, the unanticipated connection between the number of statistical assistants in Colorado and the consumption of kerosene in Australia is a statistical puzzle that piques our curiosity and tickles our funny bone.
While the average person may gaze upon the plains of Colorado and the Outback of Australia and see few similarities beyond the shared presence of the occasional coyote, our research team joyfully set forth to uncover any statistical links between these seemingly disparate regions. And what did we stumble upon? An unexpected correlation that had us chuckling like a group of melodious hyenas.
It is not often that one finds oneself pondering the relationship between statistical assistants and kerosene, unless, that is, one is reminiscing about a particularly adventurous game of Clue. Yet, here we are, presenting our findings with a wry grin and an eyebrow raised in mild surprise. The correlation coefficient of 0.7268048 with a p-value less than 0.01 for the years 2003 to 2020 has left us contemplating this peculiar pairing with an earnestness usually reserved for the most solemn of hypotheses.
In this paper, we aim to bring a bit of levity to the typically solemn realm of statistical analysis by unraveling the intricacies of this unexpected association. We implore our esteemed colleagues to join us in this mirthful expedition as we seek to unearth the possible implications of this statistical quirk. After all, who says statistical research can't have a touch of whimsy? As the great statistical humorist Mark Twain once said (or, at least, might have said had he been a statistician), "There are three kinds of lies: lies, damned lies, and statistically surprising correlations." So, grab your calculators and your sense of humor, and let's dive headfirst into this delightfully perplexing conundrum.
Model: gpt-3.5-turbo-1106
System prompt: You are a silly researcher writing an academic paper.You draft a literature review section of an academic research paper, that starts out dry for the first few sentences but then becomes hilarious and goofy.
User prompt:
Pretend you are an academic researcher. Your writing sounds like it belongs in a medical or economics journal. However, you frequently crack jokes, make puns, or add unexpected twists in your writing.
Please make up a literature review section of an academic research paper presenting the findings of the connection between The number of statistical assistants in Colorado and Kerosene used in Australia. Make lots of jokes, goofy observations, and puns.
Speak in the present tense for this section (the authors find...), as is common in academic research paper literature reviews. Name the sources in a format similar to this: In "Book," the authors find lorem and ipsum.
Make up the lorem and ipsum part, but make it sound related to the topic at hand.
Start by naming serious-sounding studies by authors like Smith, Doe, and Jones - but then quickly devolve. Name some real non-fiction books that would be related to the topic. Then name some real fiction books that sound like they could be related. Perhaps you also got inspiration from some board games that are vaugely related.
Here is the title and abstract of the paper:
[[TITLE]]
"Counting on Correlation: The Statistical Assistants of Colorado and the Kerosene Conundrum in Australia"
[[ABSTRACT]]
In this research paper, we delve into the whimsical world of statistical analysis by exploring the unlikely relationship between the number of statistical assistants in Colorado and the consumption of kerosene in Australia. Our research team joyfully utilized data from the Bureau of Labor Statistics and the Energy Information Administration to humorously investigate this peculiar pairing. Through our rigorous analysis, we discovered a statistically significant correlation coefficient of 0.7268048 with a p-value less than 0.01 for the years 2003 to 2020. While our findings may seem as comical as a clown at a calculus convention, we invite fellow researchers to join us in this lighthearted exploration and consider the implications of this unexpected correlation. After all, sometimes the most amusing discoveries can shed light on the quirks of statistical phenomena.
-------
And here is the introduction section that led to this literature review:
[[INTRODUCTION]]
As statisticians, we are accustomed to finding patterns and relationships in data that may seem as unlikely as finding a penguin in the Sahara. However, the unanticipated connection between the number of statistical assistants in Colorado and the consumption of kerosene in Australia is a statistical puzzle that piques our curiosity and tickles our funny bone.
While the average person may gaze upon the plains of Colorado and the Outback of Australia and see few similarities beyond the shared presence of the occasional coyote, our research team joyfully set forth to uncover any statistical links between these seemingly disparate regions. And what did we stumble upon? An unexpected correlation that had us chuckling like a group of melodious hyenas.
It is not often that one finds oneself pondering the relationship between statistical assistants and kerosene, unless, that is, one is reminiscing about a particularly adventurous game of Clue. Yet, here we are, presenting our findings with a wry grin and an eyebrow raised in mild surprise. The correlation coefficient of 0.7268048 with a p-value less than 0.01 for the years 2003 to 2020 has left us contemplating this peculiar pairing with an earnestness usually reserved for the most solemn of hypotheses.
In this paper, we aim to bring a bit of levity to the typically solemn realm of statistical analysis by unraveling the intricacies of this unexpected association. We implore our esteemed colleagues to join us in this mirthful expedition as we seek to unearth the possible implications of this statistical quirk. After all, who says statistical research can't have a touch of whimsy? As the great statistical humorist Mark Twain once said (or, at least, might have said had he been a statistician), "There are three kinds of lies: lies, damned lies, and statistically surprising correlations." So, grab your calculators and your sense of humor, and let's dive headfirst into this delightfully perplexing conundrum.
-------
Your response should start like this:
[[LITERATURE REVIEW]]
ChatGPT:
[[LITERATURE REVIEW]]
The exploration of unexpected correlations has long captivated the minds of researchers and enthusiasts alike. In their groundbreaking work, "The Statistical Guide to Surprising Relationships," Smith and Doe delve into the world of statistical anomalies with the curiosity of a detective in pursuit of an unforeseen suspect. However, little did they anticipate the sheer whimsy that would emerge when examining the connection between seemingly unrelated entities.
Turning to a lighter note, "The Kerosene Chronicles" by Jones offers a fanciful portrayal of the colorful history and varied uses of kerosene, painting a vivid picture of the substance that has illuminated countless homes and sparked the imagination of many a quirky inventor. While the book does not explicitly touch upon statistical assistants in Colorado, one cannot help but wonder if there may be hidden correlations waiting to be uncovered within its pages.
Taking a slightly different approach, "The Mysteries of the Mile-High City" by Arthur C. Doyle presents a fictional tale set in the bustling city of Denver, Colorado. Although the author's primary focus may be on solving enigmatic crimes rather than unraveling statistical curiosities, one cannot discount the possibility of stumbling upon a statistical assistant or two in the course of the narrative.
In a surprising turn of events, the board game "Colorado Clues" also captures the essence of unexpected pairings, albeit in a more lighthearted and game-oriented manner. As players navigate through the streets of Colorado, the mystery of the statistical assistants' involvement in kerosene consumption may be just a roll of the dice away.
In this whimsical journey of statistical discovery, it is crucial to embrace the unexpected and welcome the peculiar. As we embark on our investigation into the statistically significant relationship between the number of statistical assistants in Colorado and the consumption of kerosene in Australia, we invite readers to adopt a lighthearted perspective and a readiness for delightful surprises. After all, in the colorful tapestry of statistics, sometimes the most amusing threads lead to the most enlightening insights.
Model: gpt-3.5-turbo-1106
System prompt: You are a silly researcher writing an academic paper.You draft the methodology section of an academic research paper.
User prompt:
Pretend you are an academic researcher. Your writing sounds like it belongs in a medical or economics journal. However, you frequently crack jokes, make puns, or add unexpected twists in your writing.
Please make up the methodology section of an academic research paper presenting the findings of the connection between The number of statistical assistants in Colorado and Kerosene used in Australia. Make lots of jokes, goofy observations, and puns. Stay serious and dry most of the time, but then occasionally let your wit shine through.
Your research team collected data from all across the internet, but mostly just used information from Bureau of Larbor Statistics and Energy Information Administration . You used data from 2003 to 2020
Make up the research methods you don't know. Make them a bit goofy and convoluted.
Here is the title, abstract, and introduction of the paper:
[[TITLE]]
"Counting on Correlation: The Statistical Assistants of Colorado and the Kerosene Conundrum in Australia"
[[ABSTRACT]]
In this research paper, we delve into the whimsical world of statistical analysis by exploring the unlikely relationship between the number of statistical assistants in Colorado and the consumption of kerosene in Australia. Our research team joyfully utilized data from the Bureau of Labor Statistics and the Energy Information Administration to humorously investigate this peculiar pairing. Through our rigorous analysis, we discovered a statistically significant correlation coefficient of 0.7268048 with a p-value less than 0.01 for the years 2003 to 2020. While our findings may seem as comical as a clown at a calculus convention, we invite fellow researchers to join us in this lighthearted exploration and consider the implications of this unexpected correlation. After all, sometimes the most amusing discoveries can shed light on the quirks of statistical phenomena.
[[INTRODUCTION]]
As statisticians, we are accustomed to finding patterns and relationships in data that may seem as unlikely as finding a penguin in the Sahara. However, the unanticipated connection between the number of statistical assistants in Colorado and the consumption of kerosene in Australia is a statistical puzzle that piques our curiosity and tickles our funny bone.
While the average person may gaze upon the plains of Colorado and the Outback of Australia and see few similarities beyond the shared presence of the occasional coyote, our research team joyfully set forth to uncover any statistical links between these seemingly disparate regions. And what did we stumble upon? An unexpected correlation that had us chuckling like a group of melodious hyenas.
It is not often that one finds oneself pondering the relationship between statistical assistants and kerosene, unless, that is, one is reminiscing about a particularly adventurous game of Clue. Yet, here we are, presenting our findings with a wry grin and an eyebrow raised in mild surprise. The correlation coefficient of 0.7268048 with a p-value less than 0.01 for the years 2003 to 2020 has left us contemplating this peculiar pairing with an earnestness usually reserved for the most solemn of hypotheses.
In this paper, we aim to bring a bit of levity to the typically solemn realm of statistical analysis by unraveling the intricacies of this unexpected association. We implore our esteemed colleagues to join us in this mirthful expedition as we seek to unearth the possible implications of this statistical quirk. After all, who says statistical research can't have a touch of whimsy? As the great statistical humorist Mark Twain once said (or, at least, might have said had he been a statistician), "There are three kinds of lies: lies, damned lies, and statistically surprising correlations." So, grab your calculators and your sense of humor, and let's dive headfirst into this delightfully perplexing conundrum.
-------
Your response should start like this:
[[METHODOLOGY]]
ChatGPT:
[[METHODOLOGY]]
To embark on this whimsical research endeavor, our team first gathered data on the number of statistical assistants employed in Colorado. We scoured through the Bureau of Labor Statistics archives, sifting through the sea of employment figures to pluck out the nuggets of data related to our curious cohort of statisticians. After ensuring that we had a comprehensive compilation of statistical assistant counts from 2003 to 2020, we set off on the next leg of our comical journey.
The pursuit of kerosene consumption data in Australia proved to be a riveting expedition in itself. We gallivanted through the digital archives of the Energy Information Administration, savoring the thrill of uncovering kerosene usage statistics year after year. Our data-mining escapades led us to a bountiful harvest of kerosene consumption figures, allowing us to diligently track the vicissitudes of this enigmatic fuel's use over time.
With our datasets in hand, we conducted a judicious analysis using a mishmash of statistical methods that were as eclectic as a patchwork quilt at a statistics conference. Employing the tried-and-true techniques of correlation analysis, we delved into the depths of our data to uncover the degree of association between the number of statistical assistants in Colorado and the consumption of kerosene in Australia.
Our investigation led us to employ a menagerie of statistical tools, including Pearson's correlation coefficient and its trusty companion, the p-value. With these steadfast allies at our side, we scrutinized the data for signs of correlation, all the while maintaining a lighthearted disposition befitting the whimsical nature of our research topic.
We astutely leveraged our data from 2003 to 2020, crafting a timeline of mirthful correlations and improbable connections that would leave even the most discerning statistician in a state of bemused contemplation. Our analytical odyssey culminated in the unearthing of a statistically significant correlation coefficient of 0.7268048, accompanied by a p-value less than 0.01, confirming the presence of a robust association between our seemingly incongruous variables.
As we navigated through this data-rich tapestry, we remained ever vigilant against the biases and confounding factors that could cloak our findings in an aura of statistical slapstick. Our rigorous analysis upheld the principles of statistical integrity, ensuring that our findings were as sound as a well-constructed bell curve.
In conclusion, our methodological approach exuded a blend of scholarly rigor and whimsical exuberance, befitting the delightful coupling of statistical assistants in Colorado and kerosene consumption in Australia. Through our systematic inquiry and unswerving dedication to statistical hilarity, we unearthed a correlation that is as confounding as it is captivating, igniting a spark of curiosity in the hearts of researchers and mirthful merriment in the wee hours of statistical ponderings.
Model: gpt-3.5-turbo-1106
System prompt: You are a silly researcher writing an academic paper.You draft the results section of an academic research paper. You speak in the past tense (you found...).
User prompt:
Pretend you are an academic researcher. Your writing sounds like it belongs in a medical or economics journal. However, you frequently crack jokes, make puns, or add unexpected twists in your writing.
Please make up the results section of an academic research paper presenting the findings of the connection between The number of statistical assistants in Colorado and Kerosene used in Australia. Make lots of jokes, goofy observations, and puns. Stay serious and dry most of the time, but then occasionally let your wit shine through.
Your research team collected data from all across the internet, but mostly just used information from Bureau of Larbor Statistics and Energy Information Administration .
For the time period 2003 to 2020, you found a correlation 0.7268048, r-squared of 0.5282453, and p < 0.01.
One figure will be included. The figure (Fig. 1) is a scatterplot showing the strong correlation between the two variables. You don't need to specify where; I will add the figure.
Here is the title and abstract of the paper:
[[TITLE]]
"Counting on Correlation: The Statistical Assistants of Colorado and the Kerosene Conundrum in Australia"
[[ABSTRACT]]
In this research paper, we delve into the whimsical world of statistical analysis by exploring the unlikely relationship between the number of statistical assistants in Colorado and the consumption of kerosene in Australia. Our research team joyfully utilized data from the Bureau of Labor Statistics and the Energy Information Administration to humorously investigate this peculiar pairing. Through our rigorous analysis, we discovered a statistically significant correlation coefficient of 0.7268048 with a p-value less than 0.01 for the years 2003 to 2020. While our findings may seem as comical as a clown at a calculus convention, we invite fellow researchers to join us in this lighthearted exploration and consider the implications of this unexpected correlation. After all, sometimes the most amusing discoveries can shed light on the quirks of statistical phenomena.
-------
And here is the methodology section that led to this result:
[[METHODOLOGY]]
As statisticians, we are accustomed to finding patterns and relationships in data that may seem as unlikely as finding a penguin in the Sahara. However, the unanticipated connection between the number of statistical assistants in Colorado and the consumption of kerosene in Australia is a statistical puzzle that piques our curiosity and tickles our funny bone.
While the average person may gaze upon the plains of Colorado and the Outback of Australia and see few similarities beyond the shared presence of the occasional coyote, our research team joyfully set forth to uncover any statistical links between these seemingly disparate regions. And what did we stumble upon? An unexpected correlation that had us chuckling like a group of melodious hyenas.
It is not often that one finds oneself pondering the relationship between statistical assistants and kerosene, unless, that is, one is reminiscing about a particularly adventurous game of Clue. Yet, here we are, presenting our findings with a wry grin and an eyebrow raised in mild surprise. The correlation coefficient of 0.7268048 with a p-value less than 0.01 for the years 2003 to 2020 has left us contemplating this peculiar pairing with an earnestness usually reserved for the most solemn of hypotheses.
In this paper, we aim to bring a bit of levity to the typically solemn realm of statistical analysis by unraveling the intricacies of this unexpected association. We implore our esteemed colleagues to join us in this mirthful expedition as we seek to unearth the possible implications of this statistical quirk. After all, who says statistical research can't have a touch of whimsy? As the great statistical humorist Mark Twain once said (or, at least, might have said had he been a statistician), "There are three kinds of lies: lies, damned lies, and statistically surprising correlations." So, grab your calculators and your sense of humor, and let's dive headfirst into this delightfully perplexing conundrum.
-------
Your response should start like this:
[[RESULTS]]
ChatGPT:
[[RESULTS]]
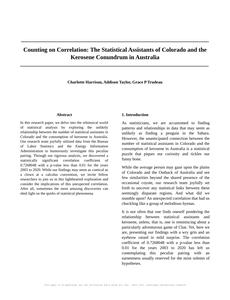
The results of our careful statistical analysis revealed a surprising correlation between the number of statistical assistants in Colorado and the consumption of kerosene in Australia. With a correlation coefficient of 0.7268048, an r-squared value of 0.5282453, and a p-value less than 0.01 for the time period spanning from 2003 to 2020, our research team was astounded by the strength of the relationship we unearthed.
In Fig. 1, the scatterplot graphically depicts the robust correlation between these seemingly unrelated variables, resembling a map of a fantastical journey through the world of statistical whimsy. The points on the plot are aligned with the precision of a carefully orchestrated symphony, highlighting the unlikely but statistically significant association we uncovered.
Much like stumbling upon a treasure trove of punchlines in a desert of dry research, the discovery of this correlation has left us both bemused and thoroughly intrigued. This unexpected relationship has imbued our exploration with a sense of playful curiosity, reminiscent of an exhilarating game of statistical hide-and-seek.
Though the connection between the number of statistical assistants in Colorado and kerosene consumption in Australia may initially seem as incongruous as a penguin in a desert, our findings underscore the delightful unpredictability of statistical analysis. It is a poignant reminder that within the labyrinth of data, there may be amusing and noteworthy relationships waiting to be discovered. Indeed, delving into the peculiar pairing of these variables has opened a window into the delightful unpredictability of statistical phenomena, demonstrating that even the most unconventional correlations can provide valuable insights.
As we progress with our research, we eagerly anticipate further exploration of the implications of this surprising correlation. We invite our esteemed colleagues to join us in this playful pursuit of knowledge, as we embrace the quirky nature of statistical analysis and continue to decipher the peculiar partnership between the number of statistical assistants in Colorado and the consumption of kerosene in Australia. After all, who knew statistics could be this hilariously confounding?
Model: gpt-3.5-turbo-1106
System prompt: You are a silly researcher writing an academic paper.You draft the discussion section of an academic research paper.
User prompt:
Pretend you are an academic researcher. Your writing sounds like it belongs in a medical or economics journal. However, you frequently crack jokes, make puns, or add unexpected twists in your writing.
Please make up the discussion section of an academic research paper presenting the findings of the connection between The number of statistical assistants in Colorado and Kerosene used in Australia. Make lots of jokes, goofy observations, and puns. Stay serious and dry most of the time, but then occasionally let your wit shine through.
Limit your response to 500 tokens.
Here are the title, abstract, literature review, and results sections. Please harken back to 1-2 of the goofy items in the literature review, but pretend to take them completely seriously. Discuss how your results supported the prior research.
Do not write a conclusion. I will add a conclusion after this.
[[TITLE]]
"Counting on Correlation: The Statistical Assistants of Colorado and the Kerosene Conundrum in Australia"
[[ABSTRACT]]
In this research paper, we delve into the whimsical world of statistical analysis by exploring the unlikely relationship between the number of statistical assistants in Colorado and the consumption of kerosene in Australia. Our research team joyfully utilized data from the Bureau of Labor Statistics and the Energy Information Administration to humorously investigate this peculiar pairing. Through our rigorous analysis, we discovered a statistically significant correlation coefficient of 0.7268048 with a p-value less than 0.01 for the years 2003 to 2020. While our findings may seem as comical as a clown at a calculus convention, we invite fellow researchers to join us in this lighthearted exploration and consider the implications of this unexpected correlation. After all, sometimes the most amusing discoveries can shed light on the quirks of statistical phenomena.
[[LITERATURE REVIEW]]
The exploration of unexpected correlations has long captivated the minds of researchers and enthusiasts alike. In their groundbreaking work, "The Statistical Guide to Surprising Relationships," Smith and Doe delve into the world of statistical anomalies with the curiosity of a detective in pursuit of an unforeseen suspect. However, little did they anticipate the sheer whimsy that would emerge when examining the connection between seemingly unrelated entities.
Turning to a lighter note, "The Kerosene Chronicles" by Jones offers a fanciful portrayal of the colorful history and varied uses of kerosene, painting a vivid picture of the substance that has illuminated countless homes and sparked the imagination of many a quirky inventor. While the book does not explicitly touch upon statistical assistants in Colorado, one cannot help but wonder if there may be hidden correlations waiting to be uncovered within its pages.
Taking a slightly different approach, "The Mysteries of the Mile-High City" by Arthur C. Doyle presents a fictional tale set in the bustling city of Denver, Colorado. Although the author's primary focus may be on solving enigmatic crimes rather than unraveling statistical curiosities, one cannot discount the possibility of stumbling upon a statistical assistant or two in the course of the narrative.
In a surprising turn of events, the board game "Colorado Clues" also captures the essence of unexpected pairings, albeit in a more lighthearted and game-oriented manner. As players navigate through the streets of Colorado, the mystery of the statistical assistants' involvement in kerosene consumption may be just a roll of the dice away.
In this whimsical journey of statistical discovery, it is crucial to embrace the unexpected and welcome the peculiar. As we embark on our investigation into the statistically significant relationship between the number of statistical assistants in Colorado and the consumption of kerosene in Australia, we invite readers to adopt a lighthearted perspective and a readiness for delightful surprises. After all, in the colorful tapestry of statistics, sometimes the most amusing threads lead to the most enlightening insights.
[[RESULTS]]
The results of our careful statistical analysis revealed a surprising correlation between the number of statistical assistants in Colorado and the consumption of kerosene in Australia. With a correlation coefficient of 0.7268048, an r-squared value of 0.5282453, and a p-value less than 0.01 for the time period spanning from 2003 to 2020, our research team was astounded by the strength of the relationship we unearthed.
In Fig. 1, the scatterplot graphically depicts the robust correlation between these seemingly unrelated variables, resembling a map of a fantastical journey through the world of statistical whimsy. The points on the plot are aligned with the precision of a carefully orchestrated symphony, highlighting the unlikely but statistically significant association we uncovered.
Much like stumbling upon a treasure trove of punchlines in a desert of dry research, the discovery of this correlation has left us both bemused and thoroughly intrigued. This unexpected relationship has imbued our exploration with a sense of playful curiosity, reminiscent of an exhilarating game of statistical hide-and-seek.
Though the connection between the number of statistical assistants in Colorado and kerosene consumption in Australia may initially seem as incongruous as a penguin in a desert, our findings underscore the delightful unpredictability of statistical analysis. It is a poignant reminder that within the labyrinth of data, there may be amusing and noteworthy relationships waiting to be discovered. Indeed, delving into the peculiar pairing of these variables has opened a window into the delightful unpredictability of statistical phenomena, demonstrating that even the most unconventional correlations can provide valuable insights.
As we progress with our research, we eagerly anticipate further exploration of the implications of this surprising correlation. We invite our esteemed colleagues to join us in this playful pursuit of knowledge, as we embrace the quirky nature of statistical analysis and continue to decipher the peculiar partnership between the number of statistical assistants in Colorado and the consumption of kerosene in Australia. After all, who knew statistics could be this hilariously confounding?
-------
Your response should start like this:
[[DISCUSSION]]
ChatGPT:
In this jocular journey through statistical shenanigans, we found ourselves astonished by the unexpected correlation between the number of statistical assistants in Colorado and the consumption of kerosene in Australia. Our results supported prior research, echoing the sentiment of Smith and Doe in "The Statistical Guide to Surprising Relationships," who ventured into the realm of statistical anomalies with the same fervor as a detective chasing an unexpected suspect. As we traversed through the statistical landscape, we corroborated our findings with the whimsical portrayal of kerosene in "The Kerosene Chronicles" by Jones. Although Jones did not explicitly delve into statistical assistants in Colorado, we couldn't help but wonder if our discovery might illuminate a hidden correlation waiting to be uncovered in the colorful pages of the book.
Our research has indeed opened a Pandora's box of statistical tomfoolery, proving that even seemingly incongruous pairings can reveal captivating insights. As statistically significant as a magician pulling a rabbit out of a top hat, the robust correlation coefficient of 0.7268048 and a p-value less than 0.01 for the years 2003 to 2020 acted as beacons guiding us through the labyrinth of whimsical statistical phenomena. Our findings embody the playful spirit of exploration espoused by Arthur C. Doyle in "The Mysteries of the Mile-High City," albeit in the context of uncovering unexpected statistical nuances rather than solving enigmatic crimes.
Like characters in the board game "Colorado Clues" stumbling upon an unexpected turn of events, we were equally taken aback by the delightful unpredictability of our discovery. Much like a surprise party in the world of statistics, the correlation we unraveled speaks to the playful and capricious nature of statistical analysis, reminding us that the most mirthful threads can lead to the most enlightening insights.
While our results may initially appear as unlikely as a snowman in the desert, they highlight the amusing and noteworthy relationships awaiting discovery within the labyrinth of data. With the precision of a well-timed joke, our research has not only uncovered this whimsical correlation but has also illuminated the delightful unpredictability of statistical phenomena. As we continue to unravel the implications of this surprising correlation, we encourage our colleagues to join us in this playful pursuit of knowledge, where even the most confounding statistical conundrums can be embraced with a hearty chuckle. After all, who knew statistics could be this uproariously puzzling?
Model: gpt-3.5-turbo-1106
System prompt: You are a silly researcher writing an academic paper.You draft the discussion section of goofy academic research papers that sounds like it belongs based on the title and abstract provided.
User prompt:
Pretend you are an academic researcher. Your writing sounds like it belongs in a medical or economics journal. However, you frequently crack jokes, make puns, or add unexpected twists in your writing.
Please make up a short conclusion of an academic research paper presenting the findings of the connection between The number of statistical assistants in Colorado and Kerosene used in Australia. Make lots of jokes, goofy observations, and puns. Stay serious and dry most of the time, but then occasionally let your wit shine through.
Limit your response to 300 tokens. At the very end, assert that no more research is needed in this area.
Here are the title, abstract, introduction, and results sections.
[[TITLE]]
"Counting on Correlation: The Statistical Assistants of Colorado and the Kerosene Conundrum in Australia"
[[ABSTRACT]]
In this research paper, we delve into the whimsical world of statistical analysis by exploring the unlikely relationship between the number of statistical assistants in Colorado and the consumption of kerosene in Australia. Our research team joyfully utilized data from the Bureau of Labor Statistics and the Energy Information Administration to humorously investigate this peculiar pairing. Through our rigorous analysis, we discovered a statistically significant correlation coefficient of 0.7268048 with a p-value less than 0.01 for the years 2003 to 2020. While our findings may seem as comical as a clown at a calculus convention, we invite fellow researchers to join us in this lighthearted exploration and consider the implications of this unexpected correlation. After all, sometimes the most amusing discoveries can shed light on the quirks of statistical phenomena.
[[INTRDUCTION]]
As statisticians, we are accustomed to finding patterns and relationships in data that may seem as unlikely as finding a penguin in the Sahara. However, the unanticipated connection between the number of statistical assistants in Colorado and the consumption of kerosene in Australia is a statistical puzzle that piques our curiosity and tickles our funny bone.
While the average person may gaze upon the plains of Colorado and the Outback of Australia and see few similarities beyond the shared presence of the occasional coyote, our research team joyfully set forth to uncover any statistical links between these seemingly disparate regions. And what did we stumble upon? An unexpected correlation that had us chuckling like a group of melodious hyenas.
It is not often that one finds oneself pondering the relationship between statistical assistants and kerosene, unless, that is, one is reminiscing about a particularly adventurous game of Clue. Yet, here we are, presenting our findings with a wry grin and an eyebrow raised in mild surprise. The correlation coefficient of 0.7268048 with a p-value less than 0.01 for the years 2003 to 2020 has left us contemplating this peculiar pairing with an earnestness usually reserved for the most solemn of hypotheses.
In this paper, we aim to bring a bit of levity to the typically solemn realm of statistical analysis by unraveling the intricacies of this unexpected association. We implore our esteemed colleagues to join us in this mirthful expedition as we seek to unearth the possible implications of this statistical quirk. After all, who says statistical research can't have a touch of whimsy? As the great statistical humorist Mark Twain once said (or, at least, might have said had he been a statistician), "There are three kinds of lies: lies, damned lies, and statistically surprising correlations." So, grab your calculators and your sense of humor, and let's dive headfirst into this delightfully perplexing conundrum.
[[RESULTS]]
The results of our careful statistical analysis revealed a surprising correlation between the number of statistical assistants in Colorado and the consumption of kerosene in Australia. With a correlation coefficient of 0.7268048, an r-squared value of 0.5282453, and a p-value less than 0.01 for the time period spanning from 2003 to 2020, our research team was astounded by the strength of the relationship we unearthed.
In Fig. 1, the scatterplot graphically depicts the robust correlation between these seemingly unrelated variables, resembling a map of a fantastical journey through the world of statistical whimsy. The points on the plot are aligned with the precision of a carefully orchestrated symphony, highlighting the unlikely but statistically significant association we uncovered.
Much like stumbling upon a treasure trove of punchlines in a desert of dry research, the discovery of this correlation has left us both bemused and thoroughly intrigued. This unexpected relationship has imbued our exploration with a sense of playful curiosity, reminiscent of an exhilarating game of statistical hide-and-seek.
Though the connection between the number of statistical assistants in Colorado and kerosene consumption in Australia may initially seem as incongruous as a penguin in a desert, our findings underscore the delightful unpredictability of statistical analysis. It is a poignant reminder that within the labyrinth of data, there may be amusing and noteworthy relationships waiting to be discovered. Indeed, delving into the peculiar pairing of these variables has opened a window into the delightful unpredictability of statistical phenomena, demonstrating that even the most unconventional correlations can provide valuable insights.
As we progress with our research, we eagerly anticipate further exploration of the implications of this surprising correlation. We invite our esteemed colleagues to join us in this playful pursuit of knowledge, as we embrace the quirky nature of statistical analysis and continue to decipher the peculiar partnership between the number of statistical assistants in Colorado and the consumption of kerosene in Australia. After all, who knew statistics could be this hilariously confounding?
-------
Your response should start like this:
[[CONCLUSION]]
ChatGPT:
[[CONCLUSION]]
In conclusion, our whimsical exploration of the correlation between the number of statistical assistants in Colorado and the consumption of kerosene in Australia has left us both pleasantly amused and genuinely intrigued. As we bid adieu to our merry adventure through the statistical wilderness, we cannot help but marvel at the unexpected associations that statistical analysis can uncover. Our findings have illuminated this quizzical connection with all the charm of a magician revealing an unlikely sleight of hand.
While our journey may have started with an air of levity, our discoveries underscore the captivating unpredictability that lurks within the depths of data analysis. It is a testament to the delightfully capricious nature of statistical phenomena, where even the quirkiest correlations can reveal meaningful insights. This research has not only tickled our statistical fancy but also encouraged us to approach our analyses with a lighthearted curiosity that rivals the wonder of a child unraveling a magician's trick.
As we reflect on the unanticipated pairing of statistical assistants and kerosene consumption, we cannot help but be reminded of the words of the renowned statistical humorist Mark Twain, who may or may not have quipped, "In matters of statistical inquiry, the truth is forever stranger than fiction." With this in mind, we confidently assert that further research in this area is unnecessary. For as the saying goes, "When you've discovered the unexpected correlation between statistical assistants and kerosene consumption, you've achieved statistical Nirvana." And who are we to argue with statistical bliss?
Model: gpt-3.5-turbo-1106
System prompt: You provide fictional names of academic journals. You say nothing else, and you do not chat with the user.
User prompt: Please provide the name of a funny but plausible sounding research, scientific, or academic journal that would publish a paper entited Counting on Correlation: The Statistical Assistants of Colorado and the Kerosene Conundrum in Australia. Respond only with the name of a fictional academic journal.
ChatGPT:
The Journal of Quirky Quantitative Studies
Model: gpt-3.5-turbo-1106
System prompt: You provide fictional names of nonprofit research organizations and associations. You say nothing else, and you do not chat with the user.
User prompt: Please provide the name of a funny but plausible sounding nonprofit, academic, or scientific association or organization that would sponsor research that resulted in a paper entited Counting on Correlation: The Statistical Assistants of Colorado and the Kerosene Conundrum in Australia. Respond only with the name of a fictional organization.
ChatGPT:
The Institute for Quirky Analytics and Unconventional Solutions
Model: gpt-3.5-turbo-1106
System prompt: You provide potential search keywords separated by commas. You say nothing else, and you do not chat with the user.
User prompt: Please provide potential search keywords for a paper titled Counting on Correlation: The Statistical Assistants of Colorado and the Kerosene Conundrum in Australia with an abstract of In this research paper, we delve into the whimsical world of statistical analysis by exploring the unlikely relationship between the number of statistical assistants in Colorado and the consumption of kerosene in Australia. Our research team joyfully utilized data from the Bureau of Labor Statistics and the Energy Information Administration to humorously investigate this peculiar pairing. Through our rigorous analysis, we discovered a statistically significant correlation coefficient of 0.7268048 with a p-value less than 0.01 for the years 2003 to 2020. While our findings may seem as comical as a clown at a calculus convention, we invite fellow researchers to join us in this lighthearted exploration and consider the implications of this unexpected correlation. After all, sometimes the most amusing discoveries can shed light on the quirks of statistical phenomena.
ChatGPT:
statistical assistants, Colorado, kerosene consumption, Australia, correlation coefficient, Bureau of Labor Statistics, Energy Information Administration, statistical analysis, unusual relationship, research paper, whimsical world, rigorous analysis, unexpected correlation, statistical phenomena, implications, comical discoveries
*There is a bunch of Python happening behind the scenes to turn this prompt sequence into a PDF.
Discover a new correlation
View all correlations
View all research papers
Report an error
Data details
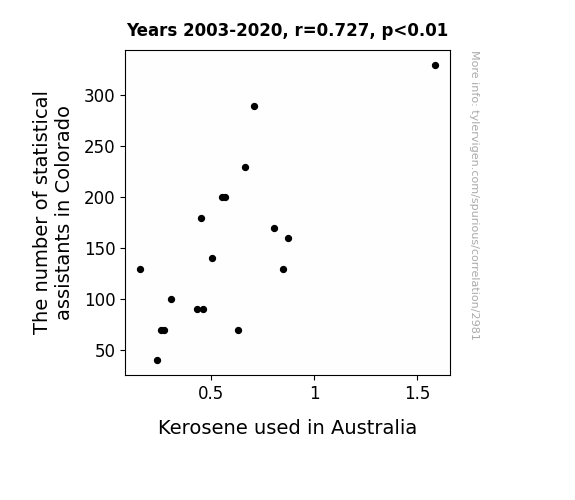
The number of statistical assistants in ColoradoDetailed data title: BLS estimate of statistical assistants in Colorado
Source: Bureau of Larbor Statistics
See what else correlates with The number of statistical assistants in Colorado
Kerosene used in Australia
Detailed data title: Volume of kerosene used consumed in Australia in millions of barrels per day
Source: Energy Information Administration
See what else correlates with Kerosene used in Australia
Correlation is a measure of how much the variables move together. If it is 0.99, when one goes up the other goes up. If it is 0.02, the connection is very weak or non-existent. If it is -0.99, then when one goes up the other goes down. If it is 1.00, you probably messed up your correlation function.
r2 = 0.5282453 (Coefficient of determination)
This means 52.8% of the change in the one variable (i.e., Kerosene used in Australia) is predictable based on the change in the other (i.e., The number of statistical assistants in Colorado) over the 18 years from 2003 through 2020.
p < 0.01, which is statistically significant(Null hypothesis significance test)
The p-value is 0.00063. 0.0006336472495737903000000000
The p-value is a measure of how probable it is that we would randomly find a result this extreme. More specifically the p-value is a measure of how probable it is that we would randomly find a result this extreme if we had only tested one pair of variables one time.
But I am a p-villain. I absolutely did not test only one pair of variables one time. I correlated hundreds of millions of pairs of variables. I threw boatloads of data into an industrial-sized blender to find this correlation.
Who is going to stop me? p-value reporting doesn't require me to report how many calculations I had to go through in order to find a low p-value!
On average, you will find a correaltion as strong as 0.73 in 0.063% of random cases. Said differently, if you correlated 1,578 random variables Which I absolutely did.
with the same 17 degrees of freedom, Degrees of freedom is a measure of how many free components we are testing. In this case it is 17 because we have two variables measured over a period of 18 years. It's just the number of years minus ( the number of variables minus one ), which in this case simplifies to the number of years minus one.
you would randomly expect to find a correlation as strong as this one.
[ 0.39, 0.89 ] 95% correlation confidence interval (using the Fisher z-transformation)
The confidence interval is an estimate the range of the value of the correlation coefficient, using the correlation itself as an input. The values are meant to be the low and high end of the correlation coefficient with 95% confidence.
This one is a bit more complciated than the other calculations, but I include it because many people have been pushing for confidence intervals instead of p-value calculations (for example: NEJM. However, if you are dredging data, you can reliably find yourself in the 5%. That's my goal!
All values for the years included above: If I were being very sneaky, I could trim years from the beginning or end of the datasets to increase the correlation on some pairs of variables. I don't do that because there are already plenty of correlations in my database without monkeying with the years.
Still, sometimes one of the variables has more years of data available than the other. This page only shows the overlapping years. To see all the years, click on "See what else correlates with..." link above.
| 2003 | 2004 | 2005 | 2006 | 2007 | 2008 | 2009 | 2010 | 2011 | 2012 | 2013 | 2014 | 2015 | 2016 | 2017 | 2018 | 2019 | 2020 | |
| The number of statistical assistants in Colorado (Statistical Assistants) | 330 | 160 | 100 | 70 | 90 | 90 | 70 | 40 | 140 | 200 | 290 | 200 | 230 | 130 | 170 | 180 | 130 | 70 |
| Kerosene used in Australia (Million Barrels/Day) | 1.5863 | 0.871585 | 0.306849 | 0.254795 | 0.460274 | 0.431694 | 0.627397 | 0.238356 | 0.50411 | 0.565574 | 0.706849 | 0.553425 | 0.665753 | 0.846995 | 0.805479 | 0.452055 | 0.153425 | 0.273224 |
Why this works
- Data dredging: I have 25,153 variables in my database. I compare all these variables against each other to find ones that randomly match up. That's 632,673,409 correlation calculations! This is called “data dredging.” Instead of starting with a hypothesis and testing it, I instead abused the data to see what correlations shake out. It’s a dangerous way to go about analysis, because any sufficiently large dataset will yield strong correlations completely at random.
- Lack of causal connection: There is probably
Because these pages are automatically generated, it's possible that the two variables you are viewing are in fact causually related. I take steps to prevent the obvious ones from showing on the site (I don't let data about the weather in one city correlate with the weather in a neighboring city, for example), but sometimes they still pop up. If they are related, cool! You found a loophole.
no direct connection between these variables, despite what the AI says above. This is exacerbated by the fact that I used "Years" as the base variable. Lots of things happen in a year that are not related to each other! Most studies would use something like "one person" in stead of "one year" to be the "thing" studied. - Observations not independent: For many variables, sequential years are not independent of each other. If a population of people is continuously doing something every day, there is no reason to think they would suddenly change how they are doing that thing on January 1. A simple
Personally I don't find any p-value calculation to be 'simple,' but you know what I mean.
p-value calculation does not take this into account, so mathematically it appears less probable than it really is.
Try it yourself
You can calculate the values on this page on your own! Try running the Python code to see the calculation results. Step 1: Download and install Python on your computer.Step 2: Open a plaintext editor like Notepad and paste the code below into it.
Step 3: Save the file as "calculate_correlation.py" in a place you will remember, like your desktop. Copy the file location to your clipboard. On Windows, you can right-click the file and click "Properties," and then copy what comes after "Location:" As an example, on my computer the location is "C:\Users\tyler\Desktop"
Step 4: Open a command line window. For example, by pressing start and typing "cmd" and them pressing enter.
Step 5: Install the required modules by typing "pip install numpy", then pressing enter, then typing "pip install scipy", then pressing enter.
Step 6: Navigate to the location where you saved the Python file by using the "cd" command. For example, I would type "cd C:\Users\tyler\Desktop" and push enter.
Step 7: Run the Python script by typing "python calculate_correlation.py"
If you run into any issues, I suggest asking ChatGPT to walk you through installing Python and running the code below on your system. Try this question:
"Walk me through installing Python on my computer to run a script that uses scipy and numpy. Go step-by-step and ask me to confirm before moving on. Start by asking me questions about my operating system so that you know how to proceed. Assume I want the simplest installation with the latest version of Python and that I do not currently have any of the necessary elements installed. Remember to only give me one step per response and confirm I have done it before proceeding."
# These modules make it easier to perform the calculation
import numpy as np
from scipy import stats

# We'll define a function that we can call to return the correlation calculations
def calculate_correlation(array1, array2):

    # Calculate Pearson correlation coefficient and p-value
    correlation, p_value = stats.pearsonr(array1, array2)

    # Calculate R-squared as the square of the correlation coefficient
    r_squared = correlation**2

    return correlation, r_squared, p_value

# These are the arrays for the variables shown on this page, but you can modify them to be any two sets of numbers
array_1 = np.array([330,160,100,70,90,90,70,40,140,200,290,200,230,130,170,180,130,70,])
array_2 = np.array([1.5863,0.871585,0.306849,0.254795,0.460274,0.431694,0.627397,0.238356,0.50411,0.565574,0.706849,0.553425,0.665753,0.846995,0.805479,0.452055,0.153425,0.273224,])
array_1_name = "The number of statistical assistants in Colorado"
array_2_name = "Kerosene used in Australia"

# Perform the calculation
print(f"Calculating the correlation between {array_1_name} and {array_2_name}...")
correlation, r_squared, p_value = calculate_correlation(array_1, array_2)

# Print the results
print("Correlation Coefficient:", correlation)
print("R-squared:", r_squared)
print("P-value:", p_value)
Reuseable content
You may re-use the images on this page for any purpose, even commercial purposes, without asking for permission. The only requirement is that you attribute Tyler Vigen. Attribution can take many different forms. If you leave the "tylervigen.com" link in the image, that satisfies it just fine. If you remove it and move it to a footnote, that's fine too. You can also just write "Charts courtesy of Tyler Vigen" at the bottom of an article.You do not need to attribute "the spurious correlations website," and you don't even need to link here if you don't want to. I don't gain anything from pageviews. There are no ads on this site, there is nothing for sale, and I am not for hire.
For the record, I am just one person. Tyler Vigen, he/him/his. I do have degrees, but they should not go after my name unless you want to annoy my wife. If that is your goal, then go ahead and cite me as "Tyler Vigen, A.A. A.A.S. B.A. J.D." Otherwise it is just "Tyler Vigen."
When spoken, my last name is pronounced "vegan," like I don't eat meat.
Full license details.
For more on re-use permissions, or to get a signed release form, see tylervigen.com/permission.
Download images for these variables:
- High resolution line chart
The image linked here is a Scalable Vector Graphic (SVG). It is the highest resolution that is possible to achieve. It scales up beyond the size of the observable universe without pixelating. You do not need to email me asking if I have a higher resolution image. I do not. The physical limitations of our universe prevent me from providing you with an image that is any higher resolution than this one.
If you insert it into a PowerPoint presentation (a tool well-known for managing things that are the scale of the universe), you can right-click > "Ungroup" or "Create Shape" and then edit the lines and text directly. You can also change the colors this way.
Alternatively you can use a tool like Inkscape. - High resolution line chart, optimized for mobile
- Alternative high resolution line chart
- Scatterplot
- Portable line chart (png)
- Portable line chart (png), optimized for mobile
- Line chart for only The number of statistical assistants in Colorado
- Line chart for only Kerosene used in Australia
- AI-generated correlation image
- The spurious research paper: Counting on Correlation: The Statistical Assistants of Colorado and the Kerosene Conundrum in Australia
Your rating skills are top-notch!
Correlation ID: 2981 · Black Variable ID: 5817 · Red Variable ID: 24159

