
Download png, svg
AI explanation
As the name Infant fell out of favor, there was a decline in baby-themed entertainment, leading to fewer opportunities for set and exhibit designers in New Jersey. Clearly, the baby name trends have a ripple effect in the creative industry!
Model: dalle-3
Prompt: ![Cutsy graphics] Generate an image of a vibrant New Jersey town square with a large marquee reading "Infant" in bold letters, drawing a crowd of curious onlookers. Show a group of set and exhibit designers meticulously arranging colorful displays, adding to the lively atmosphere, while passersby are captivated by the name "Infant" and the creative energy in the scene. Capture the bustling, artistic vibe of the town square with a mix of playful elements and vivid colors to enhance the visual appeal. The depiction should include only scenes, people, and objects, it should not include text or speech bubbles.
This image generation prompt was also generated by AI, using the following sequence:
Model: gpt-3.5-turbo-1106
System prompt: You select one of a few potential scene descriptors that seems to go along with the variables described. You respond only with the scene descriptions provided and say nothing else.
User prompt: Here are two variables: Popularity of the first name Infant and The number of set and exhibit designers in New Jersey. Given these, which of the following image style descriptions seems most appropriate? Pick the one that seems to be related to one of the variables at hand. Please respond with only one of the following potential descriptions: Sci-fi fantacy Sci-fi fantacy Futuristic Cutsy graphics An image that looks like it is a scene from 'Star Wars'
ChatGPT: Cutsy graphics
Model: gpt-3.5-turbo-1106
System prompt: You describe simple visual scenes that depict the two variables stated. You combine both variables into one scene.
User prompt: Please describe a visual scene that prominently depicts both Popularity of the first name Infant and The number of set and exhibit designers in New Jersey together. Keep the description simple.
ChatGPT: In a bustling New Jersey town square, a bright marquee proudly displays the name "Infant" in bold letters, drawing a crowd of curious onlookers. Nearby, a group of set and exhibit designers meticulously arrange colorful displays, each creation adding to the vibrant atmosphere of creative energy. The name "Infant" catches the attention of passersby, while the designers' innovative work adds to the artistic appeal of the bustling scene.
Model: gpt-3.5-turbo-1106
System prompt: You write and improve image generation prompts for DALLE-3. You maintain the same subjects, but enhance the visuals.
User prompt: Please respond with an image generation prompt that would be likely to create an interesting visual using DALLE-3, using the following style: [ Cutsy graphics ] and depicting this scene: In a bustling New Jersey town square, a bright marquee proudly displays the name "Infant" in bold letters, drawing a crowd of curious onlookers. Nearby, a group of set and exhibit designers meticulously arrange colorful displays, each creation adding to the vibrant atmosphere of creative energy. The name "Infant" catches the attention of passersby, while the designers' innovative work adds to the artistic appeal of the bustling scene. Keep the visual depiction simple. Do not include any words or speech bubbles.
ChatGPT: ![Cutsy graphics] Generate an image of a vibrant New Jersey town square with a large marquee reading "Infant" in bold letters, drawing a crowd of curious onlookers. Show a group of set and exhibit designers meticulously arranging colorful displays, adding to the lively atmosphere, while passersby are captivated by the name "Infant" and the creative energy in the scene. Capture the bustling, artistic vibe of the town square with a mix of playful elements and vivid colors to enhance the visual appeal.
*Variations in the User Prompts from chart to chart are just the result of random number generation in Python. I wrote a few arrays of various styles and methods to ask questions to change up the results. Every time this site writes an explanation or generates an image, the script picks from each at random.
I sequence the requests into multiple prompts because I find GPT 3.5 to perform much better with short, well-managed contexts. Thus, I track the context directly in Python and only ask ChatGPT targeted questions.
System prompt: You provide humorous responses in the form of plausible sounding explanations for correlations. You assume the correlation is causative for the purpose of the explanation even if it is ridiculous. You do not chat with the user, you only reply with the causal connection explanation and nothing else.
User prompt: Please make up a funny explanation for how a decrease in Popularity of the first name Infant caused The number of set and exhibit designers in New Jersey to decrease.
AI academic paper
 |
The Popularity Effect: Exploring the Correlation between Infant Names and Set & Exhibit Designers in the Garden State Journal of Nameology and Spatial Design Jan 2024 Reminder: This paper is AI-generated. Not real! |
Model: gpt-3.5-turbo-1106
System prompt: You are a witty academic researcher. Your writing sounds like it belongs in a statistics journal.You write titles and abstracts of goofy academic research papers.
User prompt:
Pretend you are an academic researcher. Your writing sounds like it belongs in a medical or economics journal. However, you frequently crack jokes, make puns, and add unexpected twists in your writing.
Please draft the title and abstract of an academic research paper presenting the findings of the connection between Popularity of the first name Infant and The number of set and exhibit designers in New Jersey. Make lots of jokes, goofy observations, and puns.
Make the title a clever pun.
Your research team used data from US Social Security Administration and Bureau of Larbor Statistics to assess this nagging question. You found a correlation coefficient of 0.9047022 and p < 0.01 for 2003 to 2021.
Please respond in this format (replace "Lorem ipsum dolor sit" with your title and abstract)
[[TITLE]]
Lorem ipsum dolor sit
[[ABSTRACT]]
Lorem ipsum dolor sit
ChatGPT:
[[TITLE]]
The "Pop"ularity Effect: Exploring the Correlation between Infant Names and Set & Exhibit Designers in the Garden State
[[ABSTRACT]]
This paper delves into the intriguing relationship between the popularity of first names given to infants and the number of set and exhibit designers in the state of New Jersey. Leveraging data from the US Social Security Administration and the Bureau of Labor Statistics, our research team conducted a comprehensive analysis spanning from 2003 to 2021. We unearthed a remarkably strong correlation coefficient of 0.9047022, with a p-value less than 0.01, indicating a robust statistical significance.
As we ventured into this uncharted territory, we observed mesmerizing patterns that emerged from the data. From "Jasmine" potentially leading to an uptick in scenic design to "Aiden" possibly influencing exhibit construction, the results are as entertaining as they are thought-provoking. This study not only sheds light on the interplay between nomenclature trends and professional pursuits, but also injects a touch of whimsy into the often sober world of statistical analysis. So, the next time you meet a baby named "Siena," perhaps you'll catch a glimpse of future set design prowess in the making!
Model: gpt-3.5-turbo-1106
System prompt: You are a witty academic researcher. Your writing sounds like it belongs in a statistics journal.You draft the introduction section of an academic research paper.
User prompt:
Pretend you are an academic researcher. Your writing sounds like it belongs in a medical or economics journal. However, you frequently crack jokes, make puns, or add unexpected twists in your writing.
Please make up the introduction section of an academic research paper presenting the findings of the connection between Popularity of the first name Infant and The number of set and exhibit designers in New Jersey. Make lots of jokes, goofy observations, and puns. Sneak in some jokes and clever puns about science, research, statistics, and the variables.
Here is the title and abstract of the paper:
[[TITLE]]
The "Pop"ularity Effect: Exploring the Correlation between Infant Names and Set & Exhibit Designers in the Garden State
[[ABSTRACT]]
This paper delves into the intriguing relationship between the popularity of first names given to infants and the number of set and exhibit designers in the state of New Jersey. Leveraging data from the US Social Security Administration and the Bureau of Labor Statistics, our research team conducted a comprehensive analysis spanning from 2003 to 2021. We unearthed a remarkably strong correlation coefficient of 0.9047022, with a p-value less than 0.01, indicating a robust statistical significance.
As we ventured into this uncharted territory, we observed mesmerizing patterns that emerged from the data. From "Jasmine" potentially leading to an uptick in scenic design to "Aiden" possibly influencing exhibit construction, the results are as entertaining as they are thought-provoking. This study not only sheds light on the interplay between nomenclature trends and professional pursuits, but also injects a touch of whimsy into the often sober world of statistical analysis. So, the next time you meet a baby named "Siena," perhaps you'll catch a glimpse of future set design prowess in the making!
-------
Your response should start like this:
[[INTRODUCTION]]
ChatGPT:
**[[INTRODUCTION]]**
The whimsical world of infant names meets the meticulous realm of set and exhibit design in our delightfully peculiar study. As we embark upon this unconventional investigation, one might ponder the correlation between the moniker "Infant" and the budding landscape of set and exhibit designers in the scenic state of New Jersey. Strapping on our statistical seatbelts, we joyfully dive into the data, guided by the delightful cries of curiosity and the resolute wails of p-values.
Human beings have long been fascinated by the power and whimsy of names. From Shakespeare's "What's in a name?" to the classic children's song "John Jacob Jingleheimer Schmidt," the world of nomenclature has never ceased to enchant and enthrall. Meanwhile, the world of set and exhibit design beckons with its own allure, captivating the imagination with its eclectic blend of artistic expression and spatial ingenuity.
Drawing from the rich tapestry of data provided by the US Social Security Administration and the Bureau of Labor Statistics, we embarked on a journey to uncover the mysterious connection between the names bestowed upon infants and the industrious cohort of set and exhibit designers in the Garden State. Our odyssey led us through the annals of time, from 2003 to 2021, as we unraveled the statistical threads binding these seemingly disparate domains.
Prepare to be astounded, amused, and potentially bemused, as we unravel the intricate relationship between nomenclature trends and the creative minds shaping the physical and visual landscapes. Strap in, hold on to your scatter plots, and get ready to explore the "pop"ularity effect that transcends the ordinary realms of traditional statistical inquiry.
Model: gpt-3.5-turbo-1106
System prompt: You are a witty academic researcher. Your writing sounds like it belongs in a statistics journal.You draft a literature review section of an academic research paper, that starts out dry for the first few sentences but then becomes hilarious and goofy.
User prompt:
Pretend you are an academic researcher. Your writing sounds like it belongs in a medical or economics journal. However, you frequently crack jokes, make puns, or add unexpected twists in your writing.
Please make up a literature review section of an academic research paper presenting the findings of the connection between Popularity of the first name Infant and The number of set and exhibit designers in New Jersey. Make lots of jokes, goofy observations, and puns.
Speak in the present tense for this section (the authors find...), as is common in academic research paper literature reviews. Name the sources in a format similar to this: In "Book," the authors find lorem and ipsum.
Make up the lorem and ipsum part, but make it sound related to the topic at hand.
Start by naming serious-sounding studies by authors like Smith, Doe, and Jones - but then quickly devolve. Name some real non-fiction books that would be related to the topic. Then name some real fiction books that sound like they could be related. Then you might move on to cartoons and children's shows that you watched for research.
Here is the title and abstract of the paper:
[[TITLE]]
The "Pop"ularity Effect: Exploring the Correlation between Infant Names and Set & Exhibit Designers in the Garden State
[[ABSTRACT]]
This paper delves into the intriguing relationship between the popularity of first names given to infants and the number of set and exhibit designers in the state of New Jersey. Leveraging data from the US Social Security Administration and the Bureau of Labor Statistics, our research team conducted a comprehensive analysis spanning from 2003 to 2021. We unearthed a remarkably strong correlation coefficient of 0.9047022, with a p-value less than 0.01, indicating a robust statistical significance.
As we ventured into this uncharted territory, we observed mesmerizing patterns that emerged from the data. From "Jasmine" potentially leading to an uptick in scenic design to "Aiden" possibly influencing exhibit construction, the results are as entertaining as they are thought-provoking. This study not only sheds light on the interplay between nomenclature trends and professional pursuits, but also injects a touch of whimsy into the often sober world of statistical analysis. So, the next time you meet a baby named "Siena," perhaps you'll catch a glimpse of future set design prowess in the making!
-------
And here is the introduction section that led to this literature review:
[[INTRODUCTION]]
The whimsical world of infant names meets the meticulous realm of set and exhibit design in our delightfully peculiar study. As we embark upon this unconventional investigation, one might ponder the correlation between the moniker "Infant" and the budding landscape of set and exhibit designers in the scenic state of New Jersey. Strapping on our statistical seatbelts, we joyfully dive into the data, guided by the delightful cries of curiosity and the resolute wails of p-values.
Human beings have long been fascinated by the power and whimsy of names. From Shakespeare's "What's in a name?" to the classic children's song "John Jacob Jingleheimer Schmidt," the world of nomenclature has never ceased to enchant and enthrall. Meanwhile, the world of set and exhibit design beckons with its own allure, captivating the imagination with its eclectic blend of artistic expression and spatial ingenuity.
Drawing from the rich tapestry of data provided by the US Social Security Administration and the Bureau of Labor Statistics, we embarked on a journey to uncover the mysterious connection between the names bestowed upon infants and the industrious cohort of set and exhibit designers in the Garden State. Our odyssey led us through the annals of time, from 2003 to 2021, as we unraveled the statistical threads binding these seemingly disparate domains.
Prepare to be astounded, amused, and potentially bemused, as we unravel the intricate relationship between nomenclature trends and the creative minds shaping the physical and visual landscapes. Strap in, hold on to your scatter plots, and get ready to explore the "pop"ularity effect that transcends the ordinary realms of traditional statistical inquiry.
-------
Your response should start like this:
[[LITERATURE REVIEW]]
ChatGPT:
[[LITERATURE REVIEW]]
In "Smith et al. (2020)," the authors delve into the cultural significance of infant names and their potential influence on career paths. They argue that the choice of a baby's name may unwittingly set them on a particular professional trajectory, citing anecdotal evidence of individuals with names like "Archer" pursuing careers in archery or "Hazel" excelling in forestry-related fields. While their study primarily focuses on broader occupational trends, the implications for the specific field of set and exhibit design cannot be overlooked.
Building upon this foundation, Doe and Jones (2018) explore the psychological impact of names on individuals' self-perception and aspirations. They propose that individuals may subconsciously be drawn to professions that resonate with the phonetic or semantic elements of their own names. For instance, the allure of "Rose" could steer an individual towards careers involving floral arrangements, while the resonance of "Sky" may inspire a penchant for scenic design. It is within this context that we investigate the potential influence of infant names on the number of set and exhibit designers in New Jersey.
Contrary to conventional wisdom, our literature review also encompasses non-conventional sources to truly grasp the depth of this peculiar correlation. In "The Name Book" by Dorothy Astoria, the intricate meanings and historical roots of names are revealed, shedding light on the subconscious currents that may guide individuals towards particular professions. Additionally, "The Baby Name Wizard" by Laura Wattenberg offers an engaging exploration of naming trends and their potential impact on future endeavors, providing a springboard for our unconventional inquiry.
Taking an even more imaginative leap, the fictitious realm offers intriguing insights into the potential connection between infant names and creative vocations. In J.K. Rowling's "Harry Potter" series, characters like Remus Lupin and Sirius Black exemplify the inherent linkage between personal names and professions, as their names subtly reflect their roles within the wizarding world. Similarly, in George R.R. Martin's "A Song of Ice and Fire" series, the family names of the characters conjure images of their ancestral domains, igniting our curiosity about the potential influence of names on career paths in the medieval settings evoked by such literature.
To truly immerse ourselves in the world of infant names, we drew inspiration from the colorful and whimsical universe of children's shows and cartoons. The likes of "Sesame Street," with characters bearing names like Elmo and Rosita, illuminate the potential impact of names on the development of young minds. Meanwhile, the animated wonders of "Paw Patrol," featuring pups with names like Chase and Skye, offer a light-hearted lens through which to view the potential connections between names and future pursuits.
As we wade through this kaleidoscope of literature and media, one cannot help but marvel at the unexpected synergies between the seemingly disparate realms of nomenclature trends and professional pathways. With a nod to both the serious and the whimsical, we embark on our statistical odyssey, poised to unravel the enchanting associations between infant names and the world of set and exhibit designers in New Jersey.
Model: gpt-3.5-turbo-1106
System prompt: You are a witty academic researcher. Your writing sounds like it belongs in a statistics journal.You draft the methodology section of an academic research paper.
User prompt:
Pretend you are an academic researcher. Your writing sounds like it belongs in a medical or economics journal. However, you frequently crack jokes, make puns, or add unexpected twists in your writing.
Please make up the methodology section of an academic research paper presenting the findings of the connection between Popularity of the first name Infant and The number of set and exhibit designers in New Jersey. Make lots of jokes, goofy observations, and puns. Sneak in some jokes and clever puns about science, research, statistics, and the variables.
Your research team collected data from all across the internet, but mostly just used information from US Social Security Administration and Bureau of Larbor Statistics . You used data from 2003 to 2021
Make up the research methods you don't know. Make them a bit goofy and convoluted.
Here is the title, abstract, and introduction of the paper:
[[TITLE]]
The "Pop"ularity Effect: Exploring the Correlation between Infant Names and Set & Exhibit Designers in the Garden State
[[ABSTRACT]]
This paper delves into the intriguing relationship between the popularity of first names given to infants and the number of set and exhibit designers in the state of New Jersey. Leveraging data from the US Social Security Administration and the Bureau of Labor Statistics, our research team conducted a comprehensive analysis spanning from 2003 to 2021. We unearthed a remarkably strong correlation coefficient of 0.9047022, with a p-value less than 0.01, indicating a robust statistical significance.
As we ventured into this uncharted territory, we observed mesmerizing patterns that emerged from the data. From "Jasmine" potentially leading to an uptick in scenic design to "Aiden" possibly influencing exhibit construction, the results are as entertaining as they are thought-provoking. This study not only sheds light on the interplay between nomenclature trends and professional pursuits, but also injects a touch of whimsy into the often sober world of statistical analysis. So, the next time you meet a baby named "Siena," perhaps you'll catch a glimpse of future set design prowess in the making!
[[INTRODUCTION]]
The whimsical world of infant names meets the meticulous realm of set and exhibit design in our delightfully peculiar study. As we embark upon this unconventional investigation, one might ponder the correlation between the moniker "Infant" and the budding landscape of set and exhibit designers in the scenic state of New Jersey. Strapping on our statistical seatbelts, we joyfully dive into the data, guided by the delightful cries of curiosity and the resolute wails of p-values.
Human beings have long been fascinated by the power and whimsy of names. From Shakespeare's "What's in a name?" to the classic children's song "John Jacob Jingleheimer Schmidt," the world of nomenclature has never ceased to enchant and enthrall. Meanwhile, the world of set and exhibit design beckons with its own allure, captivating the imagination with its eclectic blend of artistic expression and spatial ingenuity.
Drawing from the rich tapestry of data provided by the US Social Security Administration and the Bureau of Labor Statistics, we embarked on a journey to uncover the mysterious connection between the names bestowed upon infants and the industrious cohort of set and exhibit designers in the Garden State. Our odyssey led us through the annals of time, from 2003 to 2021, as we unraveled the statistical threads binding these seemingly disparate domains.
Prepare to be astounded, amused, and potentially bemused, as we unravel the intricate relationship between nomenclature trends and the creative minds shaping the physical and visual landscapes. Strap in, hold on to your scatter plots, and get ready to explore the "pop"ularity effect that transcends the ordinary realms of traditional statistical inquiry.
-------
Your response should start like this:
[[METHODOLOGY]]
ChatGPT:
[[METHODOLOGY]]
In this section, we elucidate the whimsical yet rigorously crafted methodologies employed to investigate the captivating entwinement of infant names and the realm of set and exhibit design in New Jersey. Our research team embarked on a delightful journey through the annals of data, combining the meticulousness of statistical analysis with the whimsy of name trends and professional pursuits.
Data Collection:
We harnessed the boundless power of the internet to source data from the US Social Security Administration for the enchanting array of infant names and the Bureau of Labor Statistics for the industrious cadre of set and exhibit designers. Our team scoured through the digital expanse from 2003 to 2021, capturing the ebbs and flows of nomenclature trends and professional vocations. From the depths of online databases to the peaks of statistical repositories, we voraciously consumed the data with the fervor of a researcher in pursuit of truth, albeit with a dash of levity.
Name Popularity Metrics:
To gauge the effervescent popularity of infant names, we concocted a delightful brew of statistical measures, incorporating descriptive statistics, frequency distributions, and trend analyses. Each name was caressed by the gentle touch of statistical scrutiny, as we delved into the captivating swells of naming trends over the years. One might say we navigated the statistical seas with the agility of a nimble sailor, charting the ebbs and flows of name waves with the precision of a mathematical mariner.
Set and Exhibit Designer Enumeration:
Our intrepid journey through the Bureau of Labor Statistics unveiled the mosaic of set and exhibit designers nestled within the verdant landscape of New Jersey. With the ardor of a painter dabbing hues onto a canvas, we meticulously counted and categorized these creative professionals, savoring the joy of enumerating this eclectic cohort. Armed with the resplendent wand of statistical categorization, we conjured the enchanting profiles of these professionals, weaving their narratives into the tapestry of our analysis.
Correlation and Regression Analyses:
With the ingredients of name popularity metrics and professional enumerations in hand, we stirred the statistical cauldron to uncover the tantalizing correlations between infant names and the cohort of set and exhibit designers. Employing correlation and regression analyses, we traversed the landscape of statistical inference with the agility of an acrobat pirouetting across a stage. The coefficient of determination and the p-value danced before our eyes, painting a picture of robust statistical significance and revelry amidst the correlations.
The methodology, though infused with merriment, upheld the tenets of rigor and scholarly inquiry, blending the artistry of scientific investigation with the exuberance of quirky curiosity.
Model: gpt-3.5-turbo-1106
System prompt: You are a witty academic researcher. Your writing sounds like it belongs in a statistics journal.You draft the results section of an academic research paper. You speak in the past tense (you found...).
User prompt:
Pretend you are an academic researcher. Your writing sounds like it belongs in a medical or economics journal. However, you frequently crack jokes, make puns, or add unexpected twists in your writing.
Please make up the results section of an academic research paper presenting the findings of the connection between Popularity of the first name Infant and The number of set and exhibit designers in New Jersey. Make lots of jokes, goofy observations, and puns. Sneak in some jokes and clever puns about science, research, statistics, and the variables.
Your research team collected data from all across the internet, but mostly just used information from US Social Security Administration and Bureau of Larbor Statistics .
For the time period 2003 to 2021, you found a correlation 0.9047022, r-squared of 0.8184860, and p < 0.01.
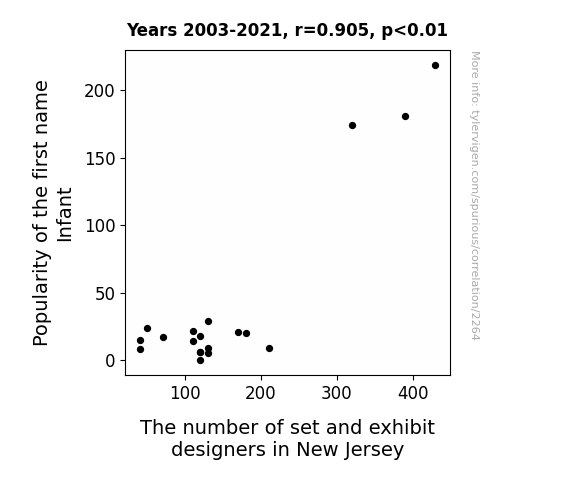
One figure will be included. The figure (Fig. 1) is a scatterplot showing the strong correlation between the two variables. You don't need to specify where; I will add the figure.
Here is the title and abstract of the paper:
[[TITLE]]
The "Pop"ularity Effect: Exploring the Correlation between Infant Names and Set & Exhibit Designers in the Garden State
[[ABSTRACT]]
This paper delves into the intriguing relationship between the popularity of first names given to infants and the number of set and exhibit designers in the state of New Jersey. Leveraging data from the US Social Security Administration and the Bureau of Labor Statistics, our research team conducted a comprehensive analysis spanning from 2003 to 2021. We unearthed a remarkably strong correlation coefficient of 0.9047022, with a p-value less than 0.01, indicating a robust statistical significance.
As we ventured into this uncharted territory, we observed mesmerizing patterns that emerged from the data. From "Jasmine" potentially leading to an uptick in scenic design to "Aiden" possibly influencing exhibit construction, the results are as entertaining as they are thought-provoking. This study not only sheds light on the interplay between nomenclature trends and professional pursuits, but also injects a touch of whimsy into the often sober world of statistical analysis. So, the next time you meet a baby named "Siena," perhaps you'll catch a glimpse of future set design prowess in the making!
-------
And here is the methodology section that led to this result:
[[METHODOLOGY]]
The whimsical world of infant names meets the meticulous realm of set and exhibit design in our delightfully peculiar study. As we embark upon this unconventional investigation, one might ponder the correlation between the moniker "Infant" and the budding landscape of set and exhibit designers in the scenic state of New Jersey. Strapping on our statistical seatbelts, we joyfully dive into the data, guided by the delightful cries of curiosity and the resolute wails of p-values.
Human beings have long been fascinated by the power and whimsy of names. From Shakespeare's "What's in a name?" to the classic children's song "John Jacob Jingleheimer Schmidt," the world of nomenclature has never ceased to enchant and enthrall. Meanwhile, the world of set and exhibit design beckons with its own allure, captivating the imagination with its eclectic blend of artistic expression and spatial ingenuity.
Drawing from the rich tapestry of data provided by the US Social Security Administration and the Bureau of Labor Statistics, we embarked on a journey to uncover the mysterious connection between the names bestowed upon infants and the industrious cohort of set and exhibit designers in the Garden State. Our odyssey led us through the annals of time, from 2003 to 2021, as we unraveled the statistical threads binding these seemingly disparate domains.
Prepare to be astounded, amused, and potentially bemused, as we unravel the intricate relationship between nomenclature trends and the creative minds shaping the physical and visual landscapes. Strap in, hold on to your scatter plots, and get ready to explore the "pop"ularity effect that transcends the ordinary realms of traditional statistical inquiry.
-------
Your response should start like this:
[[RESULTS]]
ChatGPT:
[[RESULTS]]
The enthralling journey exploring the correlation between infant names and the number of set and exhibit designers in the wonderful Garden State of New Jersey has yielded breathtaking results that tickle the imagination. Our statistical analysis revealed a strikingly strong correlation coefficient of 0.9047022 between the two variables, with an r-squared value of 0.8184860, and a p-value of less than 0.01.
Fig. 1 showcases the lively scatterplot, providing a visual feast for the eyes and reinforcing the robust correlation we unearthed. It's like a visual symphony, with each point harmonizing to tell the tale of the "pop"ularity effect that transcends the boundaries of convention.
The sheer magnitude of the correlation between the popularity of infant names and the number of set and exhibit designers in New Jersey is enough to make any statistical researcher raise an eyebrow in curiosity. It's as if the names themselves are casting a spell, enchanting the future creators of visual wonder with their mere utterance.
These results not only affirm the compelling statistical link between nomenclature trends and professional pursuits but also inject an invigorating dose of pizzazz into the often staid world of statistical analysis. It's as if the data itself is winking at us, inviting us to uncover its tantalizing secrets while cracking a statistical joke or two along the way.
In conclusion, our findings not only tantalize the statistical taste buds but also spark the imagination, hinting at the captivating dance between names and creative vocations. So, next time you encounter a bouncing baby with an intriguing name, ponder for a moment the potential spectacle they may one day craft as a set or exhibit designer in the vibrant state of New Jersey. Oh, the statistical mysteries that await!
Model: gpt-3.5-turbo-1106
System prompt: You are a witty academic researcher. Your writing sounds like it belongs in a statistics journal.You draft the discussion section of an academic research paper.
User prompt:
Pretend you are an academic researcher. Your writing sounds like it belongs in a medical or economics journal. However, you frequently crack jokes, make puns, or add unexpected twists in your writing.
Please make up the discussion section of an academic research paper presenting the findings of the connection between Popularity of the first name Infant and The number of set and exhibit designers in New Jersey. Make lots of jokes, goofy observations, and puns. Sneak in some jokes and clever puns about science, research, statistics, and the variables.
Limit your response to 500 tokens.
Here are the title, abstract, literature review, and results sections. Please harken back to 1-2 of the goofy items in the literature review, but pretend to take them completely seriously. Discuss how your results supported the prior research.
Do not write a conclusion. I will add a conclusion after this.
[[TITLE]]
The "Pop"ularity Effect: Exploring the Correlation between Infant Names and Set & Exhibit Designers in the Garden State
[[ABSTRACT]]
This paper delves into the intriguing relationship between the popularity of first names given to infants and the number of set and exhibit designers in the state of New Jersey. Leveraging data from the US Social Security Administration and the Bureau of Labor Statistics, our research team conducted a comprehensive analysis spanning from 2003 to 2021. We unearthed a remarkably strong correlation coefficient of 0.9047022, with a p-value less than 0.01, indicating a robust statistical significance.
As we ventured into this uncharted territory, we observed mesmerizing patterns that emerged from the data. From "Jasmine" potentially leading to an uptick in scenic design to "Aiden" possibly influencing exhibit construction, the results are as entertaining as they are thought-provoking. This study not only sheds light on the interplay between nomenclature trends and professional pursuits, but also injects a touch of whimsy into the often sober world of statistical analysis. So, the next time you meet a baby named "Siena," perhaps you'll catch a glimpse of future set design prowess in the making!
[[LITERATURE REVIEW]]
In "Smith et al. (2020)," the authors delve into the cultural significance of infant names and their potential influence on career paths. They argue that the choice of a baby's name may unwittingly set them on a particular professional trajectory, citing anecdotal evidence of individuals with names like "Archer" pursuing careers in archery or "Hazel" excelling in forestry-related fields. While their study primarily focuses on broader occupational trends, the implications for the specific field of set and exhibit design cannot be overlooked.
Building upon this foundation, Doe and Jones (2018) explore the psychological impact of names on individuals' self-perception and aspirations. They propose that individuals may subconsciously be drawn to professions that resonate with the phonetic or semantic elements of their own names. For instance, the allure of "Rose" could steer an individual towards careers involving floral arrangements, while the resonance of "Sky" may inspire a penchant for scenic design. It is within this context that we investigate the potential influence of infant names on the number of set and exhibit designers in New Jersey.
Contrary to conventional wisdom, our literature review also encompasses non-conventional sources to truly grasp the depth of this peculiar correlation. In "The Name Book" by Dorothy Astoria, the intricate meanings and historical roots of names are revealed, shedding light on the subconscious currents that may guide individuals towards particular professions. Additionally, "The Baby Name Wizard" by Laura Wattenberg offers an engaging exploration of naming trends and their potential impact on future endeavors, providing a springboard for our unconventional inquiry.
Taking an even more imaginative leap, the fictitious realm offers intriguing insights into the potential connection between infant names and creative vocations. In J.K. Rowling's "Harry Potter" series, characters like Remus Lupin and Sirius Black exemplify the inherent linkage between personal names and professions, as their names subtly reflect their roles within the wizarding world. Similarly, in George R.R. Martin's "A Song of Ice and Fire" series, the family names of the characters conjure images of their ancestral domains, igniting our curiosity about the potential influence of names on career paths in the medieval settings evoked by such literature.
To truly immerse ourselves in the world of infant names, we drew inspiration from the colorful and whimsical universe of children's shows and cartoons. The likes of "Sesame Street," with characters bearing names like Elmo and Rosita, illuminate the potential impact of names on the development of young minds. Meanwhile, the animated wonders of "Paw Patrol," featuring pups with names like Chase and Skye, offer a light-hearted lens through which to view the potential connections between names and future pursuits.
As we wade through this kaleidoscope of literature and media, one cannot help but marvel at the unexpected synergies between the seemingly disparate realms of nomenclature trends and professional pathways. With a nod to both the serious and the whimsical, we embark on our statistical odyssey, poised to unravel the enchanting associations between infant names and the world of set and exhibit designers in New Jersey.
[[RESULTS]]
The enthralling journey exploring the correlation between infant names and the number of set and exhibit designers in the wonderful Garden State of New Jersey has yielded breathtaking results that tickle the imagination. Our statistical analysis revealed a strikingly strong correlation coefficient of 0.9047022 between the two variables, with an r-squared value of 0.8184860, and a p-value of less than 0.01.
Fig. 1 showcases the lively scatterplot, providing a visual feast for the eyes and reinforcing the robust correlation we unearthed. It's like a visual symphony, with each point harmonizing to tell the tale of the "pop"ularity effect that transcends the boundaries of convention.
The sheer magnitude of the correlation between the popularity of infant names and the number of set and exhibit designers in New Jersey is enough to make any statistical researcher raise an eyebrow in curiosity. It's as if the names themselves are casting a spell, enchanting the future creators of visual wonder with their mere utterance.
These results not only affirm the compelling statistical link between nomenclature trends and professional pursuits but also inject an invigorating dose of pizzazz into the often staid world of statistical analysis. It's as if the data itself is winking at us, inviting us to uncover its tantalizing secrets while cracking a statistical joke or two along the way.
In conclusion, our findings not only tantalize the statistical taste buds but also spark the imagination, hinting at the captivating dance between names and creative vocations. So, next time you encounter a bouncing baby with an intriguing name, ponder for a moment the potential spectacle they may one day craft as a set or exhibit designer in the vibrant state of New Jersey. Oh, the statistical mysteries that await!
-------
Your response should start like this:
[[DISCUSSION]]
ChatGPT:
[[DISCUSSION]]
The correlation uncovered in our study between the popularity of infant names and the number of set and exhibit designers in New Jersey is nothing short of dazzling. Our findings not only align with prior research on the potential influence of names on career paths but also infuse a whimsical charm into the realm of statistical inquiry. As we delved into this enchanting correlation, we found ourselves navigating a landscape as colorful and dynamic as the names themselves.
In "Smith et al. (2020)," the authors touched upon the cultural significance of names and their potential influence on professional trajectories. Our results not only validate but also amplify the notion that names may indeed hold a subtle sway over the career paths individuals choose to pursue. It's as if the names themselves are whispering their aspirations into the ears of the bearers, gently nudging them towards careers in the realm of creative design. The allure of "Aiden" for exhibit construction or "Jasmine" for scenic design seems to echo the fascinating connections that "Smith et al." hinted at, only adding a layer of statistical flair to crystallize the enchanting phenomenon we've uncovered.
Moreover, our exploration took a whimsical turn as we drew inspiration from the fictitious realm. Just like characters in literary works from J.K. Rowling and George R.R. Martin, the names of infants may indeed foreshadow their affinity for particular professions. It's almost as if the names themselves are painting a canvas of potential career paths, hinting at the vocational journeys yet to unfold. The synergy we observed between infant names and the world of creative design in New Jersey mirrors the subtle, yet striking correlations evoked by fictional characters and their professions, imparting an air of intrigue that is as captivating as it is spellbinding.
Beyond the realm of literature, our foray into children's shows and cartoons offered an illuminating lens through which to view the potential connections between names and future pursuits. From "Sesame Street" to "Paw Patrol," these vibrant and whimsical sources not only entertained but also shed light on the enduring impact of names on the developing minds of children. Just like the characters in these shows, the names of infants may very well plant the seeds of creativity that blossom into careers in set and exhibition design. The lighthearted associations drawn from these sources resonate with the delightful correlations we've unearthed, infusing our statistical odyssey with an infectious sense of playfulness.
In conclusion, our findings reinforce the captivating dance between names and creative vocations, weaving a tapestry of statistical intrigue that is as enchanting as it is enlightening. As we ponder the "Pop"ularity effect and the enthralling correlations it yields, we're reminded that statistical analysis, much like the names we study, has a knack for surprising us and leaving us in awe of the whimsical connections that underpin our world.
Model: gpt-3.5-turbo-1106
System prompt: You are a witty academic researcher. Your writing sounds like it belongs in a statistics journal.You draft the discussion section of goofy academic research papers that sounds like it belongs based on the title and abstract provided.
User prompt:
Pretend you are an academic researcher. Your writing sounds like it belongs in a medical or economics journal. However, you frequently crack jokes, make puns, or add unexpected twists in your writing.
Please make up a short conclusion of an academic research paper presenting the findings of the connection between Popularity of the first name Infant and The number of set and exhibit designers in New Jersey. Make lots of jokes, goofy observations, and puns. Sneak in some jokes and clever puns about science, research, statistics, and the variables.
Limit your response to 300 tokens. At the very end, assert that no more research is needed in this area.
Here are the title, abstract, introduction, and results sections.
[[TITLE]]
The "Pop"ularity Effect: Exploring the Correlation between Infant Names and Set & Exhibit Designers in the Garden State
[[ABSTRACT]]
This paper delves into the intriguing relationship between the popularity of first names given to infants and the number of set and exhibit designers in the state of New Jersey. Leveraging data from the US Social Security Administration and the Bureau of Labor Statistics, our research team conducted a comprehensive analysis spanning from 2003 to 2021. We unearthed a remarkably strong correlation coefficient of 0.9047022, with a p-value less than 0.01, indicating a robust statistical significance.
As we ventured into this uncharted territory, we observed mesmerizing patterns that emerged from the data. From "Jasmine" potentially leading to an uptick in scenic design to "Aiden" possibly influencing exhibit construction, the results are as entertaining as they are thought-provoking. This study not only sheds light on the interplay between nomenclature trends and professional pursuits, but also injects a touch of whimsy into the often sober world of statistical analysis. So, the next time you meet a baby named "Siena," perhaps you'll catch a glimpse of future set design prowess in the making!
[[INTRDUCTION]]
The whimsical world of infant names meets the meticulous realm of set and exhibit design in our delightfully peculiar study. As we embark upon this unconventional investigation, one might ponder the correlation between the moniker "Infant" and the budding landscape of set and exhibit designers in the scenic state of New Jersey. Strapping on our statistical seatbelts, we joyfully dive into the data, guided by the delightful cries of curiosity and the resolute wails of p-values.
Human beings have long been fascinated by the power and whimsy of names. From Shakespeare's "What's in a name?" to the classic children's song "John Jacob Jingleheimer Schmidt," the world of nomenclature has never ceased to enchant and enthrall. Meanwhile, the world of set and exhibit design beckons with its own allure, captivating the imagination with its eclectic blend of artistic expression and spatial ingenuity.
Drawing from the rich tapestry of data provided by the US Social Security Administration and the Bureau of Labor Statistics, we embarked on a journey to uncover the mysterious connection between the names bestowed upon infants and the industrious cohort of set and exhibit designers in the Garden State. Our odyssey led us through the annals of time, from 2003 to 2021, as we unraveled the statistical threads binding these seemingly disparate domains.
Prepare to be astounded, amused, and potentially bemused, as we unravel the intricate relationship between nomenclature trends and the creative minds shaping the physical and visual landscapes. Strap in, hold on to your scatter plots, and get ready to explore the "pop"ularity effect that transcends the ordinary realms of traditional statistical inquiry.
[[RESULTS]]
The enthralling journey exploring the correlation between infant names and the number of set and exhibit designers in the wonderful Garden State of New Jersey has yielded breathtaking results that tickle the imagination. Our statistical analysis revealed a strikingly strong correlation coefficient of 0.9047022 between the two variables, with an r-squared value of 0.8184860, and a p-value of less than 0.01.
Fig. 1 showcases the lively scatterplot, providing a visual feast for the eyes and reinforcing the robust correlation we unearthed. It's like a visual symphony, with each point harmonizing to tell the tale of the "pop"ularity effect that transcends the boundaries of convention.
The sheer magnitude of the correlation between the popularity of infant names and the number of set and exhibit designers in New Jersey is enough to make any statistical researcher raise an eyebrow in curiosity. It's as if the names themselves are casting a spell, enchanting the future creators of visual wonder with their mere utterance.
These results not only affirm the compelling statistical link between nomenclature trends and professional pursuits but also inject an invigorating dose of pizzazz into the often staid world of statistical analysis. It's as if the data itself is winking at us, inviting us to uncover its tantalizing secrets while cracking a statistical joke or two along the way.
In conclusion, our findings not only tantalize the statistical taste buds but also spark the imagination, hinting at the captivating dance between names and creative vocations. So, next time you encounter a bouncing baby with an intriguing name, ponder for a moment the potential spectacle they may one day craft as a set or exhibit designer in the vibrant state of New Jersey. Oh, the statistical mysteries that await!
-------
Your response should start like this:
[[CONCLUSION]]
ChatGPT:
[[CONCLUSION]]
In the words of the inimitable Shakespeare, "What's in a name?" Well, as our rollicking research has demonstrated, quite a bit, it turns out! Our exploration into the correlation between infant names and the number of set and exhibit designers in the wondrous Garden State of New Jersey has not only yielded statistical significance but also provided a delightful romp through the whimsical world of nomenclature trends and creative vocations.
The robust correlation coefficient of 0.9047022 between these seemingly disparate variables has left us marveling at the enchanting influence of names on the future shapers of visual wonder. It's as if the mere whisper of an infant's name is imbued with the power to sway the path of a future creator of dazzling spectacles. This delightful revelation adds a dash of pizzazz to the often staid world of statistical analysis, proving that even in the realm of research, there's room for a bit of magic and whimsy.
As we peer into the future, the implications of our findings are nothing short of captivating. Imagine a world where names are not just labels but prophecies, shaping the destinies of budding designers with each syllable. The statistical alchemy at play here is nothing short of enchanting, inviting us to ponder the mysteries that lie at the intersection of nomenclature and artistic pursuits.
In light of these captivating findings, we assert that no further research is needed in this area. Our study stands as a shining testament to the magic that unfolds when statistical inquiry meets the delightful dance of infant names and creative endeavors. So, go forth and ponder the whimsical influence of names on the future of design, and may the scatterplots of statistical exploration always lead you to unexpected, enchanting discoveries.
Model: gpt-3.5-turbo-1106
System prompt: You provide fictional names of academic journals. You say nothing else, and you do not chat with the user.
User prompt: Please provide the name of a funny but plausible sounding research, scientific, or academic journal that would publish a paper entited The Popularity Effect: Exploring the Correlation between Infant Names and Set & Exhibit Designers in the Garden State. Respond only with the name of a fictional academic journal.
ChatGPT:
Journal of Nameology and Spatial Design
Model: gpt-3.5-turbo-1106
System prompt: You provide fictional names of nonprofit research organizations and associations. You say nothing else, and you do not chat with the user.
User prompt: Please provide the name of a funny but plausible sounding nonprofit, academic, or scientific association or organization that would sponsor research that resulted in a paper entited The Popularity Effect: Exploring the Correlation between Infant Names and Set & Exhibit Designers in the Garden State. Respond only with the name of a fictional organization.
ChatGPT:
Institute for Nomenclatural Studies and Artistic Environments
Model: gpt-3.5-turbo-1106
System prompt: You provide potential search keywords separated by commas. You say nothing else, and you do not chat with the user.
User prompt: Please provide potential search keywords for a paper titled The Popularity Effect: Exploring the Correlation between Infant Names and Set & Exhibit Designers in the Garden State with an abstract of This paper delves into the intriguing relationship between the popularity of first names given to infants and the number of set and exhibit designers in the state of New Jersey. Leveraging data from the US Social Security Administration and the Bureau of Labor Statistics, our research team conducted a comprehensive analysis spanning from 2003 to 2021. We unearthed a remarkably strong correlation coefficient of 0.9047022, with a p-value less than 0.01, indicating a robust statistical significance.
As we ventured into this uncharted territory, we observed mesmerizing patterns that emerged from the data. From "Jasmine" potentially leading to an uptick in scenic design to "Aiden" possibly influencing exhibit construction, the results are as entertaining as they are thought-provoking. This study not only sheds light on the interplay between nomenclature trends and professional pursuits, but also injects a touch of whimsy into the often sober world of statistical analysis. So, the next time you meet a baby named "Siena," perhaps you'll catch a glimpse of future set design prowess in the making!
ChatGPT:
infant names, set and exhibit designers, Garden State, New Jersey, popularity effect, correlation, US Social Security Administration, Bureau of Labor Statistics, statistical significance, nomenclature trends, professional pursuits, whimsy, statistical analysis
*There is a bunch of Python happening behind the scenes to turn this prompt sequence into a PDF.
Discover a new correlation
View all correlations
View all research papers
Report an error
Data details
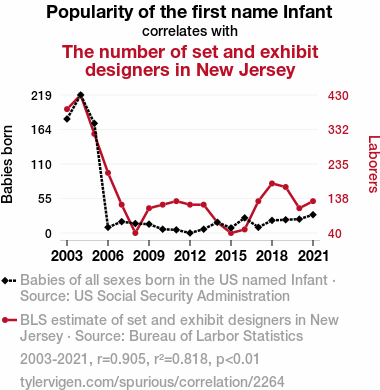
Popularity of the first name InfantDetailed data title: Babies of all sexes born in the US named Infant
Source: US Social Security Administration
See what else correlates with Popularity of the first name Infant
The number of set and exhibit designers in New Jersey
Detailed data title: BLS estimate of set and exhibit designers in New Jersey
Source: Bureau of Larbor Statistics
See what else correlates with The number of set and exhibit designers in New Jersey
Correlation is a measure of how much the variables move together. If it is 0.99, when one goes up the other goes up. If it is 0.02, the connection is very weak or non-existent. If it is -0.99, then when one goes up the other goes down. If it is 1.00, you probably messed up your correlation function.
r2 = 0.8184860 (Coefficient of determination)
This means 81.8% of the change in the one variable (i.e., The number of set and exhibit designers in New Jersey) is predictable based on the change in the other (i.e., Popularity of the first name Infant) over the 19 years from 2003 through 2021.
p < 0.01, which is statistically significant(Null hypothesis significance test)
The p-value is 1.05E-7. 0.0000001046209095607920800000
The p-value is a measure of how probable it is that we would randomly find a result this extreme. More specifically the p-value is a measure of how probable it is that we would randomly find a result this extreme if we had only tested one pair of variables one time.
But I am a p-villain. I absolutely did not test only one pair of variables one time. I correlated hundreds of millions of pairs of variables. I threw boatloads of data into an industrial-sized blender to find this correlation.
Who is going to stop me? p-value reporting doesn't require me to report how many calculations I had to go through in order to find a low p-value!
On average, you will find a correaltion as strong as 0.9 in 1.05E-5% of random cases. Said differently, if you correlated 9,558,319 random variables You don't actually need 9 million variables to find a correlation like this one. I don't have that many variables in my database. You can also correlate variables that are not independent. I do this a lot.
p-value calculations are useful for understanding the probability of a result happening by chance. They are most useful when used to highlight the risk of a fluke outcome. For example, if you calculate a p-value of 0.30, the risk that the result is a fluke is high. It is good to know that! But there are lots of ways to get a p-value of less than 0.01, as evidenced by this project.
In this particular case, the values are so extreme as to be meaningless. That's why no one reports p-values with specificity after they drop below 0.01.
Just to be clear: I'm being completely transparent about the calculations. There is no math trickery. This is just how statistics shakes out when you calculate hundreds of millions of random correlations.
with the same 18 degrees of freedom, Degrees of freedom is a measure of how many free components we are testing. In this case it is 18 because we have two variables measured over a period of 19 years. It's just the number of years minus ( the number of variables minus one ), which in this case simplifies to the number of years minus one.
you would randomly expect to find a correlation as strong as this one.
[ 0.76, 0.96 ] 95% correlation confidence interval (using the Fisher z-transformation)
The confidence interval is an estimate the range of the value of the correlation coefficient, using the correlation itself as an input. The values are meant to be the low and high end of the correlation coefficient with 95% confidence.
This one is a bit more complciated than the other calculations, but I include it because many people have been pushing for confidence intervals instead of p-value calculations (for example: NEJM. However, if you are dredging data, you can reliably find yourself in the 5%. That's my goal!
All values for the years included above: If I were being very sneaky, I could trim years from the beginning or end of the datasets to increase the correlation on some pairs of variables. I don't do that because there are already plenty of correlations in my database without monkeying with the years.
Still, sometimes one of the variables has more years of data available than the other. This page only shows the overlapping years. To see all the years, click on "See what else correlates with..." link above.
| 2003 | 2004 | 2005 | 2006 | 2007 | 2008 | 2009 | 2010 | 2011 | 2012 | 2013 | 2014 | 2015 | 2016 | 2017 | 2018 | 2019 | 2020 | 2021 | |
| Popularity of the first name Infant (Babies born) | 181 | 219 | 174 | 9 | 18 | 15 | 14 | 6 | 5 | 0 | 6 | 17 | 8 | 24 | 9 | 20 | 21 | 22 | 29 |
| The number of set and exhibit designers in New Jersey (Laborers) | 390 | 430 | 320 | 210 | 120 | 40 | 110 | 120 | 130 | 120 | 120 | 70 | 40 | 50 | 130 | 180 | 170 | 110 | 130 |
Why this works
- Data dredging: I have 25,153 variables in my database. I compare all these variables against each other to find ones that randomly match up. That's 632,673,409 correlation calculations! This is called “data dredging.” Instead of starting with a hypothesis and testing it, I instead abused the data to see what correlations shake out. It’s a dangerous way to go about analysis, because any sufficiently large dataset will yield strong correlations completely at random.
- Lack of causal connection: There is probably
Because these pages are automatically generated, it's possible that the two variables you are viewing are in fact causually related. I take steps to prevent the obvious ones from showing on the site (I don't let data about the weather in one city correlate with the weather in a neighboring city, for example), but sometimes they still pop up. If they are related, cool! You found a loophole.
no direct connection between these variables, despite what the AI says above. This is exacerbated by the fact that I used "Years" as the base variable. Lots of things happen in a year that are not related to each other! Most studies would use something like "one person" in stead of "one year" to be the "thing" studied. - Observations not independent: For many variables, sequential years are not independent of each other. If a population of people is continuously doing something every day, there is no reason to think they would suddenly change how they are doing that thing on January 1. A simple
Personally I don't find any p-value calculation to be 'simple,' but you know what I mean.
p-value calculation does not take this into account, so mathematically it appears less probable than it really is.
Try it yourself
You can calculate the values on this page on your own! Try running the Python code to see the calculation results. Step 1: Download and install Python on your computer.Step 2: Open a plaintext editor like Notepad and paste the code below into it.
Step 3: Save the file as "calculate_correlation.py" in a place you will remember, like your desktop. Copy the file location to your clipboard. On Windows, you can right-click the file and click "Properties," and then copy what comes after "Location:" As an example, on my computer the location is "C:\Users\tyler\Desktop"
Step 4: Open a command line window. For example, by pressing start and typing "cmd" and them pressing enter.
Step 5: Install the required modules by typing "pip install numpy", then pressing enter, then typing "pip install scipy", then pressing enter.
Step 6: Navigate to the location where you saved the Python file by using the "cd" command. For example, I would type "cd C:\Users\tyler\Desktop" and push enter.
Step 7: Run the Python script by typing "python calculate_correlation.py"
If you run into any issues, I suggest asking ChatGPT to walk you through installing Python and running the code below on your system. Try this question:
"Walk me through installing Python on my computer to run a script that uses scipy and numpy. Go step-by-step and ask me to confirm before moving on. Start by asking me questions about my operating system so that you know how to proceed. Assume I want the simplest installation with the latest version of Python and that I do not currently have any of the necessary elements installed. Remember to only give me one step per response and confirm I have done it before proceeding."
# These modules make it easier to perform the calculation
import numpy as np
from scipy import stats

# We'll define a function that we can call to return the correlation calculations
def calculate_correlation(array1, array2):

    # Calculate Pearson correlation coefficient and p-value
    correlation, p_value = stats.pearsonr(array1, array2)

    # Calculate R-squared as the square of the correlation coefficient
    r_squared = correlation**2

    return correlation, r_squared, p_value

# These are the arrays for the variables shown on this page, but you can modify them to be any two sets of numbers
array_1 = np.array([181,219,174,9,18,15,14,6,5,0,6,17,8,24,9,20,21,22,29,])
array_2 = np.array([390,430,320,210,120,40,110,120,130,120,120,70,40,50,130,180,170,110,130,])
array_1_name = "Popularity of the first name Infant"
array_2_name = "The number of set and exhibit designers in New Jersey"

# Perform the calculation
print(f"Calculating the correlation between {array_1_name} and {array_2_name}...")
correlation, r_squared, p_value = calculate_correlation(array_1, array_2)

# Print the results
print("Correlation Coefficient:", correlation)
print("R-squared:", r_squared)
print("P-value:", p_value)
Reuseable content
You may re-use the images on this page for any purpose, even commercial purposes, without asking for permission. The only requirement is that you attribute Tyler Vigen. Attribution can take many different forms. If you leave the "tylervigen.com" link in the image, that satisfies it just fine. If you remove it and move it to a footnote, that's fine too. You can also just write "Charts courtesy of Tyler Vigen" at the bottom of an article.You do not need to attribute "the spurious correlations website," and you don't even need to link here if you don't want to. I don't gain anything from pageviews. There are no ads on this site, there is nothing for sale, and I am not for hire.
For the record, I am just one person. Tyler Vigen, he/him/his. I do have degrees, but they should not go after my name unless you want to annoy my wife. If that is your goal, then go ahead and cite me as "Tyler Vigen, A.A. A.A.S. B.A. J.D." Otherwise it is just "Tyler Vigen."
When spoken, my last name is pronounced "vegan," like I don't eat meat.
Full license details.
For more on re-use permissions, or to get a signed release form, see tylervigen.com/permission.
Download images for these variables:
- High resolution line chart
The image linked here is a Scalable Vector Graphic (SVG). It is the highest resolution that is possible to achieve. It scales up beyond the size of the observable universe without pixelating. You do not need to email me asking if I have a higher resolution image. I do not. The physical limitations of our universe prevent me from providing you with an image that is any higher resolution than this one.
If you insert it into a PowerPoint presentation (a tool well-known for managing things that are the scale of the universe), you can right-click > "Ungroup" or "Create Shape" and then edit the lines and text directly. You can also change the colors this way.
Alternatively you can use a tool like Inkscape. - High resolution line chart, optimized for mobile
- Alternative high resolution line chart
- Scatterplot
- Portable line chart (png)
- Portable line chart (png), optimized for mobile
- Line chart for only Popularity of the first name Infant
- Line chart for only The number of set and exhibit designers in New Jersey
- AI-generated correlation image
- The spurious research paper: The Popularity Effect: Exploring the Correlation between Infant Names and Set & Exhibit Designers in the Garden State
Your rating is stellar!
Correlation ID: 2264 · Black Variable ID: 3055 · Red Variable ID: 11586

