
Download png, svg
Check back later, or email me if you'd enjoy seeing this work in real-time.
Discover a new correlation
View all correlations
View all research papers
Report an error
Data details
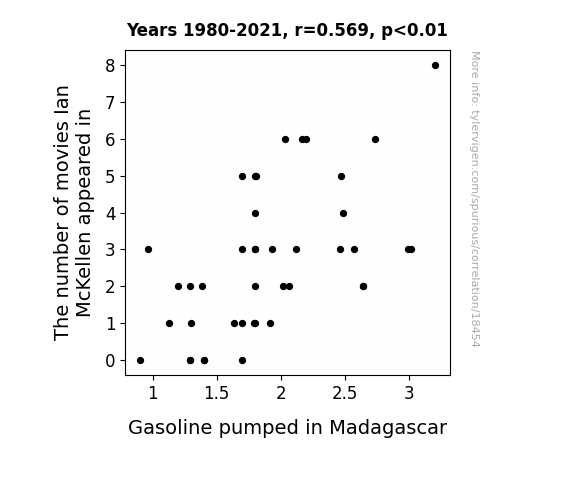
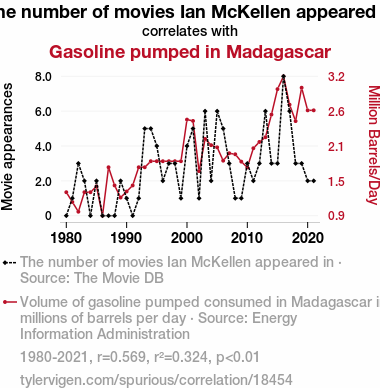
The number of movies Ian McKellen appeared inSource: The Movie DB
Additional Info: Gods and Monsters (1998); Neverwas (2005); Richard III (1995); Émile (2003); King Lear (2008); Cirque du Soleil: Journey of Man (2000); Priest of Love (1981); Walter (1982); Saint of 9/11 (2006); Walter and June (1983); Muse of Fire (2013); A Bit Of Scarlet (1997); Ian McKellen: Acting Shakespeare (1982); Othello (1990); Miss in Her Teens (2014); Mr. Holmes (2015); The Dresser (2015); Looking for Lowry (2011); McKellen: Playing the Part (2018); National Theatre Live: King Lear (2018); Edmund the Magnificent (2017); How a Kite Flies (2017); The Egg Trick (2013); Countdown to War (1989); Play the Devil: Making Richard III (2016); Shakespeare on Film (2016); Shakespeare on Stage, Screen and Elsewhere with Ian McKellen (2016); Ian McKellen on Stage: With Tolkien, Shakespeare, Others and YOU (2020); Theatreland (2009); Surviving Friendly Fire (1997); The Critic (2023); Hamlet Within (2022); Every Good Boy Deserves Favour (1979); Stonewall 25: Global Voices of Pride and Protest (1994); The Lord of the Rings: The Fellowship of the Ring (2001); Apt Pupil (1998); Macbeth (1979); X-Men: The Last Stand (2006); X-Men (2000); The Hobbit: An Unexpected Journey (2012); The Hobbit: The Desolation of Smaug (2013); The Hobbit: The Battle of the Five Armies (2014); London 2012: Paralympics Opening Ceremony (2012); The Hobart Shakespeareans (2005); National Theatre Live: No Man's Land (2016); X-Men: Premieres Around the World (2003); A Lost and Found Box of Human Sensation (2010); The Good Liar (2019); David Macaulay: Roman City (1994); Hating Peter Tatchell (2021); Du Fu: China's Greatest Poet (2020); Gladio (1992); All the World's a Screen: Shakespeare on Film (2016); Amol Rajan Interviews Ian McKellen (2022); Armistead Maupin Is a Man I Dreamt Up (1993); The Lord of the Rings: The Return of the King (2003); The Da Vinci Code (2006); Swept from the Sea (1998); Flushed Away (2006); The Scarlet Pimpernel (1982); Asylum (2005); X2 (2003); The Magic Roundabout (2005); Rasputin (1996); The Ballad of Little Jo (1993); Now You See Him: 'The Invisible Man' Revealed! (2000); For the Love of God (2007); A Passage to Middle-earth: Making of 'Lord of the Rings' (2001); All Is True (2018); Infinitum: Subject Unknown (2021); Larry & Vivien: The Oliviers in Love (2001); Knights of Classic Drama at the BBC (2015); Six Degrees of Separation (1993); Scandal (1989); Bent (1997); Animal Crackers (2017); The Untold Tales of Armistead Maupin (2017); The Quest Fulfilled: A Director's Vision (2003); Beyond the Movie: The Fellowship of the Ring (2001); The Wolverine: Path of a Ronin (2013); Peter Tatchell: Just Who Does He Think He Is? (2004); Quintessentially British (2022); The Lord of the Rings: The Two Towers (2002); The Shadow (1994); Plenty (1985); X-Men: Days of Future Past (2014); The Roof (2016); Quest for the Ring (2001); The World of Gods and Monsters: A Journey with James Whale (1999); Eighteen (2005); Ringers: Lord of the Fans (2005); The One Note Man (2023); The Golden Compass (2007); The Keep (1983); To Die For (1994); Shakespeare Live! From the RSC (2016); Cold Comfort Farm (1995); Restoration (1995); Cats (2019); Frodo Is Great... Who Is That?!! (2004); X-Men: The Mutant Watch (2000); An Evening with Lily Savage (1996); The Betty Driver Story (2011); Small-Time Revolutionary (2010); Stardust (2007); Judi Dench: All the World's Her Stage (2016); Film Collectibles: Capturing Movie Memories (2003); Jack & Sarah (1995); Doogal (2006); On Broadway (2019); Zina (1985); I'll Do Anything (1994); Doctor Who: The Snowmen (2012); Beauty and the Beast (2017); Last Action Hero (1993); The Paul O'Grady Story (2017); And the Band Played On (1993); The Vanishing Army (1978); The Five(ish) Doctors Reboot (2013); The Wolverine (2013); Never Sleep Again: The Elm Street Legacy (2010)
See what else correlates with The number of movies Ian McKellen appeared in
Gasoline pumped in Madagascar
Detailed data title: Volume of gasoline pumped consumed in Madagascar in millions of barrels per day
Source: Energy Information Administration
See what else correlates with Gasoline pumped in Madagascar
Correlation is a measure of how much the variables move together. If it is 0.99, when one goes up the other goes up. If it is 0.02, the connection is very weak or non-existent. If it is -0.99, then when one goes up the other goes down. If it is 1.00, you probably messed up your correlation function.
r2 = 0.3239500 (Coefficient of determination)
This means 32.4% of the change in the one variable (i.e., Gasoline pumped in Madagascar) is predictable based on the change in the other (i.e., The number of movies Ian McKellen appeared in) over the 42 years from 1980 through 2021.
p < 0.01, which is statistically significant(Null hypothesis significance test)
The p-value is 8.4E-5. 0.0000837632481058949100000000
The p-value is a measure of how probable it is that we would randomly find a result this extreme. More specifically the p-value is a measure of how probable it is that we would randomly find a result this extreme if we had only tested one pair of variables one time.
But I am a p-villain. I absolutely did not test only one pair of variables one time. I correlated hundreds of millions of pairs of variables. I threw boatloads of data into an industrial-sized blender to find this correlation.
Who is going to stop me? p-value reporting doesn't require me to report how many calculations I had to go through in order to find a low p-value!
On average, you will find a correaltion as strong as 0.57 in 0.0084% of random cases. Said differently, if you correlated 11,938 random variables Which I absolutely did.
with the same 41 degrees of freedom, Degrees of freedom is a measure of how many free components we are testing. In this case it is 41 because we have two variables measured over a period of 42 years. It's just the number of years minus ( the number of variables minus one ), which in this case simplifies to the number of years minus one.
you would randomly expect to find a correlation as strong as this one.
[ 0.32, 0.74 ] 95% correlation confidence interval (using the Fisher z-transformation)
The confidence interval is an estimate the range of the value of the correlation coefficient, using the correlation itself as an input. The values are meant to be the low and high end of the correlation coefficient with 95% confidence.
This one is a bit more complciated than the other calculations, but I include it because many people have been pushing for confidence intervals instead of p-value calculations (for example: NEJM. However, if you are dredging data, you can reliably find yourself in the 5%. That's my goal!
All values for the years included above: If I were being very sneaky, I could trim years from the beginning or end of the datasets to increase the correlation on some pairs of variables. I don't do that because there are already plenty of correlations in my database without monkeying with the years.
Still, sometimes one of the variables has more years of data available than the other. This page only shows the overlapping years. To see all the years, click on "See what else correlates with..." link above.
| 1980 | 1981 | 1982 | 1983 | 1984 | 1985 | 1986 | 1987 | 1988 | 1989 | 1990 | 1991 | 1992 | 1993 | 1994 | 1995 | 1996 | 1997 | 1998 | 1999 | 2000 | 2001 | 2002 | 2003 | 2004 | 2005 | 2006 | 2007 | 2008 | 2009 | 2010 | 2011 | 2012 | 2013 | 2014 | 2015 | 2016 | 2017 | 2018 | 2019 | 2020 | 2021 | |
| The number of movies Ian McKellen appeared in (Movie appearances) | 0 | 1 | 3 | 2 | 0 | 2 | 0 | 0 | 0 | 2 | 1 | 0 | 1 | 5 | 5 | 4 | 2 | 3 | 3 | 1 | 4 | 5 | 1 | 6 | 2 | 6 | 5 | 3 | 1 | 1 | 3 | 2 | 3 | 6 | 3 | 3 | 8 | 6 | 3 | 3 | 2 | 2 |
| Gasoline pumped in Madagascar (Million Barrels/Day) | 1.28779 | 1.12682 | 0.965843 | 1.28779 | 1.28779 | 1.38438 | 0.9 | 1.7 | 1.4 | 1.2 | 1.3 | 1.4 | 1.7 | 1.7 | 1.8 | 1.8 | 1.8 | 1.8 | 1.8 | 1.8 | 2.48773 | 2.46545 | 1.6367 | 2.16771 | 2.06509 | 2.02922 | 1.80915 | 1.93191 | 1.9146 | 1.79336 | 1.69638 | 2.01432 | 2.11838 | 2.19628 | 2.57068 | 2.99101 | 3.20315 | 2.73427 | 2.46292 | 3.01471 | 2.64079 | 2.64079 |
Why this works
- Data dredging: I have 25,237 variables in my database. I compare all these variables against each other to find ones that randomly match up. That's 636,906,169 correlation calculations! This is called “data dredging.” Instead of starting with a hypothesis and testing it, I instead abused the data to see what correlations shake out. It’s a dangerous way to go about analysis, because any sufficiently large dataset will yield strong correlations completely at random.
- Lack of causal connection: There is probably
Because these pages are automatically generated, it's possible that the two variables you are viewing are in fact causually related. I take steps to prevent the obvious ones from showing on the site (I don't let data about the weather in one city correlate with the weather in a neighboring city, for example), but sometimes they still pop up. If they are related, cool! You found a loophole.
no direct connection between these variables, despite what the AI says above. This is exacerbated by the fact that I used "Years" as the base variable. Lots of things happen in a year that are not related to each other! Most studies would use something like "one person" in stead of "one year" to be the "thing" studied. - Observations not independent: For many variables, sequential years are not independent of each other. If a population of people is continuously doing something every day, there is no reason to think they would suddenly change how they are doing that thing on January 1. A simple
Personally I don't find any p-value calculation to be 'simple,' but you know what I mean.
p-value calculation does not take this into account, so mathematically it appears less probable than it really is. - Outlandish outliers: There are "outliers" in this data.
In concept, "outlier" just means "way different than the rest of your dataset." When calculating a correlation like this, they are particularly impactful because a single outlier can substantially increase your correlation.
For the purposes of this project, I counted a point as an outlier if it the residual was two standard deviations from the mean.
(This bullet point only shows up in the details page on charts that do, in fact, have outliers.)
They stand out on the scatterplot above: notice the dots that are far away from any other dots. I intentionally mishandeled outliers, which makes the correlation look extra strong.
Try it yourself
You can calculate the values on this page on your own! Try running the Python code to see the calculation results. Step 1: Download and install Python on your computer.Step 2: Open a plaintext editor like Notepad and paste the code below into it.
Step 3: Save the file as "calculate_correlation.py" in a place you will remember, like your desktop. Copy the file location to your clipboard. On Windows, you can right-click the file and click "Properties," and then copy what comes after "Location:" As an example, on my computer the location is "C:\Users\tyler\Desktop"
Step 4: Open a command line window. For example, by pressing start and typing "cmd" and them pressing enter.
Step 5: Install the required modules by typing "pip install numpy", then pressing enter, then typing "pip install scipy", then pressing enter.
Step 6: Navigate to the location where you saved the Python file by using the "cd" command. For example, I would type "cd C:\Users\tyler\Desktop" and push enter.
Step 7: Run the Python script by typing "python calculate_correlation.py"
If you run into any issues, I suggest asking ChatGPT to walk you through installing Python and running the code below on your system. Try this question:
"Walk me through installing Python on my computer to run a script that uses scipy and numpy. Go step-by-step and ask me to confirm before moving on. Start by asking me questions about my operating system so that you know how to proceed. Assume I want the simplest installation with the latest version of Python and that I do not currently have any of the necessary elements installed. Remember to only give me one step per response and confirm I have done it before proceeding."
# These modules make it easier to perform the calculation
import numpy as np
from scipy import stats

# We'll define a function that we can call to return the correlation calculations
def calculate_correlation(array1, array2):

    # Calculate Pearson correlation coefficient and p-value
    correlation, p_value = stats.pearsonr(array1, array2)

    # Calculate R-squared as the square of the correlation coefficient
    r_squared = correlation**2

    return correlation, r_squared, p_value

# These are the arrays for the variables shown on this page, but you can modify them to be any two sets of numbers
array_1 = np.array([0,1,3,2,0,2,0,0,0,2,1,0,1,5,5,4,2,3,3,1,4,5,1,6,2,6,5,3,1,1,3,2,3,6,3,3,8,6,3,3,2,2,])
array_2 = np.array([1.28779,1.12682,0.965843,1.28779,1.28779,1.38438,0.9,1.7,1.4,1.2,1.3,1.4,1.7,1.7,1.8,1.8,1.8,1.8,1.8,1.8,2.48773,2.46545,1.6367,2.16771,2.06509,2.02922,1.80915,1.93191,1.9146,1.79336,1.69638,2.01432,2.11838,2.19628,2.57068,2.99101,3.20315,2.73427,2.46292,3.01471,2.64079,2.64079,])
array_1_name = "The number of movies Ian McKellen appeared in"
array_2_name = "Gasoline pumped in Madagascar"

# Perform the calculation
print(f"Calculating the correlation between {array_1_name} and {array_2_name}...")
correlation, r_squared, p_value = calculate_correlation(array_1, array_2)

# Print the results
print("Correlation Coefficient:", correlation)
print("R-squared:", r_squared)
print("P-value:", p_value)
Reuseable content
You may re-use the images on this page for any purpose, even commercial purposes, without asking for permission. The only requirement is that you attribute Tyler Vigen. Attribution can take many different forms. If you leave the "tylervigen.com" link in the image, that satisfies it just fine. If you remove it and move it to a footnote, that's fine too. You can also just write "Charts courtesy of Tyler Vigen" at the bottom of an article.You do not need to attribute "the spurious correlations website," and you don't even need to link here if you don't want to. I don't gain anything from pageviews. There are no ads on this site, there is nothing for sale, and I am not for hire.
For the record, I am just one person. Tyler Vigen, he/him/his. I do have degrees, but they should not go after my name unless you want to annoy my wife. If that is your goal, then go ahead and cite me as "Tyler Vigen, A.A. A.A.S. B.A. J.D." Otherwise it is just "Tyler Vigen."
When spoken, my last name is pronounced "vegan," like I don't eat meat.
Full license details.
For more on re-use permissions, or to get a signed release form, see tylervigen.com/permission.
Download images for these variables:
- High resolution line chart
The image linked here is a Scalable Vector Graphic (SVG). It is the highest resolution that is possible to achieve. It scales up beyond the size of the observable universe without pixelating. You do not need to email me asking if I have a higher resolution image. I do not. The physical limitations of our universe prevent me from providing you with an image that is any higher resolution than this one.
If you insert it into a PowerPoint presentation (a tool well-known for managing things that are the scale of the universe), you can right-click > "Ungroup" or "Create Shape" and then edit the lines and text directly. You can also change the colors this way.
Alternatively you can use a tool like Inkscape. - High resolution line chart, optimized for mobile
- Alternative high resolution line chart
- Scatterplot
- Portable line chart (png)
- Portable line chart (png), optimized for mobile
- Line chart for only The number of movies Ian McKellen appeared in
- Line chart for only Gasoline pumped in Madagascar
Thanks for being the explorer we needed!
Correlation ID: 18454 · Black Variable ID: 26540 · Red Variable ID: 24653

