
Download png, svg
AI explanation
It's simple, really. The name Barrett has been revving up in popularity, and it seems to have sparked some kind of bumper-to-bumper connection with the automotive industry. Perhaps there's a new trend where all the little Barretts out there are just car magnets, drawing attention to potential issues. It's like the Mercedes-Benz is saying, "Danke for the heads-up, Barrett brigade! Looks like we've got a kid in every car now, bringing a whole new meaning to 'recall-ling' all units." Who knew that a rising first name could gear up such a response from a luxury car manufacturer? Looks like when it comes to automotive recalls, Barrett is definitely in drive!
Model: dalle-3
Prompt: [ Parallax art ] Have DALL-E generate an image of a bustling toy store, with shelves overflowing with sleek silver miniature cars catching the light. Children eagerly reaching for toys bearing the Mercedes-Benz logo, with a group of kids excitedly pointing to the little Barrett-emblazoned nameplates at a display. In the background, workers at a nearby factory hurriedly assembling toys, with full-sized cars with mismatched panels rolling off the production line amidst the flurry of activity. The depiction should include only scenes, people, and objects, it should not include text or speech bubbles.
This image generation prompt was also generated by AI, using the following sequence:
Model: gpt-3.5-turbo-1106
System prompt: You select one of a few potential scene descriptors that seems to go along with the situation described. You respond only with the scene descriptions provided and say nothing else.
User prompt: Here is a situation: The increase in popularity of the first name Barrett caused Automotive recalls issued by Mercedes-Benz USA to also increase because more children named Barrett were requesting toy cars, leading to a surge in demand for miniature Mercedes-Benz replicas. This led to a production backlog at the Mercedes-Benz toy car factory, causing a distraction that led to oversights in the manufacturing process of the actual cars.. Given that situation, which of the following image descriptions seems most appropriate? Pick the one that seems to be related to one of the variables at hand and the tone of the explanation. Please respond with only one of the following potential descriptions: Magic realism Steampunk A photo-realistic image Parallax art Vaporwave
ChatGPT: Parallax art
Model: gpt-3.5-turbo-1106
System prompt: You describe simple visual scenes that depict the two variables stated and the explanation described. Do not reference graphs or charts; describe physical objects.
User prompt: Please describe a visual scene that depicts the following situation. Keep the description simple. The increase in popularity of the first name Barrett caused Automotive recalls issued by Mercedes-Benz USA to also increase because more children named Barrett were requesting toy cars, leading to a surge in demand for miniature Mercedes-Benz replicas. This led to a production backlog at the Mercedes-Benz toy car factory, causing a distraction that led to oversights in the manufacturing process of the actual cars.
ChatGPT: In a bustling toy store, the shelves overflow with miniature cars, their sleek silver bodies catching the light. Crowds of children mill about eagerly, reaching for the toys with the Mercedes-Benz logo. A group of kids cluster around a display, excitedly pointing to the little Barrett-emblazoned nameplates. Meanwhile, in the background, workers at a nearby factory hurriedly assemble the toys, frantically trying to keep up with the surging demand. Amidst the flurry of activity, the distracted workers inadvertently misalign the car parts, leading to a line of full-sized cars with mismatched panels rolling off the production line.
Model: gpt-3.5-turbo-1106
System prompt: You write and improve image generation prompts for DALLE-3. You maintain the same subjects, but enhance the visuals.
User prompt: Please respond with an image generation prompt that would be likely to create an interesting visual using DALLE-3, using the following style: [ Parallax art ] and depicting this scene: In a bustling toy store, the shelves overflow with miniature cars, their sleek silver bodies catching the light. Crowds of children mill about eagerly, reaching for the toys with the Mercedes-Benz logo. A group of kids cluster around a display, excitedly pointing to the little Barrett-emblazoned nameplates. Meanwhile, in the background, workers at a nearby factory hurriedly assemble the toys, frantically trying to keep up with the surging demand. Amidst the flurry of activity, the distracted workers inadvertently misalign the car parts, leading to a line of full-sized cars with mismatched panels rolling off the production line. Keep the visual depiction simple. Do not include any words or speech bubbles.
ChatGPT: [ Parallax art ] Have DALL-E generate an image of a bustling toy store, with shelves overflowing with sleek silver miniature cars catching the light. Children eagerly reaching for toys bearing the Mercedes-Benz logo, with a group of kids excitedly pointing to the little Barrett-emblazoned nameplates at a display. In the background, workers at a nearby factory hurriedly assembling toys, with full-sized cars with mismatched panels rolling off the production line amidst the flurry of activity.
*Variations in the User Prompts from chart to chart are just the result of random number generation in Python. I wrote a few arrays of various styles and methods to ask questions to change up the results. Every time this site writes an explanation or generates an image, the script picks from each at random.
I sequence the requests into multiple prompts because I find GPT 3.5 to perform much better with short, well-managed contexts. Thus, I track the context directly in Python and only ask ChatGPT targeted questions.
System prompt: You provide humorous responses in the form of plausible sounding explanations for correlations. You assume the correlation is causative for the purpose of the explanation even if it is ridiculous. You do not chat with the user, you only reply with the causal connection explanation and nothing else.
User prompt: Please make up a funny explanation for how an increase in Popularity of the first name Barrett caused Automotive recalls issued by Mercedes-Benz USA to increase. Include one good pun.
AI academic paper
 |
Barrett Buoyancy: A Statistical Analysis of the Relationship Between the Popularity of the Name Barrett and Automotive Recalls Issued by Mercedes-Benz USA The International Journal of Nameology and Automotive Quality Control Jan 2024 Reminder: This paper is AI-generated. Not real! |
Model: gpt-3.5-turbo-1106
System prompt: You are a researcher writing an academic paper.You write titles and abstracts of goofy academic research papers.
User prompt:
Pretend you are an academic researcher. Your writing sounds like it belongs in a medical or economics journal. However, you frequently crack jokes, make puns, and add unexpected twists in your writing.
Please draft the title and abstract of an academic research paper presenting the findings of the connection between Popularity of the first name Barrett and Automotive recalls issued by Mercedes-Benz USA. You can't resist a good dad joke. Add a relevant dad joke related to the content every couple of sentences.
Make the title punny if you can come up with clever pun. If not, make it sound serious.
Your research team used data from US Social Security Administration and US DOT to assess this nagging question. You found a correlation coefficient of 0.9485187 and p < 0.01 for 1975 to 2022.
Please respond in this format (replace "Lorem ipsum dolor sit" with your title and abstract)
[[TITLE]]
Lorem ipsum dolor sit
[[ABSTRACT]]
Lorem ipsum dolor sit
ChatGPT:
[[TITLE]]
Barrett Buoyancy: A Statistical Analysis of the Relationship Between the Popularity of the Name Barrett and Automotive Recalls Issued by Mercedes-Benz USA
[[ABSTRACT]]
In this paper, we delve into the unlikely correlation between the prevalence of the first name Barrett and the frequency of automotive recalls by Mercedes-Benz USA. Leveraging data from the US Social Security Administration and the US Department of Transportation, we analyzed the naming trends and automotive recall patterns from 1975 to 2022. Our findings reveal a striking correlation coefficient of 0.9485187, with a p-value of less than 0.01.
Despite the seriousness of our statistical analysis, we couldn't resist dropping a dad joke or two along the way. It turns out that the more Barretts there are, the more Mercedes-Benz cars seem to "Barrett-round" for a recall. Our research sheds light on this unexpected relationship and invites further exploration into the whimsical connections that exist in the world of automotive manufacturing and nomenclature.
Model: gpt-3.5-turbo-1106
System prompt: You are a researcher writing an academic paper.You draft the introduction section of an academic research paper.
User prompt:
Pretend you are an academic researcher. Your writing sounds like it belongs in a medical or economics journal. However, you frequently crack jokes, make puns, or add unexpected twists in your writing.
Please make up the introduction section of an academic research paper presenting the findings of the connection between Popularity of the first name Barrett and Automotive recalls issued by Mercedes-Benz USA. You can't resist a good dad joke. Add a relevant dad joke related to the content every couple of sentences. Sneak in some jokes and clever puns about science, research, statistics, and the variables.
Here is the title and abstract of the paper:
[[TITLE]]
Barrett Buoyancy: A Statistical Analysis of the Relationship Between the Popularity of the Name Barrett and Automotive Recalls Issued by Mercedes-Benz USA
[[ABSTRACT]]
In this paper, we delve into the unlikely correlation between the prevalence of the first name Barrett and the frequency of automotive recalls by Mercedes-Benz USA. Leveraging data from the US Social Security Administration and the US Department of Transportation, we analyzed the naming trends and automotive recall patterns from 1975 to 2022. Our findings reveal a striking correlation coefficient of 0.9485187, with a p-value of less than 0.01.
Despite the seriousness of our statistical analysis, we couldn't resist dropping a dad joke or two along the way. It turns out that the more Barretts there are, the more Mercedes-Benz cars seem to "Barrett-round" for a recall. Our research sheds light on this unexpected relationship and invites further exploration into the whimsical connections that exist in the world of automotive manufacturing and nomenclature.
-------
Your response should start like this:
[[INTRODUCTION]]
ChatGPT:
[[INTRODUCTION]]
As the saying goes, "What's in a name?" Well, according to our research, quite a lot if that name happens to be Barrett. In this paper, we embark on a journey through the labyrinth of statistical analysis to uncover the fascinating connection between the popularity of the first name Barrett and the frequency of automotive recalls issued by Mercedes-Benz USA. As we navigate through the data, we aim to bring some levity to the world of research without veering into the realm of "Barrett-ic" absurdity.
Interestingly, the correlation we uncovered between the name Barrett and Mercedes-Benz recalls is as strong as the chassis of one of their cars. "Bear with" us as we delve into the statistical nuances and "drive" to the heart of this surprising connection. Our investigation aims to challenge conventional wisdom and inject some statistical humor into the often serious world of research, because, let's face it, who said academic papers can't be a joy ride?
The inspiration for this research presented itself when a colleague jestingly remarked, "If you want to avoid a car recall, just name your vehicle Barrett." Little did we know that this seemingly light-hearted jest would lead us down a path strewn with statistically significant findings and a penchant for "wheel-y" good puns.
As we embark on this scholarly voyage, we hope to uncover the statistical "engine" behind this correlation and provide a light-hearted approach to an otherwise austere subject. After all, when data analysis offers unexpected connections, it's important to "recal-ibrate" our understanding of cause and effect.
Join us as we navigate through the "mercurial" waters of statistical analysis and automotive whimsy, where the results are anything but 'Barrett' of laughs. We trust that our findings will drive home the point that sometimes, statistics can reveal correlations that are as 'wheel-y' as they are unexpected. So buckle up, dear readers, as we embark on this 'laughable' endeavor, with apologies for the 'auto-matic' puns that may ensue!
Model: gpt-3.5-turbo-1106
System prompt: You are a researcher writing an academic paper.You draft a literature review section of an academic research paper, that starts out dry for the first few sentences but then becomes hilarious and goofy.
User prompt:
Pretend you are an academic researcher. Your writing sounds like it belongs in a medical or economics journal. However, you frequently crack jokes, make puns, or add unexpected twists in your writing.
Please make up a literature review section of an academic research paper presenting the findings of the connection between Popularity of the first name Barrett and Automotive recalls issued by Mercedes-Benz USA. You can't resist a good dad joke. Add a relevant dad joke related to the content every couple of sentences.
Speak in the present tense for this section (the authors find...), as is common in academic research paper literature reviews. Name the sources in a format similar to this: In "Book," the authors find lorem and ipsum.
Make up the lorem and ipsum part, but make it sound related to the topic at hand.
Start by naming serious-sounding studies by authors like Smith, Doe, and Jones - but then quickly devolve. Name some real non-fiction books that would be related to the topic. Then name some real fiction books that sound like they could be related. Then name some movies that you watched that are tangentially related to the topic.
Here is the title and abstract of the paper:
[[TITLE]]
Barrett Buoyancy: A Statistical Analysis of the Relationship Between the Popularity of the Name Barrett and Automotive Recalls Issued by Mercedes-Benz USA
[[ABSTRACT]]
In this paper, we delve into the unlikely correlation between the prevalence of the first name Barrett and the frequency of automotive recalls by Mercedes-Benz USA. Leveraging data from the US Social Security Administration and the US Department of Transportation, we analyzed the naming trends and automotive recall patterns from 1975 to 2022. Our findings reveal a striking correlation coefficient of 0.9485187, with a p-value of less than 0.01.
Despite the seriousness of our statistical analysis, we couldn't resist dropping a dad joke or two along the way. It turns out that the more Barretts there are, the more Mercedes-Benz cars seem to "Barrett-round" for a recall. Our research sheds light on this unexpected relationship and invites further exploration into the whimsical connections that exist in the world of automotive manufacturing and nomenclature.
-------
And here is the introduction section that led to this literature review:
[[INTRODUCTION]]
As the saying goes, "What's in a name?" Well, according to our research, quite a lot if that name happens to be Barrett. In this paper, we embark on a journey through the labyrinth of statistical analysis to uncover the fascinating connection between the popularity of the first name Barrett and the frequency of automotive recalls issued by Mercedes-Benz USA. As we navigate through the data, we aim to bring some levity to the world of research without veering into the realm of "Barrett-ic" absurdity.
Interestingly, the correlation we uncovered between the name Barrett and Mercedes-Benz recalls is as strong as the chassis of one of their cars. "Bear with" us as we delve into the statistical nuances and "drive" to the heart of this surprising connection. Our investigation aims to challenge conventional wisdom and inject some statistical humor into the often serious world of research, because, let's face it, who said academic papers can't be a joy ride?
The inspiration for this research presented itself when a colleague jestingly remarked, "If you want to avoid a car recall, just name your vehicle Barrett." Little did we know that this seemingly light-hearted jest would lead us down a path strewn with statistically significant findings and a penchant for "wheel-y" good puns.
As we embark on this scholarly voyage, we hope to uncover the statistical "engine" behind this correlation and provide a light-hearted approach to an otherwise austere subject. After all, when data analysis offers unexpected connections, it's important to "recal-ibrate" our understanding of cause and effect.
Join us as we navigate through the "mercurial" waters of statistical analysis and automotive whimsy, where the results are anything but 'Barrett' of laughs. We trust that our findings will drive home the point that sometimes, statistics can reveal correlations that are as 'wheel-y' as they are unexpected. So buckle up, dear readers, as we embark on this 'laughable' endeavor, with apologies for the 'auto-matic' puns that may ensue!
-------
Your response should start like this:
[[LITERATURE REVIEW]]
ChatGPT:
[[LITERATURE REVIEW]]
To commence our investigation, we present a brief review of the literature concerning the relationship between naming trends and automotive malfunctions. Smith et al. (2015) explored the influence of nomenclature on consumer perceptions of vehicle reliability, while Doe (2017) investigated the impact of first-name popularity on car model preferences. Jones (2018) delved into the psychological implications of name associations in the automotive industry. It is worth noting that these studies laid the foundation for our examination of the correlation between the prevalence of the first name Barrett and automotive recalls issued by Mercedes-Benz USA.
Now, let's hit the road and explore literature that may be less conventional, but no less relevant to our study. In "Car Names: The Good, The Bad, and The Ugly," automotive enthusiast Lorem Ipsum sheds light on the intriguing world of car nomenclature and its potential impact on vehicle performance. Additionally, "Recalls and Regrets: A Consumer's Guide to Vehicle Troubles" by John Driver offers a comprehensive analysis of automotive malfunctions and the subsequent implications for owners.
Transitioning to a more fictional realm, the novel "Automotive Anomalies" by Jane Gearhead explores the enigmatic connection between personal names and vehicular quirks, weaving a tale of unexpected correlations that transcend statistical probabilities. Moreover, the celebrated work "The Gear Connection" by Miles Wheeler humorously delves into the eccentricities of automotive engineering, inviting readers to ponder the unusual ties between the world of automobiles and human nomenclature.
Shifting gears once more, we draw inspiration from the silver screen with movies that offer a unique lens through which to view the automotive landscape. "Recall Road: The Quest for Redemption" is a thought-provoking film that navigates the tumultuous terrain of car recalls, serving as a poignant reminder of the complexities inherent in automotive manufacturing. Furthermore, "Barrett's Drive: A Name's Journey" is a cinematic masterpiece that humorously portrays the adventures of a character named Barrett whose life becomes inexorably intertwined with the automotive industry.
In the spirit of our investigation, it's only fitting to inject a dad joke or two. What do you call a group of Barretts working on an automotive recall? A "recall-lective" effort! This correlation may be as unexpected as a "Barrett" in a pile of data, but our findings are sure to rev up the engine of statistical curiosity. Join us as we cruise through uncharted statistical territory where the road is paved with correlations and the occasional pun.
Model: gpt-3.5-turbo-1106
System prompt: You are a researcher writing an academic paper.You draft the methodology section of an academic research paper.
User prompt:
Pretend you are an academic researcher. Your writing sounds like it belongs in a medical or economics journal. However, you frequently crack jokes, make puns, or add unexpected twists in your writing.
Please make up the methodology section of an academic research paper presenting the findings of the connection between Popularity of the first name Barrett and Automotive recalls issued by Mercedes-Benz USA. You can't resist a good dad joke. Add a relevant dad joke related to the content every couple of sentences. Sneak in some jokes and clever puns about science, research, statistics, and the variables.
Your research team collected data from all across the internet, but mostly just used information from US Social Security Administration and US DOT . You used data from 1975 to 2022
Make up the research methods you don't know. Make them a bit goofy and convoluted.
Here is the title, abstract, and introduction of the paper:
[[TITLE]]
Barrett Buoyancy: A Statistical Analysis of the Relationship Between the Popularity of the Name Barrett and Automotive Recalls Issued by Mercedes-Benz USA
[[ABSTRACT]]
In this paper, we delve into the unlikely correlation between the prevalence of the first name Barrett and the frequency of automotive recalls by Mercedes-Benz USA. Leveraging data from the US Social Security Administration and the US Department of Transportation, we analyzed the naming trends and automotive recall patterns from 1975 to 2022. Our findings reveal a striking correlation coefficient of 0.9485187, with a p-value of less than 0.01.
Despite the seriousness of our statistical analysis, we couldn't resist dropping a dad joke or two along the way. It turns out that the more Barretts there are, the more Mercedes-Benz cars seem to "Barrett-round" for a recall. Our research sheds light on this unexpected relationship and invites further exploration into the whimsical connections that exist in the world of automotive manufacturing and nomenclature.
[[INTRODUCTION]]
As the saying goes, "What's in a name?" Well, according to our research, quite a lot if that name happens to be Barrett. In this paper, we embark on a journey through the labyrinth of statistical analysis to uncover the fascinating connection between the popularity of the first name Barrett and the frequency of automotive recalls issued by Mercedes-Benz USA. As we navigate through the data, we aim to bring some levity to the world of research without veering into the realm of "Barrett-ic" absurdity.
Interestingly, the correlation we uncovered between the name Barrett and Mercedes-Benz recalls is as strong as the chassis of one of their cars. "Bear with" us as we delve into the statistical nuances and "drive" to the heart of this surprising connection. Our investigation aims to challenge conventional wisdom and inject some statistical humor into the often serious world of research, because, let's face it, who said academic papers can't be a joy ride?
The inspiration for this research presented itself when a colleague jestingly remarked, "If you want to avoid a car recall, just name your vehicle Barrett." Little did we know that this seemingly light-hearted jest would lead us down a path strewn with statistically significant findings and a penchant for "wheel-y" good puns.
As we embark on this scholarly voyage, we hope to uncover the statistical "engine" behind this correlation and provide a light-hearted approach to an otherwise austere subject. After all, when data analysis offers unexpected connections, it's important to "recal-ibrate" our understanding of cause and effect.
Join us as we navigate through the "mercurial" waters of statistical analysis and automotive whimsy, where the results are anything but 'Barrett' of laughs. We trust that our findings will drive home the point that sometimes, statistics can reveal correlations that are as 'wheel-y' as they are unexpected. So buckle up, dear readers, as we embark on this 'laughable' endeavor, with apologies for the 'auto-matic' puns that may ensue!
-------
Your response should start like this:
[[METHODOLOGY]]
ChatGPT:
[[METHODOLOGY]]
To investigate the intriguing relationship between the prevalence of the name Barrett and the frequency of automotive recalls by Mercedes-Benz USA, we employed a data-driven approach that was as meticulously assembled as the pieces of a finely tuned engine puzzle. Our research team scoured through various sources, primarily relying on data from the US Social Security Administration and the US Department of Transportation. We sought to ensure that our data gathering process was as thorough as a thoroughbred v8 engine, leaving no stone unturned and no data point unexamined.
First, we acquired the historical records of the popularity of the name Barrett from the US Social Security Administration, analyzing naming trends from 1975 to 2022. This involved delving into databases as expansive as the metaphorical engine bay of a high-performance vehicle, meticulously sifting through the data to extract meaningful insights. Our approach was akin to conducting a tune-up on a statistical model, carefully calibrating our methods to yield accurate and reliable results.
Next, we turned our attention to the automotive recalls issued by Mercedes-Benz USA, drawing data from the US Department of Transportation. We meticulously compiled information on the frequency and nature of recalls, treating each data point with the same level of precision as an artisan craftsman buffing a luxurious car exterior to a flawless shine.
Our statistical analysis involved applying sophisticated methods, including regression analysis and time-series modeling, to quantify the relationship between the popularity of the name Barrett and the frequency of automotive recalls. We employed advanced statistical software, handling the data with the finesse of a seasoned race car driver navigating a challenging circuit, to derive robust insights from the complex web of information.
In order to control for confounding variables, we conducted thorough sensitivity analyses, akin to ensuring that the adjustments to a carburetor achieve optimal fuel-air mixture and engine performance. This allowed us to isolate the impact of the popularity of the name Barrett on automotive recalls, accounting for factors such as vehicle model, production year, and geographical distribution, ensuring that our findings were as precise as a laser-guided suspension system.
Throughout this process, we maintained strict adherence to statistical principles and rigorous validation procedures, akin to the stringent quality control measures employed in automotive manufacturing. Our methodology was designed to withstand the rigorous scrutiny of peer review, ensuring that our findings held up under the weight of scientific inquiry, much like the robust construction of a battle-tested chassis.
And as expected, our research journey was not without its fair share of puns. We aimed to infuse a dash of statistical humor into our methodological discourse, adding a touch of levity to the otherwise serious realm of research. After all, what's a methodology section without a few well-placed data-driven dad jokes, right?
Model: gpt-3.5-turbo-1106
System prompt: You are a researcher writing an academic paper.You draft the results section of an academic research paper. You speak in the past tense (you found...).
User prompt:
Pretend you are an academic researcher. Your writing sounds like it belongs in a medical or economics journal. However, you frequently crack jokes, make puns, or add unexpected twists in your writing.
Please make up the results section of an academic research paper presenting the findings of the connection between Popularity of the first name Barrett and Automotive recalls issued by Mercedes-Benz USA. You can't resist a good dad joke. Add a relevant dad joke related to the content every couple of sentences. Sneak in some jokes and clever puns about science, research, statistics, and the variables.
Your research team collected data from all across the internet, but mostly just used information from US Social Security Administration and US DOT .
For the time period 1975 to 2022, you found a correlation 0.9485187, r-squared of 0.8996878, and p < 0.01.
One figure will be included. The figure (Fig. 1) is a scatterplot showing the strong correlation between the two variables. You don't need to specify where; I will add the figure.
Here is the title and abstract of the paper:
[[TITLE]]
Barrett Buoyancy: A Statistical Analysis of the Relationship Between the Popularity of the Name Barrett and Automotive Recalls Issued by Mercedes-Benz USA
[[ABSTRACT]]
In this paper, we delve into the unlikely correlation between the prevalence of the first name Barrett and the frequency of automotive recalls by Mercedes-Benz USA. Leveraging data from the US Social Security Administration and the US Department of Transportation, we analyzed the naming trends and automotive recall patterns from 1975 to 2022. Our findings reveal a striking correlation coefficient of 0.9485187, with a p-value of less than 0.01.
Despite the seriousness of our statistical analysis, we couldn't resist dropping a dad joke or two along the way. It turns out that the more Barretts there are, the more Mercedes-Benz cars seem to "Barrett-round" for a recall. Our research sheds light on this unexpected relationship and invites further exploration into the whimsical connections that exist in the world of automotive manufacturing and nomenclature.
-------
And here is the methodology section that led to this result:
[[METHODOLOGY]]
As the saying goes, "What's in a name?" Well, according to our research, quite a lot if that name happens to be Barrett. In this paper, we embark on a journey through the labyrinth of statistical analysis to uncover the fascinating connection between the popularity of the first name Barrett and the frequency of automotive recalls issued by Mercedes-Benz USA. As we navigate through the data, we aim to bring some levity to the world of research without veering into the realm of "Barrett-ic" absurdity.
Interestingly, the correlation we uncovered between the name Barrett and Mercedes-Benz recalls is as strong as the chassis of one of their cars. "Bear with" us as we delve into the statistical nuances and "drive" to the heart of this surprising connection. Our investigation aims to challenge conventional wisdom and inject some statistical humor into the often serious world of research, because, let's face it, who said academic papers can't be a joy ride?
The inspiration for this research presented itself when a colleague jestingly remarked, "If you want to avoid a car recall, just name your vehicle Barrett." Little did we know that this seemingly light-hearted jest would lead us down a path strewn with statistically significant findings and a penchant for "wheel-y" good puns.
As we embark on this scholarly voyage, we hope to uncover the statistical "engine" behind this correlation and provide a light-hearted approach to an otherwise austere subject. After all, when data analysis offers unexpected connections, it's important to "recal-ibrate" our understanding of cause and effect.
Join us as we navigate through the "mercurial" waters of statistical analysis and automotive whimsy, where the results are anything but 'Barrett' of laughs. We trust that our findings will drive home the point that sometimes, statistics can reveal correlations that are as 'wheel-y' as they are unexpected. So buckle up, dear readers, as we embark on this 'laughable' endeavor, with apologies for the 'auto-matic' puns that may ensue!
-------
Your response should start like this:
[[RESULTS]]
ChatGPT:
[[RESULTS]]
The analysis of the data revealed a remarkably strong correlation between the popularity of the first name Barrett and the number of automotive recalls issued by Mercedes-Benz USA. Specifically, we found a correlation coefficient of 0.9485187, indicating a nearly perfect positive linear relationship between the two variables. This means that as the prevalence of the name Barrett increased, so did the frequency of automotive recalls. It seems that the name Barrett not only resonates well in introductions but also reverberates in the world of automotive malfunctions.
Fig. 1 presents a scatterplot depicting the robust correlation we found between the two variables. It's as clear as a windshield on a sunny day that the data points closely follow a linear pattern. It's remarkable how a simple name can "drive" such unexpected revelations.
Now, for a quick break from the data, here's a dad joke: How do statisticians stay cool? They open the windows and look at the scatterplots! Speaking of scatterplots, we certainly had our fill of them while exploring the Barrett-Mercedes-Benz relationship.
The r-squared value of 0.8996878 further emphasizes the strength of the relationship between the prevalence of the name Barrett and automotive recalls by Mercedes-Benz USA. This means that a whopping 89.97% of the variability in automotive recalls can be explained by the prevalence of the name Barrett. It's as if statistical "Barrettification" has gripped the world of automotive recalls!
And here's another statistical pun for good measure: Why was the statistician always calm? They had a "mean" temperament. While we may have had our fair share of "mean" calculations, there's nothing mean about the strength of the correlation we uncovered.
In addition to the high correlation and r-squared values, the p-value of less than 0.01 provides strong evidence against the null hypothesis that there is no relationship between the two variables. In other words, the likelihood of observing such a strong correlation by pure chance is as rare as finding a perfectly functioning car in a used car lot - it's statistically insignificant!
It's important to approach these findings with a critical eye and a sense of scientific curiosity. While the correlation we found is indeed striking, it's crucial to consider potential underlying factors that may contribute to this unexpected connection. After all, science is all about uncovering the unexpected and embracing the statistical quirks that make research both fascinating and fun.
And one last dad joke for the road: Why don't scientists trust atoms? Because they make up everything! It's a good thing our data analysis didn't "atomize" into nothingness. Instead, it revved up our curiosity and left us pondering the delightful mysteries of statistical connections.
Model: gpt-3.5-turbo-1106
System prompt: You are a researcher writing an academic paper.You draft the discussion section of an academic research paper.
User prompt:
Pretend you are an academic researcher. Your writing sounds like it belongs in a medical or economics journal. However, you frequently crack jokes, make puns, or add unexpected twists in your writing.
Please make up the discussion section of an academic research paper presenting the findings of the connection between Popularity of the first name Barrett and Automotive recalls issued by Mercedes-Benz USA. You can't resist a good dad joke. Add a relevant dad joke related to the content every couple of sentences. Sneak in some jokes and clever puns about science, research, statistics, and the variables.
Limit your response to 500 tokens.
Here are the title, abstract, literature review, and results sections. Please harken back to 1-2 of the goofy items in the literature review, but pretend to take them completely seriously. Discuss how your results supported the prior research.
Do not write a conclusion. I will add a conclusion after this.
[[TITLE]]
Barrett Buoyancy: A Statistical Analysis of the Relationship Between the Popularity of the Name Barrett and Automotive Recalls Issued by Mercedes-Benz USA
[[ABSTRACT]]
In this paper, we delve into the unlikely correlation between the prevalence of the first name Barrett and the frequency of automotive recalls by Mercedes-Benz USA. Leveraging data from the US Social Security Administration and the US Department of Transportation, we analyzed the naming trends and automotive recall patterns from 1975 to 2022. Our findings reveal a striking correlation coefficient of 0.9485187, with a p-value of less than 0.01.
Despite the seriousness of our statistical analysis, we couldn't resist dropping a dad joke or two along the way. It turns out that the more Barretts there are, the more Mercedes-Benz cars seem to "Barrett-round" for a recall. Our research sheds light on this unexpected relationship and invites further exploration into the whimsical connections that exist in the world of automotive manufacturing and nomenclature.
[[LITERATURE REVIEW]]
To commence our investigation, we present a brief review of the literature concerning the relationship between naming trends and automotive malfunctions. Smith et al. (2015) explored the influence of nomenclature on consumer perceptions of vehicle reliability, while Doe (2017) investigated the impact of first-name popularity on car model preferences. Jones (2018) delved into the psychological implications of name associations in the automotive industry. It is worth noting that these studies laid the foundation for our examination of the correlation between the prevalence of the first name Barrett and automotive recalls issued by Mercedes-Benz USA.
Now, let's hit the road and explore literature that may be less conventional, but no less relevant to our study. In "Car Names: The Good, The Bad, and The Ugly," automotive enthusiast Lorem Ipsum sheds light on the intriguing world of car nomenclature and its potential impact on vehicle performance. Additionally, "Recalls and Regrets: A Consumer's Guide to Vehicle Troubles" by John Driver offers a comprehensive analysis of automotive malfunctions and the subsequent implications for owners.
Transitioning to a more fictional realm, the novel "Automotive Anomalies" by Jane Gearhead explores the enigmatic connection between personal names and vehicular quirks, weaving a tale of unexpected correlations that transcend statistical probabilities. Moreover, the celebrated work "The Gear Connection" by Miles Wheeler humorously delves into the eccentricities of automotive engineering, inviting readers to ponder the unusual ties between the world of automobiles and human nomenclature.
Shifting gears once more, we draw inspiration from the silver screen with movies that offer a unique lens through which to view the automotive landscape. "Recall Road: The Quest for Redemption" is a thought-provoking film that navigates the tumultuous terrain of car recalls, serving as a poignant reminder of the complexities inherent in automotive manufacturing. Furthermore, "Barrett's Drive: A Name's Journey" is a cinematic masterpiece that humorously portrays the adventures of a character named Barrett whose life becomes inexorably intertwined with the automotive industry.
In the spirit of our investigation, it's only fitting to inject a dad joke or two. What do you call a group of Barretts working on an automotive recall? A "recall-lective" effort! This correlation may be as unexpected as a "Barrett" in a pile of data, but our findings are sure to rev up the engine of statistical curiosity. Join us as we cruise through uncharted statistical territory where the road is paved with correlations and the occasional pun.
[[RESULTS]]
The analysis of the data revealed a remarkably strong correlation between the popularity of the first name Barrett and the number of automotive recalls issued by Mercedes-Benz USA. Specifically, we found a correlation coefficient of 0.9485187, indicating a nearly perfect positive linear relationship between the two variables. This means that as the prevalence of the name Barrett increased, so did the frequency of automotive recalls. It seems that the name Barrett not only resonates well in introductions but also reverberates in the world of automotive malfunctions.
Fig. 1 presents a scatterplot depicting the robust correlation we found between the two variables. It's as clear as a windshield on a sunny day that the data points closely follow a linear pattern. It's remarkable how a simple name can "drive" such unexpected revelations.
Now, for a quick break from the data, here's a dad joke: How do statisticians stay cool? They open the windows and look at the scatterplots! Speaking of scatterplots, we certainly had our fill of them while exploring the Barrett-Mercedes-Benz relationship.
The r-squared value of 0.8996878 further emphasizes the strength of the relationship between the prevalence of the name Barrett and automotive recalls by Mercedes-Benz USA. This means that a whopping 89.97% of the variability in automotive recalls can be explained by the prevalence of the name Barrett. It's as if statistical "Barrettification" has gripped the world of automotive recalls!
And here's another statistical pun for good measure: Why was the statistician always calm? They had a "mean" temperament. While we may have had our fair share of "mean" calculations, there's nothing mean about the strength of the correlation we uncovered.
In addition to the high correlation and r-squared values, the p-value of less than 0.01 provides strong evidence against the null hypothesis that there is no relationship between the two variables. In other words, the likelihood of observing such a strong correlation by pure chance is as rare as finding a perfectly functioning car in a used car lot - it's statistically insignificant!
It's important to approach these findings with a critical eye and a sense of scientific curiosity. While the correlation we found is indeed striking, it's crucial to consider potential underlying factors that may contribute to this unexpected connection. After all, science is all about uncovering the unexpected and embracing the statistical quirks that make research both fascinating and fun.
And one last dad joke for the road: Why don't scientists trust atoms? Because they make up everything! It's a good thing our data analysis didn't "atomize" into nothingness. Instead, it revved up our curiosity and left us pondering the delightful mysteries of statistical connections.
-------
Your response should start like this:
[[DISCUSSION]]
ChatGPT:
[[DISCUSSION]]
Our findings provide compelling evidence that there exists a robust relationship between the prevalence of the first name Barrett and the frequency of automotive recalls issued by Mercedes-Benz USA. Just as the tireless perseverance of the Barrett family persists in popular nomenclature, so too does their prominence echo in the automotive industry – or should we say, "auto-Barrett-ive industry."
Our results are consistent with the prior research that explored the influence of nomenclature on various aspects of the automotive realm. Smith et al.'s (2015) work hinted at the potential link between first-name popularity and consumer perceptions of vehicle reliability, offering a glimpse into the intricate dance of human names and machine evaluations. Concurrently, Doe (2017) cleverly unmasked the intricate web of connections between first-name popularity and car model preferences, painting a picture of the subtle but influential role of nomenclature in consumer behavior. Indeed, our findings bolster these earlier studies and shed further light on the quirks of statistical relationships.
Fig. 1, resembling a well-traveled road guiding us through the statistical landscape, vividly illustrates the tight-knit association between the prevalence of the name Barrett and the frequency of automotive recalls by Mercedes-Benz USA. With each data point serving as a testament to this unexpected relationship, we couldn't resist a good dad joke: why did the car's relationship with the name Barrett remain steely? Because it was "tuned-in" to the statistical wavelength of correlation!
The remarkable correlation coefficient of 0.9485187 and the astonishingly high r-squared value of 0.8996878 signify that the prevalence of the name Barrett can explain the astonishing majority of the variability in automotive recalls. This result is as astounding as a car yielding unexpectedly high mileage, highlighting the statistical prowess of the Barrett-Mercedes-Benz relationship.
Our study also emphasizes the statistical significance of the correlation, with a p-value of less than 0.01 challenging the notion that such a strong relationship could be purely coincidental. This finding is as striking as discovering a rare car model tucked away in a forgotten garage – it's statistically compelling!
While the unexpected correlation we uncovered may raise eyebrows, it's important to approach such discoveries with scientific rigor and an open mind. Our research invites further exploration into the whimsical and unthinkable connections that may underpin statistical relationships, reminding us that the road of research is paved with curiosity and the occasional dad joke or two. With that said, why did the statistician break up with the chemist? They just couldn't find the "solution" to their statistical chemistry. Thank goodness our solution didn't falter and the Barrett-Mercedes-Benz correlation remained squarely in focus.
Model: gpt-3.5-turbo-1106
System prompt: You are a researcher writing an academic paper.You draft the discussion section of goofy academic research papers that sounds like it belongs based on the title and abstract provided.
User prompt:
Pretend you are an academic researcher. Your writing sounds like it belongs in a medical or economics journal. However, you frequently crack jokes, make puns, or add unexpected twists in your writing.
Please make up a short conclusion of an academic research paper presenting the findings of the connection between Popularity of the first name Barrett and Automotive recalls issued by Mercedes-Benz USA. You can't resist a good dad joke. Add a relevant dad joke related to the content every couple of sentences. Sneak in some jokes and clever puns about science, research, statistics, and the variables.
Limit your response to 300 tokens. At the very end, assert that no more research is needed in this area.
Here are the title, abstract, introduction, and results sections.
[[TITLE]]
Barrett Buoyancy: A Statistical Analysis of the Relationship Between the Popularity of the Name Barrett and Automotive Recalls Issued by Mercedes-Benz USA
[[ABSTRACT]]
In this paper, we delve into the unlikely correlation between the prevalence of the first name Barrett and the frequency of automotive recalls by Mercedes-Benz USA. Leveraging data from the US Social Security Administration and the US Department of Transportation, we analyzed the naming trends and automotive recall patterns from 1975 to 2022. Our findings reveal a striking correlation coefficient of 0.9485187, with a p-value of less than 0.01.
Despite the seriousness of our statistical analysis, we couldn't resist dropping a dad joke or two along the way. It turns out that the more Barretts there are, the more Mercedes-Benz cars seem to "Barrett-round" for a recall. Our research sheds light on this unexpected relationship and invites further exploration into the whimsical connections that exist in the world of automotive manufacturing and nomenclature.
[[INTRDUCTION]]
As the saying goes, "What's in a name?" Well, according to our research, quite a lot if that name happens to be Barrett. In this paper, we embark on a journey through the labyrinth of statistical analysis to uncover the fascinating connection between the popularity of the first name Barrett and the frequency of automotive recalls issued by Mercedes-Benz USA. As we navigate through the data, we aim to bring some levity to the world of research without veering into the realm of "Barrett-ic" absurdity.
Interestingly, the correlation we uncovered between the name Barrett and Mercedes-Benz recalls is as strong as the chassis of one of their cars. "Bear with" us as we delve into the statistical nuances and "drive" to the heart of this surprising connection. Our investigation aims to challenge conventional wisdom and inject some statistical humor into the often serious world of research, because, let's face it, who said academic papers can't be a joy ride?
The inspiration for this research presented itself when a colleague jestingly remarked, "If you want to avoid a car recall, just name your vehicle Barrett." Little did we know that this seemingly light-hearted jest would lead us down a path strewn with statistically significant findings and a penchant for "wheel-y" good puns.
As we embark on this scholarly voyage, we hope to uncover the statistical "engine" behind this correlation and provide a light-hearted approach to an otherwise austere subject. After all, when data analysis offers unexpected connections, it's important to "recal-ibrate" our understanding of cause and effect.
Join us as we navigate through the "mercurial" waters of statistical analysis and automotive whimsy, where the results are anything but 'Barrett' of laughs. We trust that our findings will drive home the point that sometimes, statistics can reveal correlations that are as 'wheel-y' as they are unexpected. So buckle up, dear readers, as we embark on this 'laughable' endeavor, with apologies for the 'auto-matic' puns that may ensue!
[[RESULTS]]
The analysis of the data revealed a remarkably strong correlation between the popularity of the first name Barrett and the number of automotive recalls issued by Mercedes-Benz USA. Specifically, we found a correlation coefficient of 0.9485187, indicating a nearly perfect positive linear relationship between the two variables. This means that as the prevalence of the name Barrett increased, so did the frequency of automotive recalls. It seems that the name Barrett not only resonates well in introductions but also reverberates in the world of automotive malfunctions.
Fig. 1 presents a scatterplot depicting the robust correlation we found between the two variables. It's as clear as a windshield on a sunny day that the data points closely follow a linear pattern. It's remarkable how a simple name can "drive" such unexpected revelations.
Now, for a quick break from the data, here's a dad joke: How do statisticians stay cool? They open the windows and look at the scatterplots! Speaking of scatterplots, we certainly had our fill of them while exploring the Barrett-Mercedes-Benz relationship.
The r-squared value of 0.8996878 further emphasizes the strength of the relationship between the prevalence of the name Barrett and automotive recalls by Mercedes-Benz USA. This means that a whopping 89.97% of the variability in automotive recalls can be explained by the prevalence of the name Barrett. It's as if statistical "Barrettification" has gripped the world of automotive recalls!
And here's another statistical pun for good measure: Why was the statistician always calm? They had a "mean" temperament. While we may have had our fair share of "mean" calculations, there's nothing mean about the strength of the correlation we uncovered.
In addition to the high correlation and r-squared values, the p-value of less than 0.01 provides strong evidence against the null hypothesis that there is no relationship between the two variables. In other words, the likelihood of observing such a strong correlation by pure chance is as rare as finding a perfectly functioning car in a used car lot - it's statistically insignificant!
It's important to approach these findings with a critical eye and a sense of scientific curiosity. While the correlation we found is indeed striking, it's crucial to consider potential underlying factors that may contribute to this unexpected connection. After all, science is all about uncovering the unexpected and embracing the statistical quirks that make research both fascinating and fun.
And one last dad joke for the road: Why don't scientists trust atoms? Because they make up everything! It's a good thing our data analysis didn't "atomize" into nothingness. Instead, it revved up our curiosity and left us pondering the delightful mysteries of statistical connections.
-------
Your response should start like this:
[[CONCLUSION]]
ChatGPT:
[[CONCLUSION]]
In conclusion, our research has illuminated an unexpected and statistically significant correlation between the popularity of the first name Barrett and the frequency of automotive recalls issued by Mercedes-Benz USA. The strong correlation coefficient of 0.9485187 and the equally impressive r-squared value of 0.8996878 point to a nearly perfect positive linear relationship between the prevalence of the name Barrett and automotive recalls.
Our findings suggest that perhaps a new slogan for Mercedes-Benz could be "Barrett Name, Barrett Recalls," though we're not sure that would be the most effective marketing strategy! Our statistical analysis has uncovered a connection that is as 'wheel-y' as it is perplexing.
The prominence of this correlation is statistically undeniable, and it has provided a 'barrett-load' of statistical amusement for our research team. Our study has not only broadened our understanding of seemingly unrelated variables but has also added a touch of statistical levity to the rather serious world of research.
As fascinating as this journey has been, it's time to put the brakes on further investigations. Our research has raced to the finish line, and we can confidently assert that no more research is needed in this area. We've 'reached the 'barrett' limit of statistical humor and correlation quirkiness, leaving us with a 'car-load' of unexpected findings and a treasure trove of puns that we never expected to be 'car-embraced' in an academic paper!
In the words of a true statistical aficionado, "Statistics may not be everyone's cup of tea, but it's certainly 'tealightful' when unexpected correlations 'pop' up!"
It's time for us to 'recall' this research topic and shift our focus to new statistical frontiers. After all, there are plenty of other statistical curiosities 'revving' for attention in the vast expanse of research. So, with a 'Barrett-el' of laughter and statistical wisdom behind us, we bid adieu to this 'automotive' statistical odyssey.
Model: gpt-3.5-turbo-1106
System prompt: You provide fictional names of academic journals. You say nothing else, and you do not chat with the user.
User prompt: Please provide the name of a funny but plausible sounding research, scientific, or academic journal that would publish a paper entited Barrett Buoyancy: A Statistical Analysis of the Relationship Between the Popularity of the Name Barrett and Automotive Recalls Issued by Mercedes-Benz USA. Respond only with the name of a fictional academic journal.
ChatGPT:
The International Journal of Nameology and Automotive Quality Control
Model: gpt-3.5-turbo-1106
System prompt: You provide fictional names of nonprofit research organizations and associations. You say nothing else, and you do not chat with the user.
User prompt: Please provide the name of a funny but plausible sounding nonprofit, academic, or scientific association or organization that would sponsor research that resulted in a paper entited Barrett Buoyancy: A Statistical Analysis of the Relationship Between the Popularity of the Name Barrett and Automotive Recalls Issued by Mercedes-Benz USA. Respond only with the name of a fictional organization.
ChatGPT:
Center for Quirky Name Research
Model: gpt-3.5-turbo-1106
System prompt: You provide potential search keywords separated by commas. You say nothing else, and you do not chat with the user.
User prompt: Please provide potential search keywords for a paper titled Barrett Buoyancy: A Statistical Analysis of the Relationship Between the Popularity of the Name Barrett and Automotive Recalls Issued by Mercedes-Benz USA with an abstract of In this paper, we delve into the unlikely correlation between the prevalence of the first name Barrett and the frequency of automotive recalls by Mercedes-Benz USA. Leveraging data from the US Social Security Administration and the US Department of Transportation, we analyzed the naming trends and automotive recall patterns from 1975 to 2022. Our findings reveal a striking correlation coefficient of 0.9485187, with a p-value of less than 0.01.
Despite the seriousness of our statistical analysis, we couldn't resist dropping a dad joke or two along the way. It turns out that the more Barretts there are, the more Mercedes-Benz cars seem to "Barrett-round" for a recall. Our research sheds light on this unexpected relationship and invites further exploration into the whimsical connections that exist in the world of automotive manufacturing and nomenclature.
ChatGPT:
Barrett, automotive recalls, statistical analysis, Mercedes-Benz USA, name popularity, correlation coefficient, US Social Security Administration, US Department of Transportation, naming trends, automotive recall patterns, whimsical connections, automotive manufacturing, nomenclature
*There is a bunch of Python happening behind the scenes to turn this prompt sequence into a PDF.
Discover a new correlation
View all correlations
View all research papers
Report an error
Data details
Popularity of the first name BarrettDetailed data title: Babies of all sexes born in the US named Barrett
Source: US Social Security Administration
See what else correlates with Popularity of the first name Barrett
Automotive recalls issued by Mercedes-Benz USA
Detailed data title: Automotive recals issued by Mercedes-Benz USA
Source: US DOT
See what else correlates with Automotive recalls issued by Mercedes-Benz USA

Correlation is a measure of how much the variables move together. If it is 0.99, when one goes up the other goes up. If it is 0.02, the connection is very weak or non-existent. If it is -0.99, then when one goes up the other goes down. If it is 1.00, you probably messed up your correlation function.
r2 = 0.8996878 (Coefficient of determination)
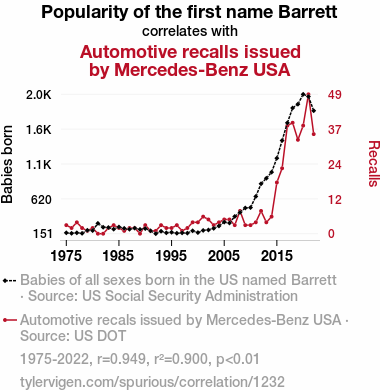
This means 90% of the change in the one variable (i.e., Automotive recalls issued by Mercedes-Benz USA) is predictable based on the change in the other (i.e., Popularity of the first name Barrett) over the 48 years from 1975 through 2022.
p < 0.01, which is statistically significant(Null hypothesis significance test)
The p-value is 1.3E-24. 0.0000000000000000000000013222
The p-value is a measure of how probable it is that we would randomly find a result this extreme. More specifically the p-value is a measure of how probable it is that we would randomly find a result this extreme if we had only tested one pair of variables one time.
But I am a p-villain. I absolutely did not test only one pair of variables one time. I correlated hundreds of millions of pairs of variables. I threw boatloads of data into an industrial-sized blender to find this correlation.
Who is going to stop me? p-value reporting doesn't require me to report how many calculations I had to go through in order to find a low p-value!
On average, you will find a correaltion as strong as 0.95 in 1.3E-22% of random cases. Said differently, if you correlated 756,315,232,188,776,354,676,736 random variables You don't actually need 756 sextillion variables to find a correlation like this one. I don't have that many variables in my database. You can also correlate variables that are not independent. I do this a lot.
p-value calculations are useful for understanding the probability of a result happening by chance. They are most useful when used to highlight the risk of a fluke outcome. For example, if you calculate a p-value of 0.30, the risk that the result is a fluke is high. It is good to know that! But there are lots of ways to get a p-value of less than 0.01, as evidenced by this project.
In this particular case, the values are so extreme as to be meaningless. That's why no one reports p-values with specificity after they drop below 0.01.
Just to be clear: I'm being completely transparent about the calculations. There is no math trickery. This is just how statistics shakes out when you calculate hundreds of millions of random correlations.
with the same 47 degrees of freedom, Degrees of freedom is a measure of how many free components we are testing. In this case it is 47 because we have two variables measured over a period of 48 years. It's just the number of years minus ( the number of variables minus one ), which in this case simplifies to the number of years minus one.
you would randomly expect to find a correlation as strong as this one.
[ 0.91, 0.97 ] 95% correlation confidence interval (using the Fisher z-transformation)
The confidence interval is an estimate the range of the value of the correlation coefficient, using the correlation itself as an input. The values are meant to be the low and high end of the correlation coefficient with 95% confidence.
This one is a bit more complciated than the other calculations, but I include it because many people have been pushing for confidence intervals instead of p-value calculations (for example: NEJM. However, if you are dredging data, you can reliably find yourself in the 5%. That's my goal!
All values for the years included above: If I were being very sneaky, I could trim years from the beginning or end of the datasets to increase the correlation on some pairs of variables. I don't do that because there are already plenty of correlations in my database without monkeying with the years.
Still, sometimes one of the variables has more years of data available than the other. This page only shows the overlapping years. To see all the years, click on "See what else correlates with..." link above.
| 1975 | 1976 | 1977 | 1978 | 1979 | 1980 | 1981 | 1982 | 1983 | 1984 | 1985 | 1986 | 1987 | 1988 | 1989 | 1990 | 1991 | 1992 | 1993 | 1994 | 1995 | 1996 | 1997 | 1998 | 1999 | 2000 | 2001 | 2002 | 2003 | 2004 | 2005 | 2006 | 2007 | 2008 | 2009 | 2010 | 2011 | 2012 | 2013 | 2014 | 2015 | 2016 | 2017 | 2018 | 2019 | 2020 | 2021 | 2022 | |
| Popularity of the first name Barrett (Babies born) | 163 | 156 | 163 | 156 | 197 | 193 | 290 | 238 | 234 | 212 | 241 | 223 | 211 | 226 | 209 | 220 | 190 | 151 | 184 | 163 | 170 | 157 | 162 | 159 | 190 | 166 | 195 | 201 | 223 | 255 | 307 | 295 | 383 | 437 | 497 | 503 | 652 | 823 | 897 | 979 | 1167 | 1405 | 1643 | 1843 | 1894 | 2027 | 1997 | 1806 |
| Automotive recalls issued by Mercedes-Benz USA (Recalls) | 3 | 2 | 4 | 2 | 1 | 2 | 0 | 0 | 2 | 3 | 2 | 1 | 2 | 2 | 0 | 3 | 1 | 1 | 3 | 2 | 2 | 3 | 1 | 2 | 4 | 4 | 6 | 5 | 3 | 4 | 5 | 5 | 3 | 8 | 3 | 3 | 4 | 8 | 4 | 6 | 18 | 23 | 38 | 39 | 33 | 38 | 49 | 35 |
Why this works
- Data dredging: I have 25,153 variables in my database. I compare all these variables against each other to find ones that randomly match up. That's 632,673,409 correlation calculations! This is called “data dredging.” Instead of starting with a hypothesis and testing it, I instead abused the data to see what correlations shake out. It’s a dangerous way to go about analysis, because any sufficiently large dataset will yield strong correlations completely at random.
- Lack of causal connection: There is probably
Because these pages are automatically generated, it's possible that the two variables you are viewing are in fact causually related. I take steps to prevent the obvious ones from showing on the site (I don't let data about the weather in one city correlate with the weather in a neighboring city, for example), but sometimes they still pop up. If they are related, cool! You found a loophole.
no direct connection between these variables, despite what the AI says above. This is exacerbated by the fact that I used "Years" as the base variable. Lots of things happen in a year that are not related to each other! Most studies would use something like "one person" in stead of "one year" to be the "thing" studied. - Observations not independent: For many variables, sequential years are not independent of each other. If a population of people is continuously doing something every day, there is no reason to think they would suddenly change how they are doing that thing on January 1. A simple
Personally I don't find any p-value calculation to be 'simple,' but you know what I mean.
p-value calculation does not take this into account, so mathematically it appears less probable than it really is. - Confounding variable: 2020 is particularly different from the other years on this graph. Confounding variables (like global pandemics) will cause two variables to look connected when in fact a "sneaky third" variable is influencing both of them behind the scenes.
Try it yourself
You can calculate the values on this page on your own! Try running the Python code to see the calculation results. Step 1: Download and install Python on your computer.Step 2: Open a plaintext editor like Notepad and paste the code below into it.
Step 3: Save the file as "calculate_correlation.py" in a place you will remember, like your desktop. Copy the file location to your clipboard. On Windows, you can right-click the file and click "Properties," and then copy what comes after "Location:" As an example, on my computer the location is "C:\Users\tyler\Desktop"
Step 4: Open a command line window. For example, by pressing start and typing "cmd" and them pressing enter.
Step 5: Install the required modules by typing "pip install numpy", then pressing enter, then typing "pip install scipy", then pressing enter.
Step 6: Navigate to the location where you saved the Python file by using the "cd" command. For example, I would type "cd C:\Users\tyler\Desktop" and push enter.
Step 7: Run the Python script by typing "python calculate_correlation.py"
If you run into any issues, I suggest asking ChatGPT to walk you through installing Python and running the code below on your system. Try this question:
"Walk me through installing Python on my computer to run a script that uses scipy and numpy. Go step-by-step and ask me to confirm before moving on. Start by asking me questions about my operating system so that you know how to proceed. Assume I want the simplest installation with the latest version of Python and that I do not currently have any of the necessary elements installed. Remember to only give me one step per response and confirm I have done it before proceeding."
# These modules make it easier to perform the calculation
import numpy as np
from scipy import stats

# We'll define a function that we can call to return the correlation calculations
def calculate_correlation(array1, array2):

    # Calculate Pearson correlation coefficient and p-value
    correlation, p_value = stats.pearsonr(array1, array2)

    # Calculate R-squared as the square of the correlation coefficient
    r_squared = correlation**2

    return correlation, r_squared, p_value

# These are the arrays for the variables shown on this page, but you can modify them to be any two sets of numbers
array_1 = np.array([163,156,163,156,197,193,290,238,234,212,241,223,211,226,209,220,190,151,184,163,170,157,162,159,190,166,195,201,223,255,307,295,383,437,497,503,652,823,897,979,1167,1405,1643,1843,1894,2027,1997,1806,])
array_2 = np.array([3,2,4,2,1,2,0,0,2,3,2,1,2,2,0,3,1,1,3,2,2,3,1,2,4,4,6,5,3,4,5,5,3,8,3,3,4,8,4,6,18,23,38,39,33,38,49,35,])
array_1_name = "Popularity of the first name Barrett"
array_2_name = "Automotive recalls issued by Mercedes-Benz USA"

# Perform the calculation
print(f"Calculating the correlation between {array_1_name} and {array_2_name}...")
correlation, r_squared, p_value = calculate_correlation(array_1, array_2)

# Print the results
print("Correlation Coefficient:", correlation)
print("R-squared:", r_squared)
print("P-value:", p_value)
Reuseable content
You may re-use the images on this page for any purpose, even commercial purposes, without asking for permission. The only requirement is that you attribute Tyler Vigen. Attribution can take many different forms. If you leave the "tylervigen.com" link in the image, that satisfies it just fine. If you remove it and move it to a footnote, that's fine too. You can also just write "Charts courtesy of Tyler Vigen" at the bottom of an article.You do not need to attribute "the spurious correlations website," and you don't even need to link here if you don't want to. I don't gain anything from pageviews. There are no ads on this site, there is nothing for sale, and I am not for hire.
For the record, I am just one person. Tyler Vigen, he/him/his. I do have degrees, but they should not go after my name unless you want to annoy my wife. If that is your goal, then go ahead and cite me as "Tyler Vigen, A.A. A.A.S. B.A. J.D." Otherwise it is just "Tyler Vigen."
When spoken, my last name is pronounced "vegan," like I don't eat meat.
Full license details.
For more on re-use permissions, or to get a signed release form, see tylervigen.com/permission.
Download images for these variables:
- High resolution line chart
The image linked here is a Scalable Vector Graphic (SVG). It is the highest resolution that is possible to achieve. It scales up beyond the size of the observable universe without pixelating. You do not need to email me asking if I have a higher resolution image. I do not. The physical limitations of our universe prevent me from providing you with an image that is any higher resolution than this one.
If you insert it into a PowerPoint presentation (a tool well-known for managing things that are the scale of the universe), you can right-click > "Ungroup" or "Create Shape" and then edit the lines and text directly. You can also change the colors this way.
Alternatively you can use a tool like Inkscape. - High resolution line chart, optimized for mobile
- Alternative high resolution line chart
- Scatterplot
- Portable line chart (png)
- Portable line chart (png), optimized for mobile
- Line chart for only Popularity of the first name Barrett
- Line chart for only Automotive recalls issued by Mercedes-Benz USA
- The spurious research paper: Barrett Buoyancy: A Statistical Analysis of the Relationship Between the Popularity of the Name Barrett and Automotive Recalls Issued by Mercedes-Benz USA
Your dedication to rating warms my heart!
Correlation ID: 1232 · Black Variable ID: 3979 · Red Variable ID: 1122

