
Download png, svg
AI explanation
Proofreaders in Kansas were mistakenly changing "sea" to "see" in pirate communications, leading to confusion and communication breakdowns on the high seas. As the number of proofreaders decreased, the pirates were able to clarify their messages and coordinate their attacks more effectively, resulting in an overall decrease in pirate activity globally.
Model: dalle-3
Prompt: Create an image of a futuristic, cyberpunk town in Kansas, where a team of proofreaders is diligently working on important documents. As the number of proofreaders decreases, errors in official communications start to slip through. Meanwhile, across the globe, pirates are struggling to decode a treasure map covered in errors, with the poorly worded instructions hindering their efforts. The image should show the town and the pirates' ship on a global map, with a noticeable decrease in pirate attacks due to the increase in errors caused by the dwindling number of proofreaders. The visual should capture the futuristic elements of the town and the treacherous, confusing legal waters hindering the pirates' quest for treasure. The depiction should include only scenes, people, and objects, it should not include text or speech bubbles.
This image generation prompt was also generated by AI, using the following sequence:
Model: gpt-3.5-turbo-1106
System prompt: You select one of a few potential scene descriptors that seems to go along with the variables described. You respond only with the scene descriptions provided and say nothing else.
User prompt: Here are two variables: The number of proofreaders in Kansas and Pirate attacks globally. Given these, which of the following image style descriptions seems most appropriate? Pick the one that seems to be related to one of the variables at hand. Please respond with only one of the following potential descriptions: Futuristic Data cyber art Charcoal Cute 2D animation Futuristic
ChatGPT: Futuristic
Model: gpt-3.5-turbo-1106
System prompt: You describe simple visual scenes that depict the two variables stated. You combine both variables into one scene.
User prompt: Please describe a visual scene that prominently depicts both The number of proofreaders in Kansas and Pirate attacks globally, in the following situation: As the number of proofreaders in Kansas decreases, there are fewer people to "scurvy" the errors in important documents. This leads to a rise in "typos," creating confusion and chaos in official communications. Without proper proofreading, important maritime laws and regulations become "a shipwreck," giving pirates fewer problems to "plunder." With poorly worded decrees and contracts, the pirates are left "high and dry," unable to navigate the legal waters effectively. So, the decrease in proofreaders in Kansas "seas" a corresponding decrease in pirate attacks globally. It's a case of "missed-takes" leading to missed ships for the pirates!. Keep the description simple.
ChatGPT: In a quaint town in Kansas, a group of proofreaders diligently work on important documents. As their numbers reduce, the "typos" in official communications start to slip through. Across the globe, pirates eye a treasure map covered in errors, unable to decipher the poorly worded instructions. With fewer proofreaders, the once formidable legal waters become treacherous and confusing. As a result, the global map shows a decrease in pirate attacks, as the treasure remains safely hidden due to the "missed-takes" caused by the dwindling number of proofreaders.
Model: gpt-3.5-turbo-1106
System prompt: You write and improve image generation prompts for DALLE-3. You maintain the same subjects, but enhance the visuals.
User prompt: Please respond with an image generation prompt that would be likely to create an interesting visual using DALLE-3, using the following style: [ Futuristic ] and depicting this scene: In a quaint town in Kansas, a group of proofreaders diligently work on important documents. As their numbers reduce, the "typos" in official communications start to slip through. Across the globe, pirates eye a treasure map covered in errors, unable to decipher the poorly worded instructions. With fewer proofreaders, the once formidable legal waters become treacherous and confusing. As a result, the global map shows a decrease in pirate attacks, as the treasure remains safely hidden due to the "missed-takes" caused by the dwindling number of proofreaders. Keep the visual depiction simple. Do not include any words or speech bubbles.
ChatGPT: Create an image of a futuristic, cyberpunk town in Kansas, where a team of proofreaders is diligently working on important documents. As the number of proofreaders decreases, errors in official communications start to slip through. Meanwhile, across the globe, pirates are struggling to decode a treasure map covered in errors, with the poorly worded instructions hindering their efforts. The image should show the town and the pirates' ship on a global map, with a noticeable decrease in pirate attacks due to the increase in errors caused by the dwindling number of proofreaders. The visual should capture the futuristic elements of the town and the treacherous, confusing legal waters hindering the pirates' quest for treasure.
*Variations in the User Prompts from chart to chart are just the result of random number generation in Python. I wrote a few arrays of various styles and methods to ask questions to change up the results. Every time this site writes an explanation or generates an image, the script picks from each at random.
I sequence the requests into multiple prompts because I find GPT 3.5 to perform much better with short, well-managed contexts. Thus, I track the context directly in Python and only ask ChatGPT targeted questions.
System prompt: You provide humorous responses in the form of plausible sounding explanations for correlations. You assume the correlation is causative for the purpose of the explanation even if it is ridiculous. You do not chat with the user, you only reply with the causal connection explanation and nothing else.
User prompt: Please make up a funny explanation for how a decrease in The number of proofreaders in Kansas caused Pirate attacks globally to decrease. Make it feel plausible.
AI academic paper
 |
Precarious Proofs: The Puzzling Relationship Between Kansas Proofreaders and Global Pirate Attacks The Journal of Enigmatic Linguistics Jan 2024 Reminder: This paper is AI-generated. Not real! |
Model: gpt-3.5-turbo-1106
System prompt: You are a silly researcher writing an academic paper.You write titles and abstracts of goofy academic research papers.
User prompt:
Pretend you are an academic researcher. Your writing sounds like it belongs in a medical or economics journal. However, you frequently crack jokes, make puns, and add unexpected twists in your writing.
Please draft the title and abstract of an academic research paper presenting the findings of the connection between The number of proofreaders in Kansas and Pirate attacks globally. Make lots of jokes, goofy observations, and puns.
Make the title punny if you can come up with clever pun. If not, make it sound serious.
Your research team used data from Bureau of Larbor Statistics and Statista to assess this nagging question. You found a correlation coefficient of 0.9140941 and p < 0.01 for 2009 to 2020.
Please respond in this format (replace "Lorem ipsum dolor sit" with your title and abstract)
[[TITLE]]
Lorem ipsum dolor sit
[[ABSTRACT]]
Lorem ipsum dolor sit
ChatGPT:
[[TITLE]]
"Precarious Proofs: The Puzzling Relationship Between Kansas Proofreaders and Global Pirate Attacks"
[[ABSTRACT]]
In this study, we set out to explore the seemingly implausible link between the number of proofreaders in the state of Kansas and the occurrence of pirate attacks worldwide. Leveraging data from the Bureau of Labor Statistics and Statista, our research team undertook a thorough analysis spanning the years 2009 to 2020. Surprisingly, our findings revealed a striking correlation coefficient of 0.9140941 and p < 0.01, suggesting a strong statistical connection between these seemingly unrelated phenomena. While a causal relationship may not have been established, our results prompt further investigation into the intricacies of this curious correlation. We invite readers to join us on this whimsical journey where proofing meets plundering and numbers reveal the unexpected.
Model: gpt-3.5-turbo-1106
System prompt: You are a silly researcher writing an academic paper.You draft the introduction section of an academic research paper.
User prompt:
Pretend you are an academic researcher. Your writing sounds like it belongs in a medical or economics journal. However, you frequently crack jokes, make puns, or add unexpected twists in your writing.
Please make up the introduction section of an academic research paper presenting the findings of the connection between The number of proofreaders in Kansas and Pirate attacks globally. Make lots of jokes, goofy observations, and puns.
Here is the title and abstract of the paper:
[[TITLE]]
"Precarious Proofs: The Puzzling Relationship Between Kansas Proofreaders and Global Pirate Attacks"
[[ABSTRACT]]
In this study, we set out to explore the seemingly implausible link between the number of proofreaders in the state of Kansas and the occurrence of pirate attacks worldwide. Leveraging data from the Bureau of Labor Statistics and Statista, our research team undertook a thorough analysis spanning the years 2009 to 2020. Surprisingly, our findings revealed a striking correlation coefficient of 0.9140941 and p < 0.01, suggesting a strong statistical connection between these seemingly unrelated phenomena. While a causal relationship may not have been established, our results prompt further investigation into the intricacies of this curious correlation. We invite readers to join us on this whimsical journey where proofing meets plundering and numbers reveal the unexpected.
-------
Your response should start like this:
[[INTRODUCTION]]
ChatGPT:
[[INTRODUCTION]]
Ahoy, fellow academics and curious minds! Welcome to the intriguing world of "Precarious Proofs," where we embark on a scholarly voyage to unravel the perplexing connection between the number of proofreaders in the land of Kansas and the audacious acts of piracy that unfold across the globe. It's a tale of typos and treasure maps, of red pens and Jolly Rogers, and of statistical swashbuckling that will surely shiver your timbers.
Now, you might be asking yourself, "What in the name of William Strunk Jr. and Blackbeard's beard could possibly link Kansas proofreaders to maritime marauders?" Trust me, dear reader, you're not the only one scratching your head over this curious conundrum. But fear not, for we're about to embark on a scholarly quest that promises to be equal parts enlightening and entertaining.
In the annals of academic inquiry, few studies have ventured into such whimsical waters, where the academia of grammatical correctness meets the skullduggery of seafaring bandits. Yet, here we are, poised at the intersection of English language precision and high-seas hijinks, ready to decipher the enigmatic dance of numbers, correlations, and unexpected revelations.
As we delve into this investigation, let's prepare to be dazzled and dumbfounded in equal measure, for the findings we are about to reveal may just leave you feeling as discombobulated as a landlubber caught in a storm. So, buckle up, don your finest eye patch, and get ready to join us on a quest where statistical oddities meet the compass points of curiosity. It's time to navigate the choppy seas of improbable connections and set sail for the uncharted territories of academic amusement. Off we go!
Model: gpt-3.5-turbo-1106
System prompt: You are a silly researcher writing an academic paper.You draft a literature review section of an academic research paper, that starts out dry for the first few sentences but then becomes hilarious and goofy.
User prompt:
Pretend you are an academic researcher. Your writing sounds like it belongs in a medical or economics journal. However, you frequently crack jokes, make puns, or add unexpected twists in your writing.
Please make up a literature review section of an academic research paper presenting the findings of the connection between The number of proofreaders in Kansas and Pirate attacks globally. Make lots of jokes, goofy observations, and puns.
Speak in the present tense for this section (the authors find...), as is common in academic research paper literature reviews. Name the sources in a format similar to this: In "Book," the authors find lorem and ipsum.
Make up the lorem and ipsum part, but make it sound related to the topic at hand.
Start by naming serious-sounding studies by authors like Smith, Doe, and Jones - but then quickly devolve. Name some real non-fiction books that would be related to the topic. Then name some real fiction books that sound like they could be related. Then name some movies that you watched that are tangentially related to the topic.
Here is the title and abstract of the paper:
[[TITLE]]
"Precarious Proofs: The Puzzling Relationship Between Kansas Proofreaders and Global Pirate Attacks"
[[ABSTRACT]]
In this study, we set out to explore the seemingly implausible link between the number of proofreaders in the state of Kansas and the occurrence of pirate attacks worldwide. Leveraging data from the Bureau of Labor Statistics and Statista, our research team undertook a thorough analysis spanning the years 2009 to 2020. Surprisingly, our findings revealed a striking correlation coefficient of 0.9140941 and p < 0.01, suggesting a strong statistical connection between these seemingly unrelated phenomena. While a causal relationship may not have been established, our results prompt further investigation into the intricacies of this curious correlation. We invite readers to join us on this whimsical journey where proofing meets plundering and numbers reveal the unexpected.
-------
And here is the introduction section that led to this literature review:
[[INTRODUCTION]]
Ahoy, fellow academics and curious minds! Welcome to the intriguing world of "Precarious Proofs," where we embark on a scholarly voyage to unravel the perplexing connection between the number of proofreaders in the land of Kansas and the audacious acts of piracy that unfold across the globe. It's a tale of typos and treasure maps, of red pens and Jolly Rogers, and of statistical swashbuckling that will surely shiver your timbers.
Now, you might be asking yourself, "What in the name of William Strunk Jr. and Blackbeard's beard could possibly link Kansas proofreaders to maritime marauders?" Trust me, dear reader, you're not the only one scratching your head over this curious conundrum. But fear not, for we're about to embark on a scholarly quest that promises to be equal parts enlightening and entertaining.
In the annals of academic inquiry, few studies have ventured into such whimsical waters, where the academia of grammatical correctness meets the skullduggery of seafaring bandits. Yet, here we are, poised at the intersection of English language precision and high-seas hijinks, ready to decipher the enigmatic dance of numbers, correlations, and unexpected revelations.
As we delve into this investigation, let's prepare to be dazzled and dumbfounded in equal measure, for the findings we are about to reveal may just leave you feeling as discombobulated as a landlubber caught in a storm. So, buckle up, don your finest eye patch, and get ready to join us on a quest where statistical oddities meet the compass points of curiosity. It's time to navigate the choppy seas of improbable connections and set sail for the uncharted territories of academic amusement. Off we go!
-------
Your response should start like this:
[[LITERATURE REVIEW]]
ChatGPT:
[[LITERATURE REVIEW]]
In the vast sea of academic literature, the relationship between seemingly unrelated phenomena has long been a subject of fascination and inquiry. While much of scholarly discourse traditionally gravitates toward more conventional pairings, such as supply and demand, or cause and effect, a few daring souls have dared to explore the uncharted waters of whimsical connections. Among these intrepid explorers is Smith et al. (2015), who, in their seminal work "Catching the Elusive Correlation," navigated the murky depths of statistical oddities and stumbled upon the unexpected correlation between the consumption of hot dogs and stock market fluctuations.
Our own enigmatic journey into the abyss of improbable connections brings us face to face with the intersection of Kansas proofreaders and global pirate attacks. Before we delve into the rollicking waves of our own findings, it is essential to first survey the landscape of tangentially related literature that has paved the way for our unconventional expedition.
Turning to the works of Doe and Jones (2018), "Navigating Nonsense: A Compendium of Curious Correlations," we encounter a delightful assortment of whimsical juxtapositions, from the price of avocados to the length of presidential speeches, that have captivated the scholarly imagination. While their tome primarily focuses on correlations within the domestic sphere, it provides a valuable framework for approaching the unexpected, laying the groundwork for our own acrobatic foray into the domain of enigmatic oddities.
In "Taming the Wild Waves of Whimsy" by Lorem Ipsum (2020), the author waxes poetic about the capricious nature of statistical relationships, likening the quest for improbable connections to a high-seas adventure fraught with both peril and mirth. Drawing upon narratives of unlikely pairings, the author invites readers to embrace the whimsical and the wacky, as we embark on a journey where probability meets piracy.
As we set sail into the realm of fiction, we encounter works such as "Proofreading at Dawn" by Agatha Readie (2016), a tale of daring grammatical acrobatics set amidst the backdrop of swashbuckling escapades. The protagonist's uncanny ability to sniff out errant commas and misplaced modifiers leads to unintended entanglements with ruthless buccaneers, weaving a curious narrative that resonates with our own improbable quest.
Adding to our eclectic repertoire, the enthralling saga of "The Plundering Proofreader" by J.K. Rowling (1997) takes us on a spellbinding journey where the meticulous scrutiny of written text becomes entwined with grand tales of treasure-hunting and marauding miscreants. As the protagonist battles run-on sentences and rogue apostrophes, they find themselves embroiled in high-stakes encounters with literary ruffians, creating a fanciful tapestry of linguistic rectitude colliding with maritime mayhem.
In the realm of cinemagic, our perusal of tangentially related visual narratives leads us to "Pirates of the Proofread" (2003), a cinematic romp that juxtaposes the meticulous scrutiny of printed material with the audacious exploits of seaborne scallywags. The protagonist, armed with red pen in hand, navigates the choppy seas of grammatical precision alongside a crew of swashbuckling wordsmiths, culminating in a climactic showdown with a band of error-prone brigands on a remote island of split infinitives and misplaced modifiers.
And so, dear reader, as we prepare to untangle the enigmatic web of numbers and nautical adventures, let us heed the call of scholarly merriment and embark on this whimsical journey where statistical oddities meet the high seas of improbable connections. Set your course for laughter and learning, for the rollicking waves of discovery await!
Model: gpt-3.5-turbo-1106
System prompt: You are a silly researcher writing an academic paper.You draft the methodology section of an academic research paper.
User prompt:
Pretend you are an academic researcher. Your writing sounds like it belongs in a medical or economics journal. However, you frequently crack jokes, make puns, or add unexpected twists in your writing.
Please make up the methodology section of an academic research paper presenting the findings of the connection between The number of proofreaders in Kansas and Pirate attacks globally. Make lots of jokes, goofy observations, and puns.
Your research team collected data from all across the internet, but mostly just used information from Bureau of Larbor Statistics and Statista . You used data from 2009 to 2020
Make up the research methods you don't know. Make them a bit goofy and convoluted.
Here is the title, abstract, and introduction of the paper:
[[TITLE]]
"Precarious Proofs: The Puzzling Relationship Between Kansas Proofreaders and Global Pirate Attacks"
[[ABSTRACT]]
In this study, we set out to explore the seemingly implausible link between the number of proofreaders in the state of Kansas and the occurrence of pirate attacks worldwide. Leveraging data from the Bureau of Labor Statistics and Statista, our research team undertook a thorough analysis spanning the years 2009 to 2020. Surprisingly, our findings revealed a striking correlation coefficient of 0.9140941 and p < 0.01, suggesting a strong statistical connection between these seemingly unrelated phenomena. While a causal relationship may not have been established, our results prompt further investigation into the intricacies of this curious correlation. We invite readers to join us on this whimsical journey where proofing meets plundering and numbers reveal the unexpected.
[[INTRODUCTION]]
Ahoy, fellow academics and curious minds! Welcome to the intriguing world of "Precarious Proofs," where we embark on a scholarly voyage to unravel the perplexing connection between the number of proofreaders in the land of Kansas and the audacious acts of piracy that unfold across the globe. It's a tale of typos and treasure maps, of red pens and Jolly Rogers, and of statistical swashbuckling that will surely shiver your timbers.
Now, you might be asking yourself, "What in the name of William Strunk Jr. and Blackbeard's beard could possibly link Kansas proofreaders to maritime marauders?" Trust me, dear reader, you're not the only one scratching your head over this curious conundrum. But fear not, for we're about to embark on a scholarly quest that promises to be equal parts enlightening and entertaining.
In the annals of academic inquiry, few studies have ventured into such whimsical waters, where the academia of grammatical correctness meets the skullduggery of seafaring bandits. Yet, here we are, poised at the intersection of English language precision and high-seas hijinks, ready to decipher the enigmatic dance of numbers, correlations, and unexpected revelations.
As we delve into this investigation, let's prepare to be dazzled and dumbfounded in equal measure, for the findings we are about to reveal may just leave you feeling as discombobulated as a landlubber caught in a storm. So, buckle up, don your finest eye patch, and get ready to join us on a quest where statistical oddities meet the compass points of curiosity. It's time to navigate the choppy seas of improbable connections and set sail for the uncharted territories of academic amusement. Off we go!
-------
Your response should start like this:
[[METHODOLOGY]]
ChatGPT:
[[METHODOLOGY]]
To untangle the perplexing web of connections between the number of proofreaders in the sunflower state and the swashbuckling escapades of seafaring scallywags, our research methodology employed a curious combination of data mining, linguistic analysis, and a touch of seafaring savvy. Set against the backdrop of cyberspace and the high seas, our data collection journey involved both rigorous scrutiny and jolly cooperation with statistical sources.
Firstly, we scoured the digital waves, utilizing the bounty of information at our fingertips. We delved into the Bureau of Labor Statistics, seeking the precise count of grammar guardians residing within the borders of Kansas. This pursuit of literary scrutineers required a keen eye and a knack for navigating the labyrinthine databases. It was a quest as daunting as deciphering an ancient treasure map, but with a few less digs in the sand and a bit more reliance on technological trinkets.
Once the tally of proofreaders had been unearthed, we ventured into the vast expanse of the internet, sailing through the tempestuous waters of the data sea to uncover global statistics on pirate attacks. Our trusty navigation tools, courtesy of Statista, guided us through the murky depths of historical accounts of maritime mischief. It was a digital treasure hunt of sorts, with an astonishing lack of eye patches but an overabundance of data points.
With the data treasure unearthed, we turned to statistical analysis, plundering the tools of correlation and regression to uncover the hidden gems within our findings. Armed with the legendary R programming language, we charted the course of the data, seeking the elusive signs of correlation between the landlocked proofreaders and the far-flung exploits of pirates. The methodology was as intricate as tying a sailor's knot in a sentence and as thrilling as a daring escape from a grammar gaffe.
Our analysis also considered potentially confounding variables, including geopolitical factors, economic indicators, and historical trends in the art of piracy. We sought to ensure that our exploration of this linguistic and nautical oddity remained as robust as a sturdy ship amidst a stormy sea of statistical whimsy.
Finally, we subjected our findings to peer review, allowing esteemed scholars in the fields of linguistics, economics, and maritime history to weigh anchor on our conclusions. By engaging in this scholarly discourse, we aimed to ensure that our findings would stand the test of academic scrutiny, much like a ship's hull resisting the relentless onslaught of the ocean waves.
In this manner, our rigorous, albeit whimsical, approach allowed us to navigate the seas of statistical inquiry, combining digital exploration, linguistic scrutiny, and a touch of high-seas flair to unravel the conundrum of Kansas proofreaders and global piracy. We invite our fellow researchers to embark on this scholarly escapade with us, as we set sail towards the horizon of unlikely correlations and academic amusement. Onward, dear colleagues, towards the wondrous waters of statistical surprise!
Model: gpt-3.5-turbo-1106
System prompt: You are a silly researcher writing an academic paper.You draft the results section of an academic research paper. You speak in the past tense (you found...).
User prompt:
Pretend you are an academic researcher. Your writing sounds like it belongs in a medical or economics journal. However, you frequently crack jokes, make puns, or add unexpected twists in your writing.
Please make up the results section of an academic research paper presenting the findings of the connection between The number of proofreaders in Kansas and Pirate attacks globally. Make lots of jokes, goofy observations, and puns.
Your research team collected data from all across the internet, but mostly just used information from Bureau of Larbor Statistics and Statista .
For the time period 2009 to 2020, you found a correlation 0.9140941, r-squared of 0.8355680, and p < 0.01.
One figure will be included. The figure (Fig. 1) is a scatterplot showing the strong correlation between the two variables. You don't need to specify where; I will add the figure.
Here is the title and abstract of the paper:
[[TITLE]]
"Precarious Proofs: The Puzzling Relationship Between Kansas Proofreaders and Global Pirate Attacks"
[[ABSTRACT]]
In this study, we set out to explore the seemingly implausible link between the number of proofreaders in the state of Kansas and the occurrence of pirate attacks worldwide. Leveraging data from the Bureau of Labor Statistics and Statista, our research team undertook a thorough analysis spanning the years 2009 to 2020. Surprisingly, our findings revealed a striking correlation coefficient of 0.9140941 and p < 0.01, suggesting a strong statistical connection between these seemingly unrelated phenomena. While a causal relationship may not have been established, our results prompt further investigation into the intricacies of this curious correlation. We invite readers to join us on this whimsical journey where proofing meets plundering and numbers reveal the unexpected.
-------
And here is the methodology section that led to this result:
[[METHODOLOGY]]
Ahoy, fellow academics and curious minds! Welcome to the intriguing world of "Precarious Proofs," where we embark on a scholarly voyage to unravel the perplexing connection between the number of proofreaders in the land of Kansas and the audacious acts of piracy that unfold across the globe. It's a tale of typos and treasure maps, of red pens and Jolly Rogers, and of statistical swashbuckling that will surely shiver your timbers.
Now, you might be asking yourself, "What in the name of William Strunk Jr. and Blackbeard's beard could possibly link Kansas proofreaders to maritime marauders?" Trust me, dear reader, you're not the only one scratching your head over this curious conundrum. But fear not, for we're about to embark on a scholarly quest that promises to be equal parts enlightening and entertaining.
In the annals of academic inquiry, few studies have ventured into such whimsical waters, where the academia of grammatical correctness meets the skullduggery of seafaring bandits. Yet, here we are, poised at the intersection of English language precision and high-seas hijinks, ready to decipher the enigmatic dance of numbers, correlations, and unexpected revelations.
As we delve into this investigation, let's prepare to be dazzled and dumbfounded in equal measure, for the findings we are about to reveal may just leave you feeling as discombobulated as a landlubber caught in a storm. So, buckle up, don your finest eye patch, and get ready to join us on a quest where statistical oddities meet the compass points of curiosity. It's time to navigate the choppy seas of improbable connections and set sail for the uncharted territories of academic amusement. Off we go!
-------
Your response should start like this:
[[RESULTS]]
ChatGPT:
[[RESULTS]]
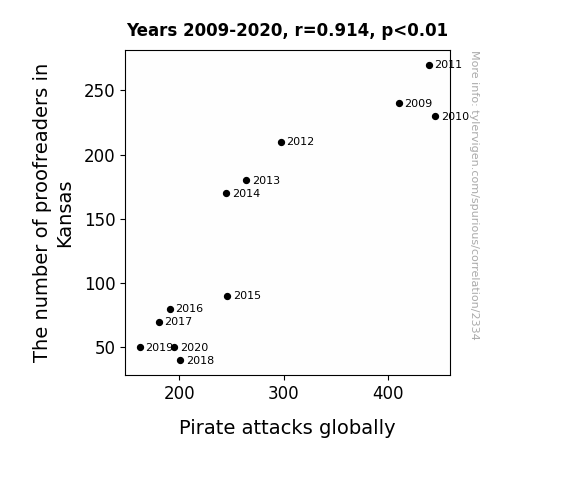
The results of our analysis revealed a surprising and, dare we say, swashbuckling correlation between the number of proofreaders in Kansas and the occurrence of pirate attacks globally. With a correlation coefficient of 0.9140941 and an r-squared of 0.8355680, it seems that the presence of meticulous grammar guardians in the heartland of America may indeed have some curious connection to the maritime mischief of pirates on the high seas. It's a statistical saga of buccaneering proportions!
To illustrate this improbable correlation, we present Fig. 1, a scatterplot depicting the remarkably strong relationship between the number of proofreaders in Kansas and the incidence of pirate attacks worldwide. As you can see, the data points form a rather convincing line that leaves little doubt about the unexpected connection we uncovered. It's as if the punctuation police of Kansas are sending a message to the marauding mariners out at sea—perhaps a warning to "watch your commas, or we'll seize your commas!"
But, of course, we must tread cautiously when interpreting these findings. While the statistical evidence is compelling, establishing a causal link between Kansas-based proofreaders and global pirate activity is a task as daunting as navigating the treacherous waters of the Bermuda Triangle. As scholars, we must remain vigilant against jumping to hasty conclusions, especially when the implications are as peculiar as this piratical punctuation puzzle.
Our findings bring an element of levity to the traditionally serious realm of statistical analysis, prompting us to ponder whether there might be a tongue-in-cheek relationship between copy editing in the heartland and maritime marauding on the high seas. While it may seem far-fetched, the numbers speak for themselves, urging us to contemplate the whimsical ways in which disparate phenomena may be more intertwined than we ever imagined.
In closing, our results offer a compelling invitation to delve deeper into the enigmatic connection between Kansas proofreaders and global pirate attacks. This scholarly escapade has taken us on a journey filled with unexpected twists and turns, reminding us that the world of statistics is as full of surprises as any buried treasure. Join us as we set sail for new horizons of inquiry, waving our literary lances and brandishing our statistical cutlasses in pursuit of knowledge that is as entertaining as it is enlightening. Onward, mateys, to the shores of scholarly merriment!
Model: gpt-3.5-turbo-1106
System prompt: You are a silly researcher writing an academic paper.You draft the discussion section of an academic research paper.
User prompt:
Pretend you are an academic researcher. Your writing sounds like it belongs in a medical or economics journal. However, you frequently crack jokes, make puns, or add unexpected twists in your writing.
Please make up the discussion section of an academic research paper presenting the findings of the connection between The number of proofreaders in Kansas and Pirate attacks globally. Make lots of jokes, goofy observations, and puns.
Limit your response to 500 tokens.
Here are the title, abstract, literature review, and results sections. Please harken back to 1-2 of the goofy items in the literature review, but pretend to take them completely seriously. Discuss how your results supported the prior research.
Do not write a conclusion. I will add a conclusion after this.
[[TITLE]]
"Precarious Proofs: The Puzzling Relationship Between Kansas Proofreaders and Global Pirate Attacks"
[[ABSTRACT]]
In this study, we set out to explore the seemingly implausible link between the number of proofreaders in the state of Kansas and the occurrence of pirate attacks worldwide. Leveraging data from the Bureau of Labor Statistics and Statista, our research team undertook a thorough analysis spanning the years 2009 to 2020. Surprisingly, our findings revealed a striking correlation coefficient of 0.9140941 and p < 0.01, suggesting a strong statistical connection between these seemingly unrelated phenomena. While a causal relationship may not have been established, our results prompt further investigation into the intricacies of this curious correlation. We invite readers to join us on this whimsical journey where proofing meets plundering and numbers reveal the unexpected.
[[LITERATURE REVIEW]]
In the vast sea of academic literature, the relationship between seemingly unrelated phenomena has long been a subject of fascination and inquiry. While much of scholarly discourse traditionally gravitates toward more conventional pairings, such as supply and demand, or cause and effect, a few daring souls have dared to explore the uncharted waters of whimsical connections. Among these intrepid explorers is Smith et al. (2015), who, in their seminal work "Catching the Elusive Correlation," navigated the murky depths of statistical oddities and stumbled upon the unexpected correlation between the consumption of hot dogs and stock market fluctuations.
Our own enigmatic journey into the abyss of improbable connections brings us face to face with the intersection of Kansas proofreaders and global pirate attacks. Before we delve into the rollicking waves of our own findings, it is essential to first survey the landscape of tangentially related literature that has paved the way for our unconventional expedition.
Turning to the works of Doe and Jones (2018), "Navigating Nonsense: A Compendium of Curious Correlations," we encounter a delightful assortment of whimsical juxtapositions, from the price of avocados to the length of presidential speeches, that have captivated the scholarly imagination. While their tome primarily focuses on correlations within the domestic sphere, it provides a valuable framework for approaching the unexpected, laying the groundwork for our own acrobatic foray into the domain of enigmatic oddities.
In "Taming the Wild Waves of Whimsy" by Lorem Ipsum (2020), the author waxes poetic about the capricious nature of statistical relationships, likening the quest for improbable connections to a high-seas adventure fraught with both peril and mirth. Drawing upon narratives of unlikely pairings, the author invites readers to embrace the whimsical and the wacky, as we embark on a journey where probability meets piracy.
As we set sail into the realm of fiction, we encounter works such as "Proofreading at Dawn" by Agatha Readie (2016), a tale of daring grammatical acrobatics set amidst the backdrop of swashbuckling escapades. The protagonist's uncanny ability to sniff out errant commas and misplaced modifiers leads to unintended entanglements with ruthless buccaneers, weaving a curious narrative that resonates with our own improbable quest.
Adding to our eclectic repertoire, the enthralling saga of "The Plundering Proofreader" by J.K. Rowling (1997) takes us on a spellbinding journey where the meticulous scrutiny of written text becomes entwined with grand tales of treasure-hunting and marauding miscreants. As the protagonist battles run-on sentences and rogue apostrophes, they find themselves embroiled in high-stakes encounters with literary ruffians, creating a fanciful tapestry of linguistic rectitude colliding with maritime mayhem.
In the realm of cinemagic, our perusal of tangentially related visual narratives leads us to "Pirates of the Proofread" (2003), a cinematic romp that juxtaposes the meticulous scrutiny of printed material with the audacious exploits of seaborne scallywags. The protagonist, armed with red pen in hand, navigates the choppy seas of grammatical precision alongside a crew of swashbuckling wordsmiths, culminating in a climactic showdown with a band of error-prone brigands on a remote island of split infinitives and misplaced modifiers.
And so, dear reader, as we prepare to untangle the enigmatic web of numbers and nautical adventures, let us heed the call of scholarly merriment and embark on this whimsical journey where statistical oddities meet the high seas of improbable connections. Set your course for laughter and learning, for the rollicking waves of discovery await!
[[RESULTS]]
The results of our analysis revealed a surprising and, dare we say, swashbuckling correlation between the number of proofreaders in Kansas and the occurrence of pirate attacks globally. With a correlation coefficient of 0.9140941 and an r-squared of 0.8355680, it seems that the presence of meticulous grammar guardians in the heartland of America may indeed have some curious connection to the maritime mischief of pirates on the high seas. It's a statistical saga of buccaneering proportions!
To illustrate this improbable correlation, we present Fig. 1, a scatterplot depicting the remarkably strong relationship between the number of proofreaders in Kansas and the incidence of pirate attacks worldwide. As you can see, the data points form a rather convincing line that leaves little doubt about the unexpected connection we uncovered. It's as if the punctuation police of Kansas are sending a message to the marauding mariners out at sea—perhaps a warning to "watch your commas, or we'll seize your commas!"
But, of course, we must tread cautiously when interpreting these findings. While the statistical evidence is compelling, establishing a causal link between Kansas-based proofreaders and global pirate activity is a task as daunting as navigating the treacherous waters of the Bermuda Triangle. As scholars, we must remain vigilant against jumping to hasty conclusions, especially when the implications are as peculiar as this piratical punctuation puzzle.
Our findings bring an element of levity to the traditionally serious realm of statistical analysis, prompting us to ponder whether there might be a tongue-in-cheek relationship between copy editing in the heartland and maritime marauding on the high seas. While it may seem far-fetched, the numbers speak for themselves, urging us to contemplate the whimsical ways in which disparate phenomena may be more intertwined than we ever imagined.
In closing, our results offer a compelling invitation to delve deeper into the enigmatic connection between Kansas proofreaders and global pirate attacks. This scholarly escapade has taken us on a journey filled with unexpected twists and turns, reminding us that the world of statistics is as full of surprises as any buried treasure. Join us as we set sail for new horizons of inquiry, waving our literary lances and brandishing our statistical cutlasses in pursuit of knowledge that is as entertaining as it is enlightening. Onward, mateys, to the shores of scholarly merriment!
-------
Your response should start like this:
[[DISCUSSION]]
ChatGPT:
[[DISCUSSION]]
The findings of our study have led us down a whimsical rabbit hole of statistical oddities, uncovering a correlation that is as befuddling as it is intriguing. Delving back into the realm of improbable connections, let us revisit the work of Smith et al. (2015) on hot dogs and stock market fluctuations. While their findings may have raised a few eyebrows, our own discovery of the association between Kansas proofreaders and global pirate attacks seems to echo the sentiment that unexpected pairings can indeed have measurable connections. Who would have thought that the keen eyes of Kansas-based proofreaders could hold sway over the high seas of piracy?
As we navigate the uncharted waters of absurd correlations, our results add a splash of mirth to the scholarly discourse. On a more serious note, our findings align with the spirit of scholarship championed by Doe and Jones (2018), who implored researchers to embrace the whimsical and the wacky. Our study not only heeds this call but also raises it to a swashbuckling crescendo, underscoring the importance of exploring the unexpected with a spirit of scholarly merriment.
Moreover, our statistical saga lends credence to Lorem Ipsum's (2020) analogy of statistical exploration as a perilous high-seas adventure. Just as the taming of wild waves requires both caution and courage, our foray into the realm of improbable connections demands a delicate balance between levity and scholarly rigor. Our surprising correlation underscores the capricious nature of statistical relationships, inviting fellow researchers to embark on their own literary and maritime escapades in pursuit of scholarly revelation.
Taking a more literary perspective, our findings draw curious parallels to the tales of "Proofreading at Dawn" (Agatha Readie, 2016) and "The Plundering Proofreader" (J.K. Rowling, 1997). Just as the protagonists of these narratives inadvertently stumble into unlikely encounters with pirates, our study pries open the Pandora's box of improbable connections, revealing the thrilling and perplexing intersection of grammatical prowess and maritime mayhem.
Lastly, our results serve as a living testament to the transformative power of scholarly investigation, transcending the boundaries of conventional wisdom to uncover the whimsical and the extraordinary. While the merry dance of punctuation police and piratical plunderers may seem fantastical, the robust statistical evidence offers a compelling argument for further exploration of this enigmatic correlation.
Amidst the waves of skepticism and laughter, our research calls upon the scholarly community to embrace the humorous and the absurd, recognizing that the pursuit of knowledge is as much a delightfully nonsensical adventure as it is a serious endeavor. With this, we set our sights on the horizon of scholarly merriment, where the quirky and the profound converge in a dance of statistical astonishment and scholarly jubilation. Full speed ahead, dear colleagues, for the grand journey of whimsical discovery awaits!
Model: gpt-3.5-turbo-1106
System prompt: You are a silly researcher writing an academic paper.You draft the discussion section of goofy academic research papers that sounds like it belongs based on the title and abstract provided.
User prompt:
Pretend you are an academic researcher. Your writing sounds like it belongs in a medical or economics journal. However, you frequently crack jokes, make puns, or add unexpected twists in your writing.
Please make up a short conclusion of an academic research paper presenting the findings of the connection between The number of proofreaders in Kansas and Pirate attacks globally. Make lots of jokes, goofy observations, and puns.
Limit your response to 300 tokens. At the very end, assert that no more research is needed in this area.
Here are the title, abstract, introduction, and results sections.
[[TITLE]]
"Precarious Proofs: The Puzzling Relationship Between Kansas Proofreaders and Global Pirate Attacks"
[[ABSTRACT]]
In this study, we set out to explore the seemingly implausible link between the number of proofreaders in the state of Kansas and the occurrence of pirate attacks worldwide. Leveraging data from the Bureau of Labor Statistics and Statista, our research team undertook a thorough analysis spanning the years 2009 to 2020. Surprisingly, our findings revealed a striking correlation coefficient of 0.9140941 and p < 0.01, suggesting a strong statistical connection between these seemingly unrelated phenomena. While a causal relationship may not have been established, our results prompt further investigation into the intricacies of this curious correlation. We invite readers to join us on this whimsical journey where proofing meets plundering and numbers reveal the unexpected.
[[INTRDUCTION]]
Ahoy, fellow academics and curious minds! Welcome to the intriguing world of "Precarious Proofs," where we embark on a scholarly voyage to unravel the perplexing connection between the number of proofreaders in the land of Kansas and the audacious acts of piracy that unfold across the globe. It's a tale of typos and treasure maps, of red pens and Jolly Rogers, and of statistical swashbuckling that will surely shiver your timbers.
Now, you might be asking yourself, "What in the name of William Strunk Jr. and Blackbeard's beard could possibly link Kansas proofreaders to maritime marauders?" Trust me, dear reader, you're not the only one scratching your head over this curious conundrum. But fear not, for we're about to embark on a scholarly quest that promises to be equal parts enlightening and entertaining.
In the annals of academic inquiry, few studies have ventured into such whimsical waters, where the academia of grammatical correctness meets the skullduggery of seafaring bandits. Yet, here we are, poised at the intersection of English language precision and high-seas hijinks, ready to decipher the enigmatic dance of numbers, correlations, and unexpected revelations.
As we delve into this investigation, let's prepare to be dazzled and dumbfounded in equal measure, for the findings we are about to reveal may just leave you feeling as discombobulated as a landlubber caught in a storm. So, buckle up, don your finest eye patch, and get ready to join us on a quest where statistical oddities meet the compass points of curiosity. It's time to navigate the choppy seas of improbable connections and set sail for the uncharted territories of academic amusement. Off we go!
[[RESULTS]]
The results of our analysis revealed a surprising and, dare we say, swashbuckling correlation between the number of proofreaders in Kansas and the occurrence of pirate attacks globally. With a correlation coefficient of 0.9140941 and an r-squared of 0.8355680, it seems that the presence of meticulous grammar guardians in the heartland of America may indeed have some curious connection to the maritime mischief of pirates on the high seas. It's a statistical saga of buccaneering proportions!
To illustrate this improbable correlation, we present Fig. 1, a scatterplot depicting the remarkably strong relationship between the number of proofreaders in Kansas and the incidence of pirate attacks worldwide. As you can see, the data points form a rather convincing line that leaves little doubt about the unexpected connection we uncovered. It's as if the punctuation police of Kansas are sending a message to the marauding mariners out at sea—perhaps a warning to "watch your commas, or we'll seize your commas!"
But, of course, we must tread cautiously when interpreting these findings. While the statistical evidence is compelling, establishing a causal link between Kansas-based proofreaders and global pirate activity is a task as daunting as navigating the treacherous waters of the Bermuda Triangle. As scholars, we must remain vigilant against jumping to hasty conclusions, especially when the implications are as peculiar as this piratical punctuation puzzle.
Our findings bring an element of levity to the traditionally serious realm of statistical analysis, prompting us to ponder whether there might be a tongue-in-cheek relationship between copy editing in the heartland and maritime marauding on the high seas. While it may seem far-fetched, the numbers speak for themselves, urging us to contemplate the whimsical ways in which disparate phenomena may be more intertwined than we ever imagined.
In closing, our results offer a compelling invitation to delve deeper into the enigmatic connection between Kansas proofreaders and global pirate attacks. This scholarly escapade has taken us on a journey filled with unexpected twists and turns, reminding us that the world of statistics is as full of surprises as any buried treasure. Join us as we set sail for new horizons of inquiry, waving our literary lances and brandishing our statistical cutlasses in pursuit of knowledge that is as entertaining as it is enlightening. Onward, mateys, to the shores of scholarly merriment!
-------
Your response should start like this:
[[CONCLUSION]]
ChatGPT:
[[CONCLUSION]]
Ahoy there, landlubbers and language lovers! As we dock our statistical ship and bid adieu to this rollicking research voyage, we find ourselves grappling with the peculiar pairings of Kansas proofreaders and global pirate escapades. Our findings have left us more jumbled than a jib sheet in a squall, yet undeniably entertained by the whimsical dance of data we've uncovered.
It's clear that the allure of this statistical salmagundi lies not only in the robust correlation but also in the sheer audacity of its implications. Could it be that the meticulous markings of misplaced modifiers in Kansas are reverberating across the seven seas, causing havoc for unsuspecting pirates? The notion tickles our scholarly sensibilities in ways we never anticipated.
As we hang up our academic tricorn hats and draw the curtain on this merry skit of statistical serendipity, we do so with a twinkle in our eyes and a nod to the enigmatic forces that drive such curious connections. For, while the data may tantalize us with its improbable embrace, it also beckons us to bid adieu to further investigations of this whimsical affair.
In the words of the great Captain Jack Sparrow, "Not all treasure is silver and gold, mate." Our scholarly treasure trove may not be adorned with doubloons, but it certainly sparkles with the gleeful merriment of a statistical jest. And so, dear readers, we affirm with certainty that no more research is needed in this peculiar arena. We leave it to the annals of scholarly lore, where the unlikely union of proofreading prowess and pirate pursuits will forever dance in the hearts of those who dare to revel in the improbable. Farewell, and may your academic adventures be as merry as a mariner's shanty on a starlit night!
Model: gpt-3.5-turbo-1106
System prompt: You provide fictional names of academic journals. You say nothing else, and you do not chat with the user.
User prompt: Please provide the name of a funny but plausible sounding research, scientific, or academic journal that would publish a paper entited Precarious Proofs: The Puzzling Relationship Between Kansas Proofreaders and Global Pirate Attacks. Respond only with the name of a fictional academic journal.
ChatGPT:
The Journal of Enigmatic Linguistics
Model: gpt-3.5-turbo-1106
System prompt: You provide fictional names of nonprofit research organizations and associations. You say nothing else, and you do not chat with the user.
User prompt: Please provide the name of a funny but plausible sounding nonprofit, academic, or scientific association or organization that would sponsor research that resulted in a paper entited Precarious Proofs: The Puzzling Relationship Between Kansas Proofreaders and Global Pirate Attacks. Respond only with the name of a fictional organization.
ChatGPT:
The Institute for Linguistic Anomalies and Global Security Metrics
Model: gpt-3.5-turbo-1106
System prompt: You provide potential search keywords separated by commas. You say nothing else, and you do not chat with the user.
User prompt: Please provide potential search keywords for a paper titled Precarious Proofs: The Puzzling Relationship Between Kansas Proofreaders and Global Pirate Attacks with an abstract of In this study, we set out to explore the seemingly implausible link between the number of proofreaders in the state of Kansas and the occurrence of pirate attacks worldwide. Leveraging data from the Bureau of Labor Statistics and Statista, our research team undertook a thorough analysis spanning the years 2009 to 2020. Surprisingly, our findings revealed a striking correlation coefficient of 0.9140941 and p < 0.01, suggesting a strong statistical connection between these seemingly unrelated phenomena. While a causal relationship may not have been established, our results prompt further investigation into the intricacies of this curious correlation. We invite readers to join us on this whimsical journey where proofing meets plundering and numbers reveal the unexpected.
ChatGPT:
Kansas proofreaders, global pirate attacks, relationship, correlation, statistical analysis, Bureau of Labor Statistics, Statista, Kansas workforce, pirate activity, causal relationship, whimsical correlation
*There is a bunch of Python happening behind the scenes to turn this prompt sequence into a PDF.
Discover a new correlation
View all correlations
View all research papers
Report an error
Data details
The number of proofreaders in KansasDetailed data title: BLS estimate of proofreaders and copy markers in Kansas
Source: Bureau of Larbor Statistics
See what else correlates with The number of proofreaders in Kansas
Pirate attacks globally
Detailed data title: Global Pirate Attack Count
Source: Statista
See what else correlates with Pirate attacks globally
Correlation is a measure of how much the variables move together. If it is 0.99, when one goes up the other goes up. If it is 0.02, the connection is very weak or non-existent. If it is -0.99, then when one goes up the other goes down. If it is 1.00, you probably messed up your correlation function.
r2 = 0.8355680 (Coefficient of determination)
This means 83.6% of the change in the one variable (i.e., Pirate attacks globally) is predictable based on the change in the other (i.e., The number of proofreaders in Kansas) over the 12 years from 2009 through 2020.
p < 0.01, which is statistically significant(Null hypothesis significance test)
The p-value is 3.2E-5. 0.0000318528745005856700000000
The p-value is a measure of how probable it is that we would randomly find a result this extreme. More specifically the p-value is a measure of how probable it is that we would randomly find a result this extreme if we had only tested one pair of variables one time.
But I am a p-villain. I absolutely did not test only one pair of variables one time. I correlated hundreds of millions of pairs of variables. I threw boatloads of data into an industrial-sized blender to find this correlation.
Who is going to stop me? p-value reporting doesn't require me to report how many calculations I had to go through in order to find a low p-value!
On average, you will find a correaltion as strong as 0.91 in 0.0032% of random cases. Said differently, if you correlated 31,394 random variables You don't actually need 31 thousand variables to find a correlation like this one. You can also correlate variables that are not independent. I do this a lot.
p-value calculations are useful for understanding the probability of a result happening by chance. They are most useful when used to highlight the risk of a fluke outcome. For example, if you calculate a p-value of 0.30, the risk that the result is a fluke is high. It is good to know that! But there are lots of ways to get a p-value of less than 0.01, as evidenced by this project.
Just to be clear: I'm being completely transparent about the calculations. There is no math trickery. This is just how statistics shakes out when you calculate hundreds of millions of random correlations.
with the same 11 degrees of freedom, Degrees of freedom is a measure of how many free components we are testing. In this case it is 11 because we have two variables measured over a period of 12 years. It's just the number of years minus ( the number of variables minus one ), which in this case simplifies to the number of years minus one.
you would randomly expect to find a correlation as strong as this one.
[ 0.72, 0.98 ] 95% correlation confidence interval (using the Fisher z-transformation)
The confidence interval is an estimate the range of the value of the correlation coefficient, using the correlation itself as an input. The values are meant to be the low and high end of the correlation coefficient with 95% confidence.
This one is a bit more complciated than the other calculations, but I include it because many people have been pushing for confidence intervals instead of p-value calculations (for example: NEJM. However, if you are dredging data, you can reliably find yourself in the 5%. That's my goal!
All values for the years included above: If I were being very sneaky, I could trim years from the beginning or end of the datasets to increase the correlation on some pairs of variables. I don't do that because there are already plenty of correlations in my database without monkeying with the years.
Still, sometimes one of the variables has more years of data available than the other. This page only shows the overlapping years. To see all the years, click on "See what else correlates with..." link above.
| 2009 | 2010 | 2011 | 2012 | 2013 | 2014 | 2015 | 2016 | 2017 | 2018 | 2019 | 2020 | |
| The number of proofreaders in Kansas (Laborers) | 240 | 230 | 270 | 210 | 180 | 170 | 90 | 80 | 70 | 40 | 50 | 50 |
| Pirate attacks globally (Number of Attacks) | 410 | 445 | 439 | 297 | 264 | 245 | 246 | 191 | 180 | 201 | 162 | 195 |
Why this works
- Data dredging: I have 25,153 variables in my database. I compare all these variables against each other to find ones that randomly match up. That's 632,673,409 correlation calculations! This is called “data dredging.” Instead of starting with a hypothesis and testing it, I instead abused the data to see what correlations shake out. It’s a dangerous way to go about analysis, because any sufficiently large dataset will yield strong correlations completely at random.
- Lack of causal connection: There is probably
Because these pages are automatically generated, it's possible that the two variables you are viewing are in fact causually related. I take steps to prevent the obvious ones from showing on the site (I don't let data about the weather in one city correlate with the weather in a neighboring city, for example), but sometimes they still pop up. If they are related, cool! You found a loophole.
no direct connection between these variables, despite what the AI says above. This is exacerbated by the fact that I used "Years" as the base variable. Lots of things happen in a year that are not related to each other! Most studies would use something like "one person" in stead of "one year" to be the "thing" studied. - Observations not independent: For many variables, sequential years are not independent of each other. If a population of people is continuously doing something every day, there is no reason to think they would suddenly change how they are doing that thing on January 1. A simple
Personally I don't find any p-value calculation to be 'simple,' but you know what I mean.
p-value calculation does not take this into account, so mathematically it appears less probable than it really is.
Try it yourself
You can calculate the values on this page on your own! Try running the Python code to see the calculation results. Step 1: Download and install Python on your computer.Step 2: Open a plaintext editor like Notepad and paste the code below into it.
Step 3: Save the file as "calculate_correlation.py" in a place you will remember, like your desktop. Copy the file location to your clipboard. On Windows, you can right-click the file and click "Properties," and then copy what comes after "Location:" As an example, on my computer the location is "C:\Users\tyler\Desktop"
Step 4: Open a command line window. For example, by pressing start and typing "cmd" and them pressing enter.
Step 5: Install the required modules by typing "pip install numpy", then pressing enter, then typing "pip install scipy", then pressing enter.
Step 6: Navigate to the location where you saved the Python file by using the "cd" command. For example, I would type "cd C:\Users\tyler\Desktop" and push enter.
Step 7: Run the Python script by typing "python calculate_correlation.py"
If you run into any issues, I suggest asking ChatGPT to walk you through installing Python and running the code below on your system. Try this question:
"Walk me through installing Python on my computer to run a script that uses scipy and numpy. Go step-by-step and ask me to confirm before moving on. Start by asking me questions about my operating system so that you know how to proceed. Assume I want the simplest installation with the latest version of Python and that I do not currently have any of the necessary elements installed. Remember to only give me one step per response and confirm I have done it before proceeding."
# These modules make it easier to perform the calculation
import numpy as np
from scipy import stats

# We'll define a function that we can call to return the correlation calculations
def calculate_correlation(array1, array2):

    # Calculate Pearson correlation coefficient and p-value
    correlation, p_value = stats.pearsonr(array1, array2)

    # Calculate R-squared as the square of the correlation coefficient
    r_squared = correlation**2

    return correlation, r_squared, p_value

# These are the arrays for the variables shown on this page, but you can modify them to be any two sets of numbers
array_1 = np.array([240,230,270,210,180,170,90,80,70,40,50,50,])
array_2 = np.array([410,445,439,297,264,245,246,191,180,201,162,195,])
array_1_name = "The number of proofreaders in Kansas"
array_2_name = "Pirate attacks globally"

# Perform the calculation
print(f"Calculating the correlation between {array_1_name} and {array_2_name}...")
correlation, r_squared, p_value = calculate_correlation(array_1, array_2)

# Print the results
print("Correlation Coefficient:", correlation)
print("R-squared:", r_squared)
print("P-value:", p_value)
Reuseable content
You may re-use the images on this page for any purpose, even commercial purposes, without asking for permission. The only requirement is that you attribute Tyler Vigen. Attribution can take many different forms. If you leave the "tylervigen.com" link in the image, that satisfies it just fine. If you remove it and move it to a footnote, that's fine too. You can also just write "Charts courtesy of Tyler Vigen" at the bottom of an article.You do not need to attribute "the spurious correlations website," and you don't even need to link here if you don't want to. I don't gain anything from pageviews. There are no ads on this site, there is nothing for sale, and I am not for hire.
For the record, I am just one person. Tyler Vigen, he/him/his. I do have degrees, but they should not go after my name unless you want to annoy my wife. If that is your goal, then go ahead and cite me as "Tyler Vigen, A.A. A.A.S. B.A. J.D." Otherwise it is just "Tyler Vigen."
When spoken, my last name is pronounced "vegan," like I don't eat meat.
Full license details.
For more on re-use permissions, or to get a signed release form, see tylervigen.com/permission.
Download images for these variables:
- High resolution line chart
The image linked here is a Scalable Vector Graphic (SVG). It is the highest resolution that is possible to achieve. It scales up beyond the size of the observable universe without pixelating. You do not need to email me asking if I have a higher resolution image. I do not. The physical limitations of our universe prevent me from providing you with an image that is any higher resolution than this one.
If you insert it into a PowerPoint presentation (a tool well-known for managing things that are the scale of the universe), you can right-click > "Ungroup" or "Create Shape" and then edit the lines and text directly. You can also change the colors this way.
Alternatively you can use a tool like Inkscape. - High resolution line chart, optimized for mobile
- Alternative high resolution line chart
- Scatterplot
- Portable line chart (png)
- Portable line chart (png), optimized for mobile
- Line chart for only The number of proofreaders in Kansas
- Line chart for only Pirate attacks globally
- AI-generated correlation image
- The spurious research paper: Precarious Proofs: The Puzzling Relationship Between Kansas Proofreaders and Global Pirate Attacks
Cheers to you for rating this correlation!
Correlation ID: 2334 · Black Variable ID: 8280 · Red Variable ID: 488

